


Introduction
The ocean has warmed unabated since 1970 and has taken up more than 90% of the excess heat contributed by global warming. The rate of ocean warming has more than doubled since 1993 (IPCC, 2019). Intergovernmental Panels on Climate Change (IPCC, 2021) also reported the linear ocean warming trends for the 0–700 m and 700–2,000 m layers of the global ocean, respectively, of 4.35 ± 0.8 and 2.25 ± 0.64 ZJ/yr over 1970–2017. These trends over 2005–2017 were respectively 5.31 ± 0.48 and 4.02 ± 0.97 ZJ/yr. The global ocean below 2,000 m had simultaneously warmed since 1992. World Meteorological Organization (WMO, 2023) presented that ocean warming rates were particularly high in the past two decades: the rate of global ocean warming for 0–2,000 m was 0.7 ± 0.1 W m–2 from 1971 to 2022, but 1.2 ± 0.2 W m–2 from 2006 to 2022. They also described that deep ocean warming below a depth 2,000 m is estimated to have been 0.0725 ± 0.1 W m–2 from 1992 to 2022. The results by these two important reports mean that the global ocean warming has significantly accelerated and all layers of global ocean has rapidly warmed in recent. These accelerated ocean warming should be influenced to ocean ecosystem and fisheries.
As with heatwaves and cold spells on land by climate change, marine heatwaves (MHWs) and marine cold spells (MCS) are prolonged periods of extreme heat or cold in the coastal area and oceans that can have a range of consequences for marine life and dependent communities (WMO, 2023). WMO also reported that 58% and 25% of the ocean surface experienced at least one MHWs and MCSs in respective during 2022. The global averaged trend in annual MHWs days increased 8.4 days/decade and MCSs days decreased 9.4 days/decade. In addition, the trend in global averaged MHWs intensity was 0.081°C/decade, and larger than the trend in MCSs intensity of 0.059°C/decade (Wang et al., 2022). These results mean that the frequency and intensity of MHWs were gradually strengthened and their of MCSs were clearly weakened due to ocean warming.
Annual mean sea surface temperature (SST) has increased about 1.35°C, which is about 2.5 times higher than global mean trend, during past 54 years. Especially, the highest level of MHWs over the whole global waters appeared in the East Sea during July 2021 (NIFS, 2022). Kang (2000) explained that the winter SST are increasing while the summer SST have a decreasing tendency using Korea coastal SST data from 1936 to 1995. Kim et al. (2011) reported that the ocean surface warming around the Korean Peninsula is larger during winter than summer using 130 years observation based data. Min & Kim (2006) described that the decreasing trend of annual SST amplitude along the Korea coastal areas was mainly due to the increasing tendency of SST in winter. Seong et al. (2010) also presented that the increasing trend was clearly larger about 2 times in winter than in summer. They also remarked that the long-term increasing trend of SST in the Korea Waters is usually caused by the distinctive increasing trend in winter. As the previous many studies, the long-term change of SST in the Korea water has been well known that the winter SST is dominant. However, Han & Lee (2020) reported that there was a distinctive SST increasing trend appeared in summer, whereas a clear decreasing trend in winter during past 10 years.
As the IPCC Special Report on the Ocean and Cryosphere in a Changing Climate (SROCC), the East China Sea and Yellow Sea were described as the frequent MHWs occurrence areas in the global ocean since 2016. Kim & Han (2017) also explained that the MHWs around the Korea Waters since 2016 killed a large number of different marine organisms in coastal and bay areas, especially aquafarms. Lee et al. (2022) showed that massive damage occurs every years due to frequent anomalous high water temperature in coastal and inland bays along the Korea coastal area and the occurrence of high water temperature in major bays of Yellow Sea and Northern East China Sea was confirmed to derive mainly from heat inflow through the sea surface from the air in summer. Lee et al. (2022) also explained that it is needed the aquaculture management plans for prevent fisheries damage to reduce the mass mortality in aquafarm by MHWs during summer. On the other hands, Han et al. (2019) reported that low water temperature were significantly detected around the western and southern coast of Korea in 2010s during winter and these MCSs were related with Arctic oscillation and Arctic warming. The mass mortality in fish net-cage aquafarms around the western and southern coast of Korea were frequently occurred by distinctive MCSs in recent. In the past 11 years from 2010 to 2020, the amount of economic damage caused by natural disasters in Korea was about 236.3 billion KRW. Among them, the mass mortality by MHWs and MCSs were respectively occupied about 53% and 11%. That is, extreme and abrupt change of SST is main reason of economic loss in aquafarms along Korea coastal areas (NIFS, 2022).
As the previous researches, the variation tendency of SST in the Korea Waters was significantly changed and the extreme ocean and fisheries conditions were frequently occurred in recent around the Korea Peninsula. In this study, we examine the long-term pattern changes of SST during summer and winter and consider the those reasons, which should be related to the recently frequent occurrences of MHWs and MCSs, using long-term ocean and atmosphere data set in the Korea Waters.
Materials and Methods
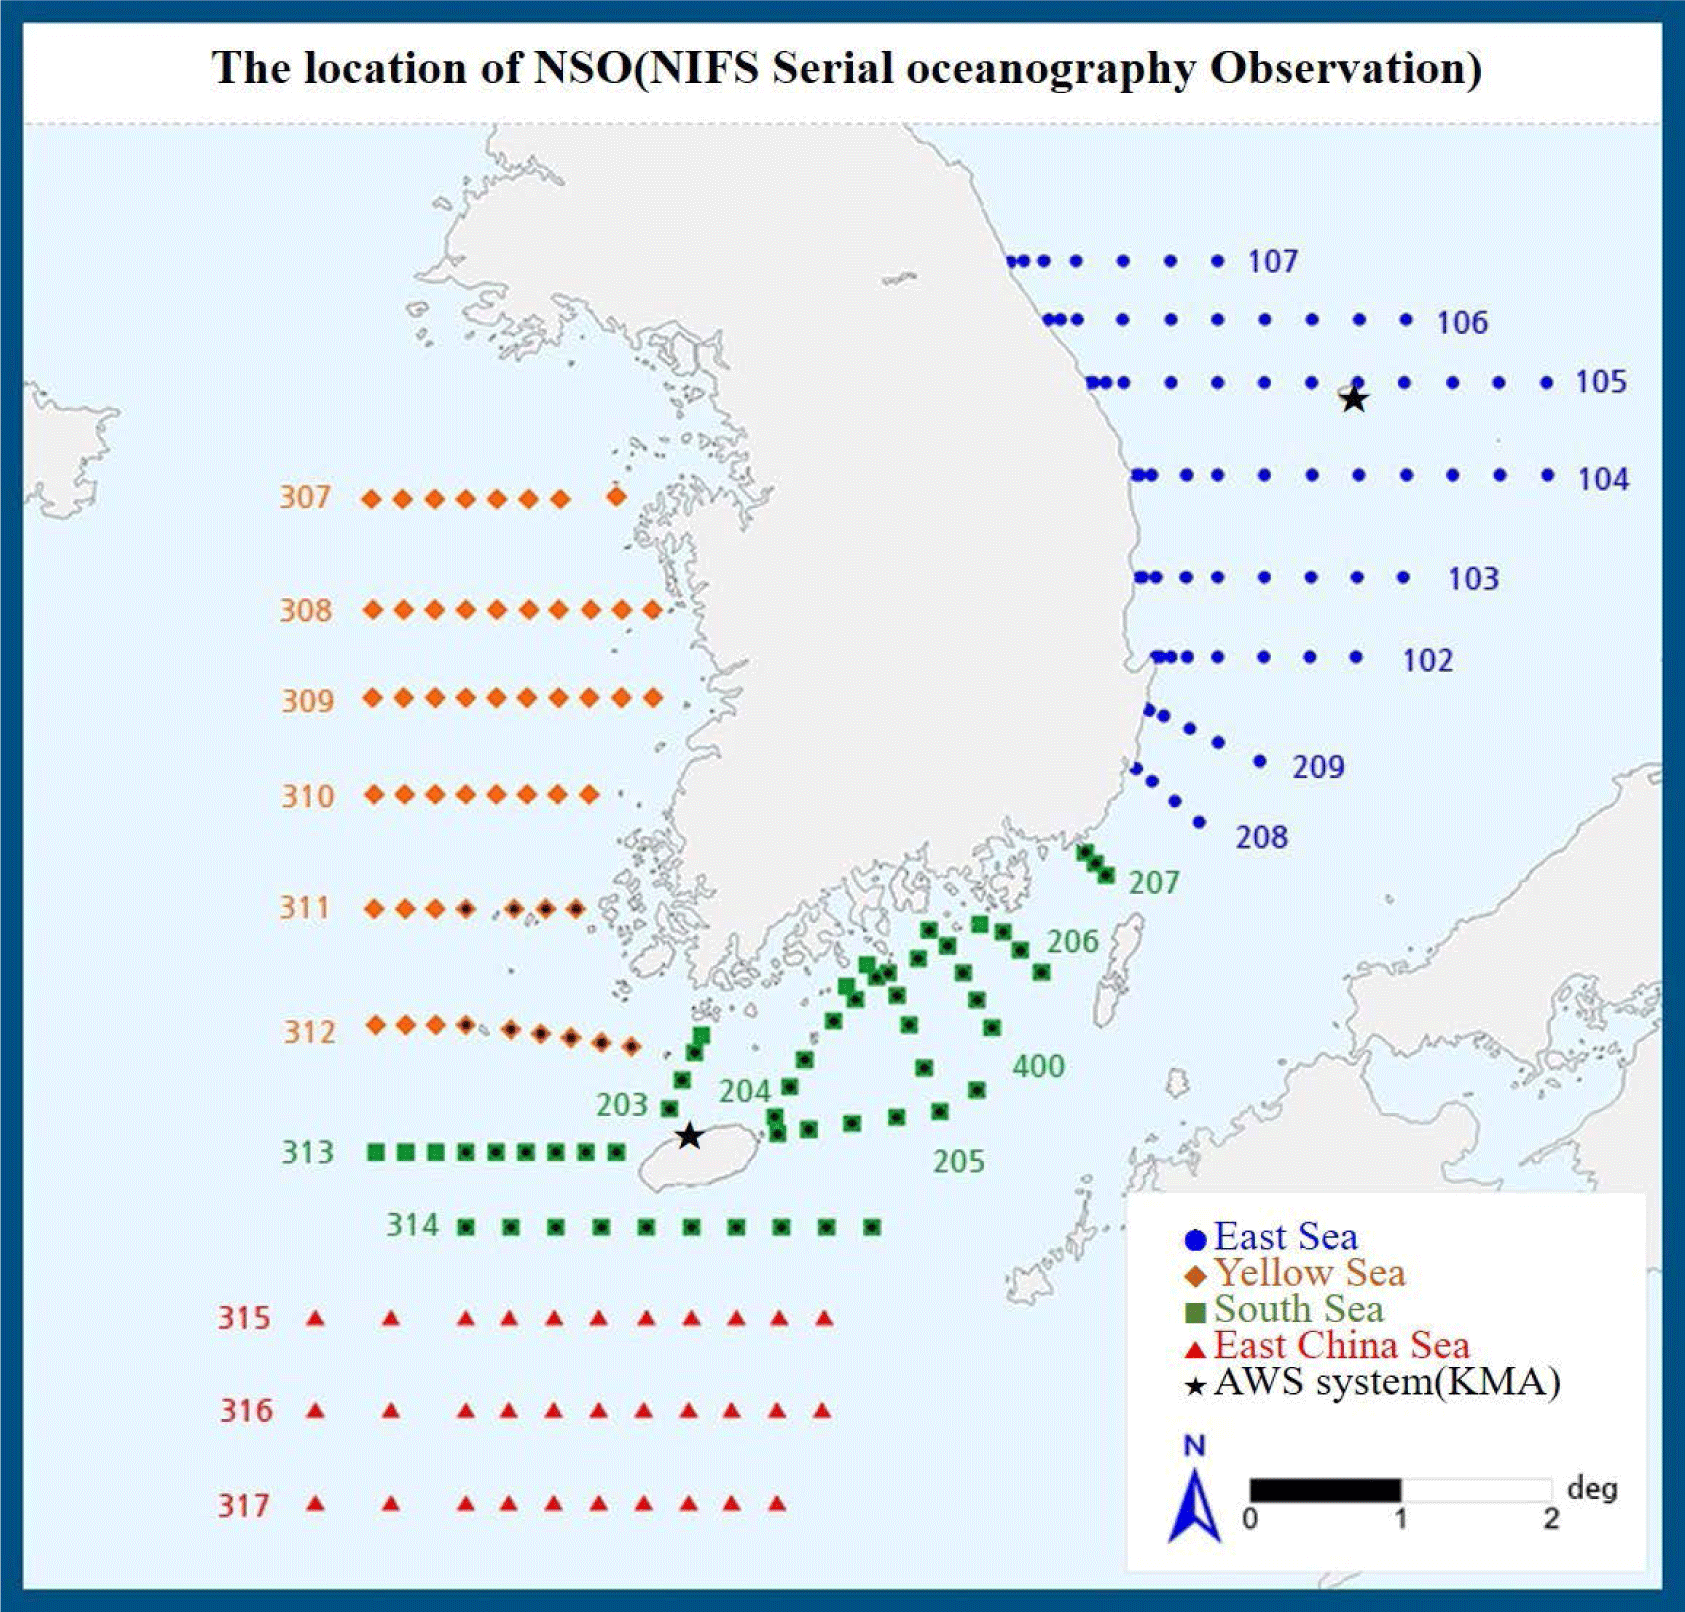
To examine the long-term annual and seasonal trends and changes of SST in the Korea Waters, we used SST data obtained from National Institute of Fisheries Science (NIFS) serial oceanographic observations (NSO), which were served from Korea Oceanographic Data Center (KODC), from 1968 to 2022. The NSO has been continuously carried out with 25 serial lines and 207 stations since 1968 without no-data and measured temperature, salinity, dissolved oxygen, nutrients, biomass and species compositions of phyto- and zoo-plankton with bi-monthly from surface to bottom (Fig. 1). We also used the annual mean ocean heat content (OHC) data for the examination of ocean warming in the Korea Waters. These data, which called as long-term Climate Data Record (CDR), are calculated using in situ temperature data from 1955 to present by National Centers for Environmental Information (NCEI) in National Oceanic and Atmospheric Administration (NOAA). These gridded data were spatially averaged as the Korea Waters (31˚N–43˚N, 122˚E–134˚E), East Sea (35˚N–39˚N, 127˚E–132˚E),Yellow Sea (34˚N–38˚N, 123˚E–127˚E) and Northern East China Sea (31˚N–35˚N, 124˚E–129˚E), respectively.
Tsushima warm current (TWC) is well known as the important source of heat by advection in the Korea Waters, especially the East Sea. Actually, the Heat supply by current is an important source, being about 60%–70% of the solar radiation around the southwestern part of the East Sea (Han & Kang, 2003). Takikawa et al. (2005) reported that the volume transport of the TWC through the Korea Strait has strong seasonal variation with a minimum winter and two maxima from spring to autumn with double peaks. They also showed that the autumn peak of the western channel in the Korea Strait is more pronounced than the spring peak. Shin et al. (2022) explained that the results obtained by two volume transport measures of the TWC with Acoustic Doppler Current Profiler (ADCP) and sea level data from tide gauges were very similar. The annual mean transport in the total Korea Strait and the western channel of the Korea Strait by the Direct measure from ADCP were about 2.64 ± 0.41 Sv (Sv = 106 m3/s) and 1.53 ± 0.36 Sv during past 17 years (1997–2013), respectively. Those by the indirect method estimated from sea level data were about 2.57 ± 0.37 Sv and 1.51 ± 0.32 Sv during past 44 years (1975–2018). Compared to the results of direct and indirect method for the volume transport measures of TWC, we can find out that the estimated volume transport by sea level change was very similar to the direct measurements by ADCP. To examine the relation with the long-term variation of SST in the Korea Waters, therefore, we used the monthly mean volume transport of the TWC through the Korea Strait estimated from the tide gauge data for 1975–2018 by Shin et al. (2022).
To consider the global and mesoscale climate impacts during winter around the Korea peninsula, we examined two long-term climate factors with the Siberian High (SH) and the East Asian Winter Monsoon (EAWM). These two climate factors were used to described the impacts of oceanic and atmospheric conditions in the Korea Waters during winter. The SH data were provided with the monthly northern hemisphere sea level pressure grids data with the region of 40˚N–60˚N, 70˚E–120˚E from University Corporation of Atmospheric Research (UCAR) (Gong & Ho, 2002; Jung et al., 2017). The EAWM data were also provided with National Centers for Environmental Prediction (NCEP)/National Center for Atmospheric Research (NCAR) reanalysis monthly mean data with the zonal wind speed at 300 hPa form NOAA (Jhun & Lee, 2004; Jung et al., 2017). We used these data since 1968 to compare with the SST variation in the Korea Waters.
Finally, we also used two Automatic Weather Station (AWS) data by Korea Meteorological Administration (KMA). To examine the winter climate impact changes around the Korea Peninsula, the winter mean wind speed in the Ulleung-do and Jeju-do, where are estimated to the weak effect of urbanization, since 1968 were used during winter from December to February by the Open MET Data Portal of KMA (Fig. 1). We also examine the two extreme weather data, heatwave day are defined as the number of highest daily air temperature over 33°C with the averaged 62 weather stations in the Korea. On the other hands, the cold spell day are defined as the number of minimum morning (3–9 AM) air temperature below –12°C with the averaged 62 weather stations in the Korea.
Results
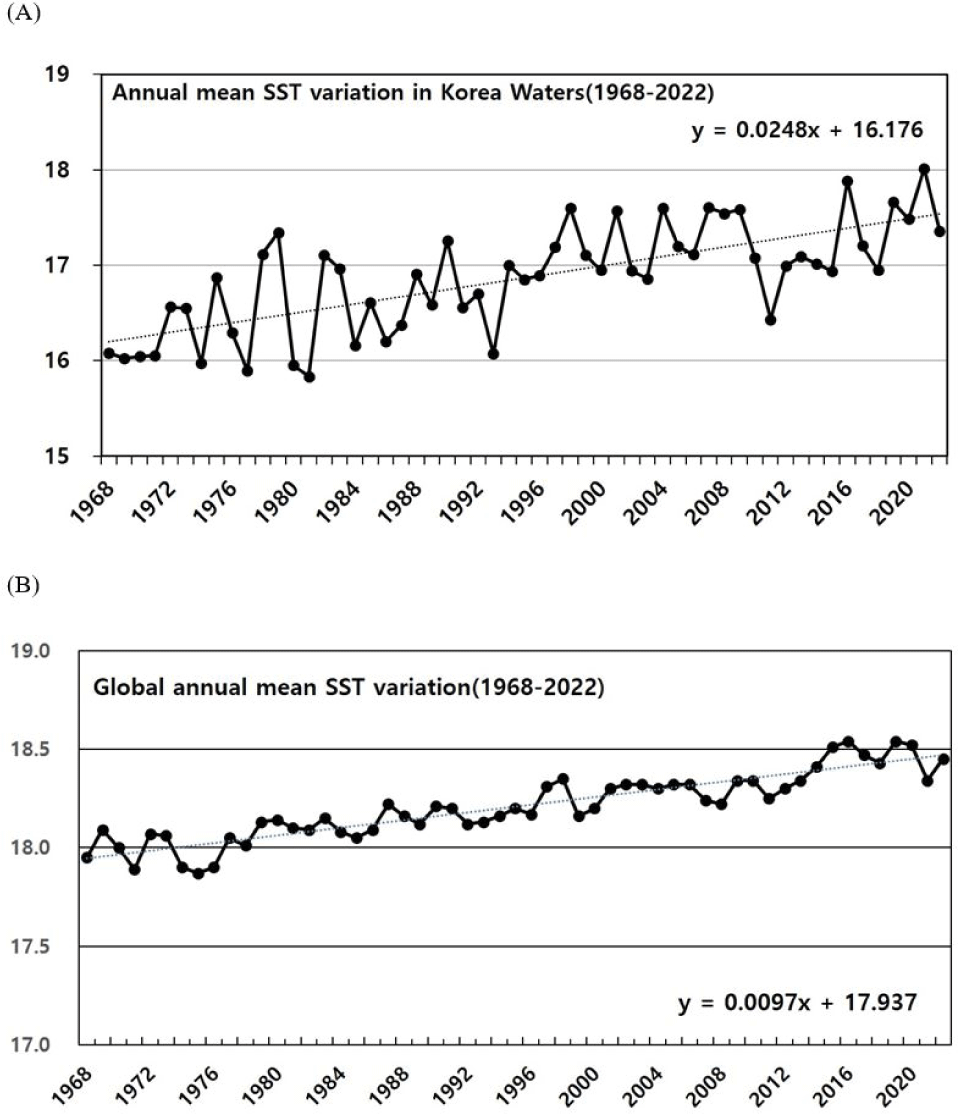
Using the long-term NSO data, we examine the long-term variation of SST in the Korea Waters. During past 55 years, annual mean SST increased about 1.36°C from 1968 to 2022. The long-term trend of global SST was examined using Centennial in situ Observation-Based Estimates of the variability of sea surface temperature and marine meteorological variables (COBE-SST) data set, which was improved the data of SST grid at 1˚ over 100 years since 1891 by conducting objective analysis by quality control of marine weather observing data including SST from the vessels, obtained from Japan Meteorological Agency (JMA) (Han & Lee, 2020). During the same period, the global annual mean SST increased about 0.53°C from 1968 to 2022. It shows that the long-term trends of annual mean SST in the Korea Waster was higher about 2.6 times than in the global mean (Fig. 2).
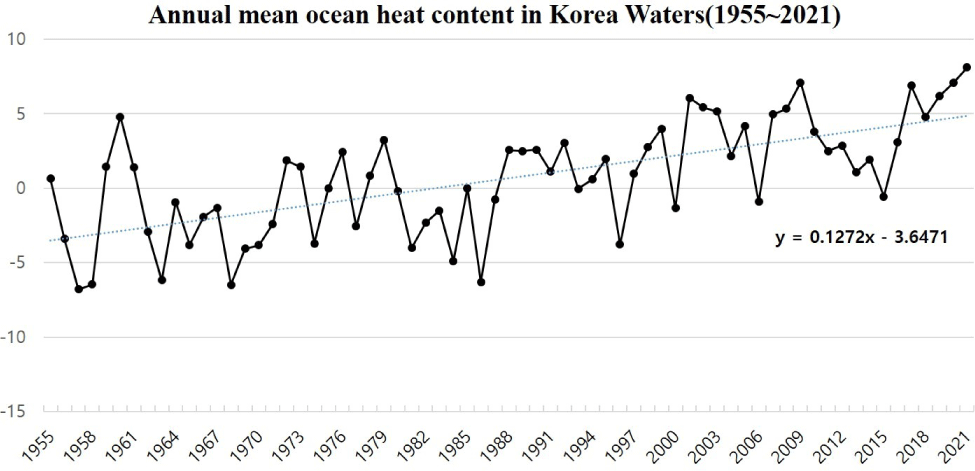
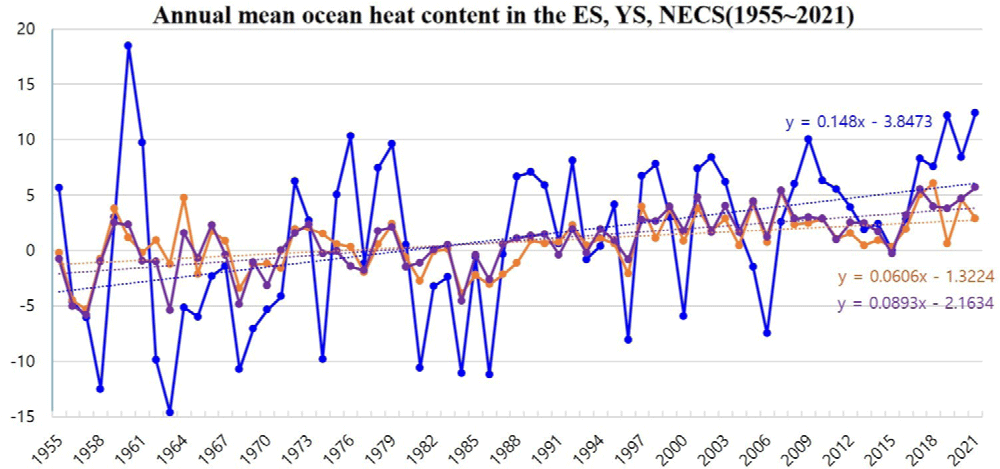
To understand the trend of ocean warming, we examine the long-term OHC by CDR by NCEI/NOAA in the Korea Waters and each areas of Korea Waters since 1955. During the past 67 years from 1955 to 2021, the annual OHC in the Korea Waters were clearly increased about 8.51018 Joules, which means the increasing trend of OHC was about 0.127 × 10¹⁸ Joules/yr. Especially, the OHC in the Korea Waters was significantly increased since 2015, which means the increasing trend of OHC was about 1.188 × 10¹⁸ Joules/yr from 2015 to 2021. Despite of the very short period about just 7 years, the increasing trend of ocean warming in the Korea Water was higher about 9.3 times during past 7 years than during past 67 years (Fig. 3). Fig. 4 shows the annual mean OHC in the East Sea, Yellow Sea and Northern East China Sea from 1955 to 2021. From this time series, we can find out the increasing trend of OHC in the Korea Water was dominant in the East Sea (0.148 × 10¹⁸ Joules/yr) compared to the Yellow Sea (0.0606 × 10¹⁸ Joules/yr) and Northern East China Sea (0.0893 × 10¹⁸ Joules/yr). The recent OHCs in the each ocean areas during past 7 years (2015–2021) were about 1.8694 × 10¹⁸ Joules/yr in the East Sea, 0.3086 × 10¹⁸ Joules/yr in the Yellow Sea and 0.6803 × 10¹⁸ Joules/yr in the Northern East China Sea, respectively. The distinctive increasing trends of OHC in the Korea Waters during past 7 years is caused by the significant increasing of OHC in the East Sea (Fig. 4). These results were shown that the Korea Waters has been gradually warmed and the ocean warming in the Korea Water was dramatically increased in recent. In addition, the strong ocean warming in recent was usually caused by the sharply increased trend of OHC in the East Sea.
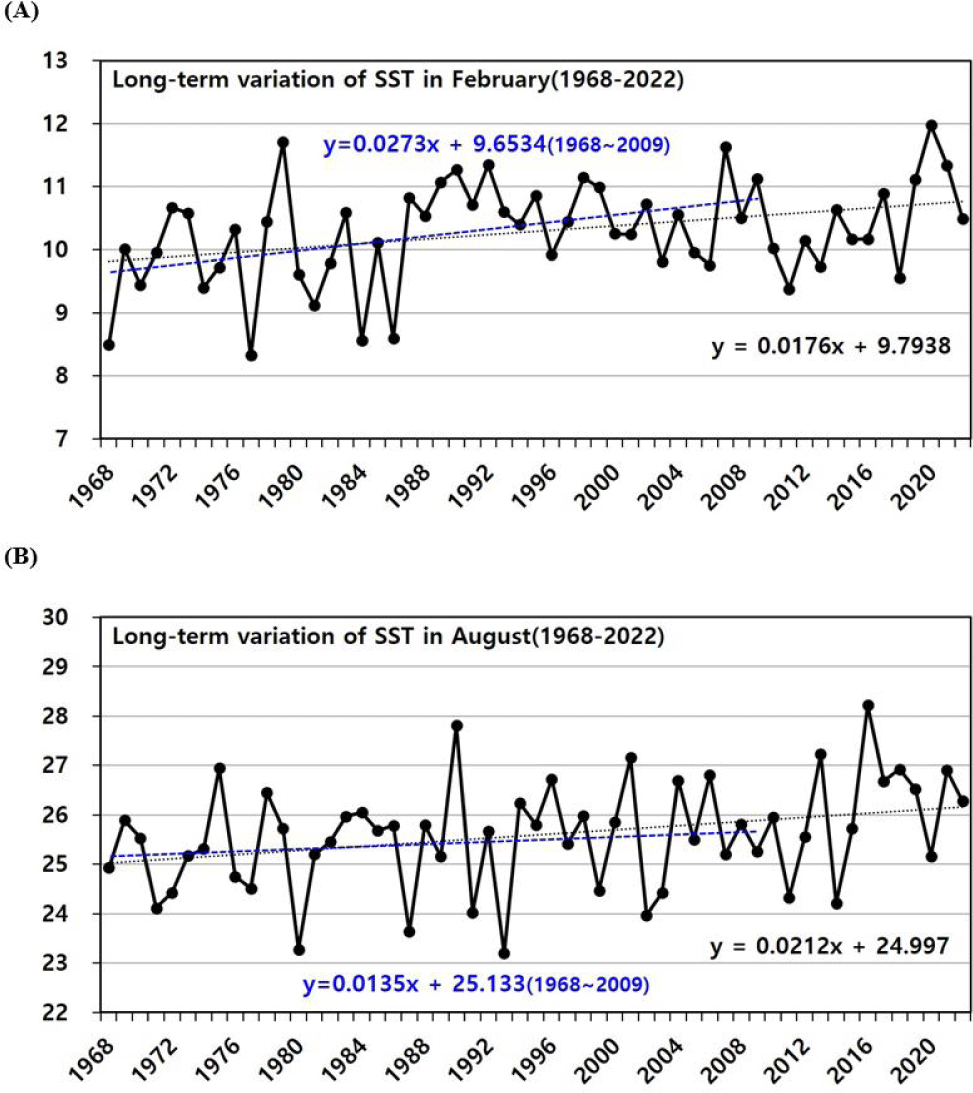
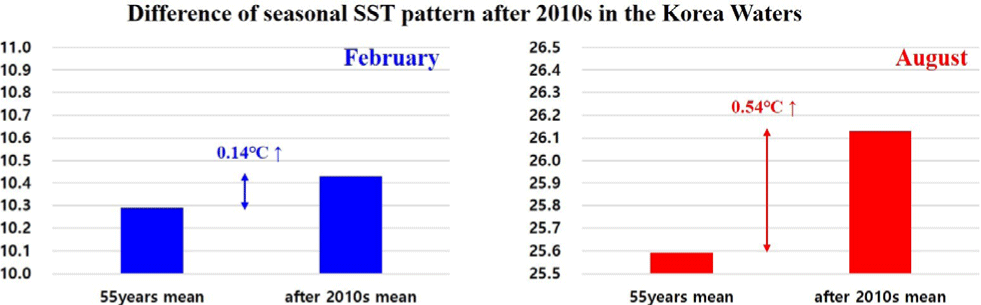
As the previous many studies, the long-term trend of SST in the Korea Waters was dominant in winter and was not significant change in summer before 2010s. Before 2010s from 1968 to 2009, actually, the winter and summer SST were respectively increased about 1.15°C and 0.57°C during 42 years. In this period, the long-term trend of winter SST was higher about 2 times than summer SST. On the other hands, during past 55 years including after 2010s data, the long-term trend of summer SST was overtaken the winter SST. The increasing trends of winter and summer SST were respectively 0.0175°C/yr and 0.0212°C/yr from 1968 to 2022 (Fig. 5). Actually, the mean SST after 2010s was increased about 0.14°C compared to 55 years mean SST in February. On the other hands, the mean SST after 2010s was significantly increased about 0.54°C compared to 55 years mean SST in August. After 2010s, the increasing trend of summer SST was higher about 3.9 time than the winter SST in the Korea Waters (Fig. 6). It means that the distinctive reasons for the seasonal SST pattern change were occurred around the Korea Waters in a few decade.
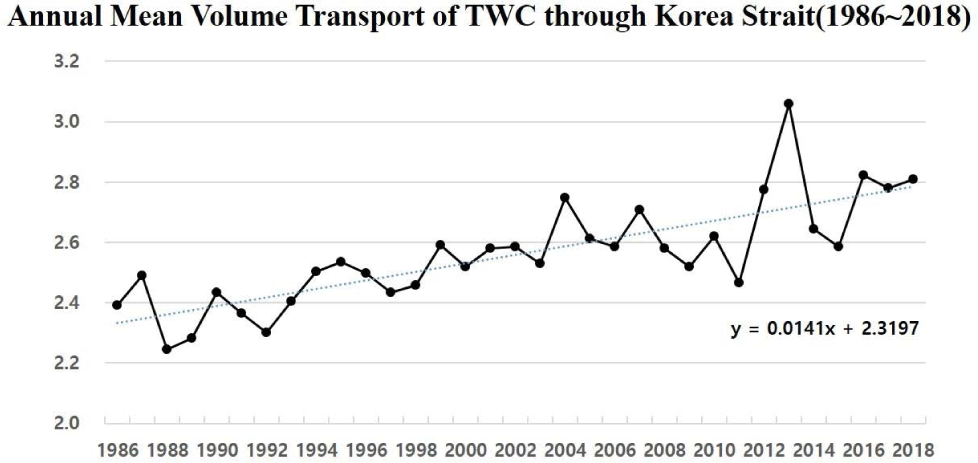
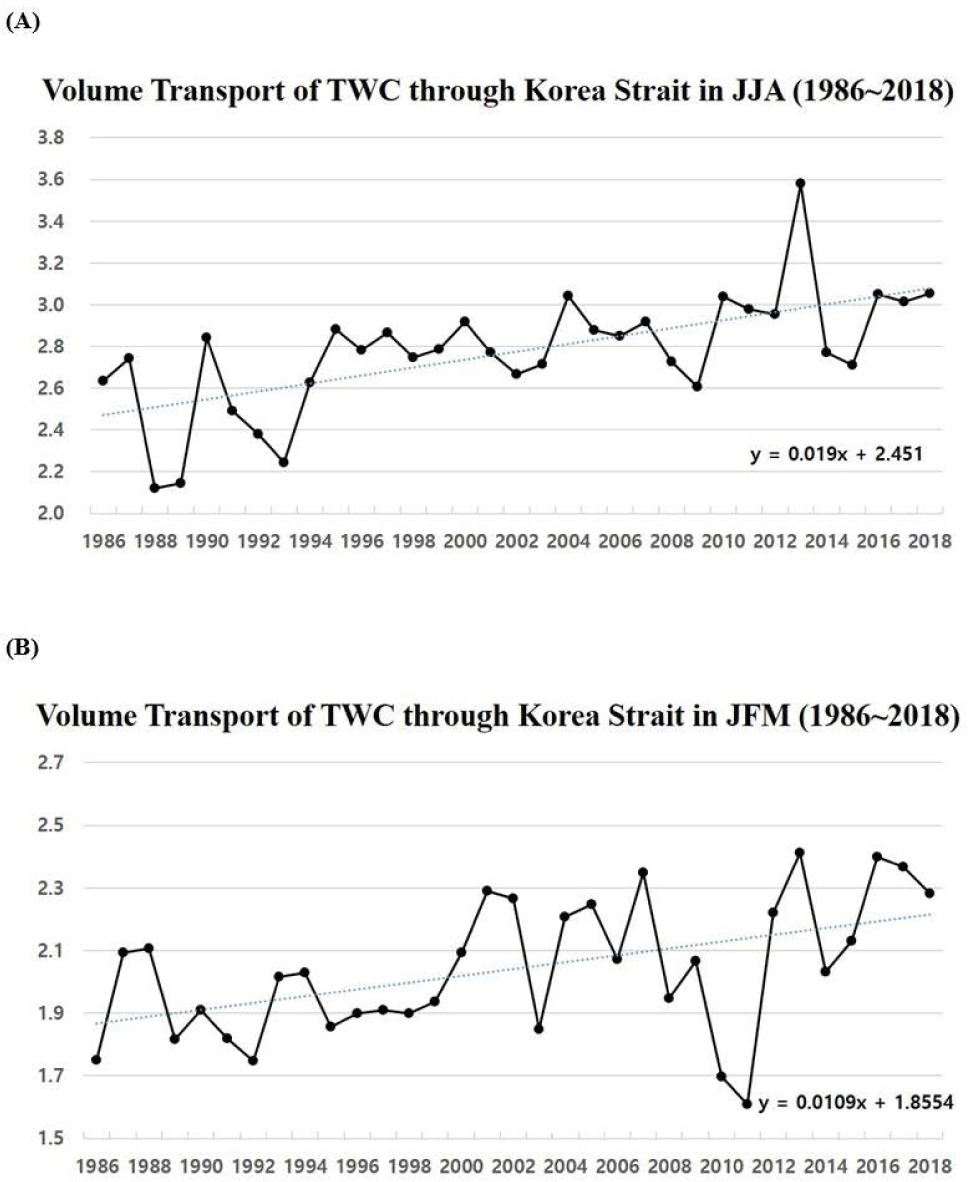
To find out the reasons of SST seasonal patterns in the Korea Waters, we examine the long-term change of TWC volume transport through Korea Strait from 1986 to 2018. The estimated volume transport of TWC through Korea Strait by sea level change was gradually increased about 0.014 Sv/yr during past 33 years (Fig. 7). To understand the seasonal difference of TWC volume transport, we compared to the long-term change of TWC volume transport in summer and winter during past 33 years (Fig. 8). The TWC volume transports in summer (June–August) and winter (January–March) were respectively increased about 0.63 Sv and 0.34 Sv during past 33 years. It means that the increasing trend of TWC volume transport through Korea Strait was dominant in summer, though the winter volume transport of TWC was slightly increased. In addition, this distinctive increasing trend of TWC summer volume transport through Korea Strait should be increased the heat transport by advection in the Korea Strait.
As we know well, the Artic sea ice extents and areas have been clearly shown the negative yearly trend (Cavalieri & Parkinson, 2012). It should be caused by global warming. IPCC (2019) reported that Arctic sea ice extent has decreased for all months of the year, especially sea ice reductions are about 12.8 ± 2.3%/decade between 1979 and 2018. Recent observational studies suggest that terrestrial snow cover may be affected by decreasing sea ice. Actually, Ghatak et al. (2012) suggested that the relationship between Arctic sea ice loss and Siberian snow cover during past 3 decades have a significant connection, which had an inverse correlation. Petoukhov & Semenov (2010) also explained an relationship between reduced Arctic, where was especially the Barents-Kara Seas, sea ice and cold winter extreme over northern East Asia. Sato et al. (2022) showed that the transport of atmospheric moisture from Arctic ocean evaporation to Siberia has increased significantly in autumn to early winter during 1981–2019. The air mass transformation and the propagation of the SH as well as its relations to the development of cold surges in the East Asia (Yihui, 1990). Generally, monsoon is used to described seasonal reversals of wind direction, caused by temperature difference between the land and ocean. The change of SH, which was major climate factor in the Eurasia and East Asia during winter, may be influenced to the EAWM.
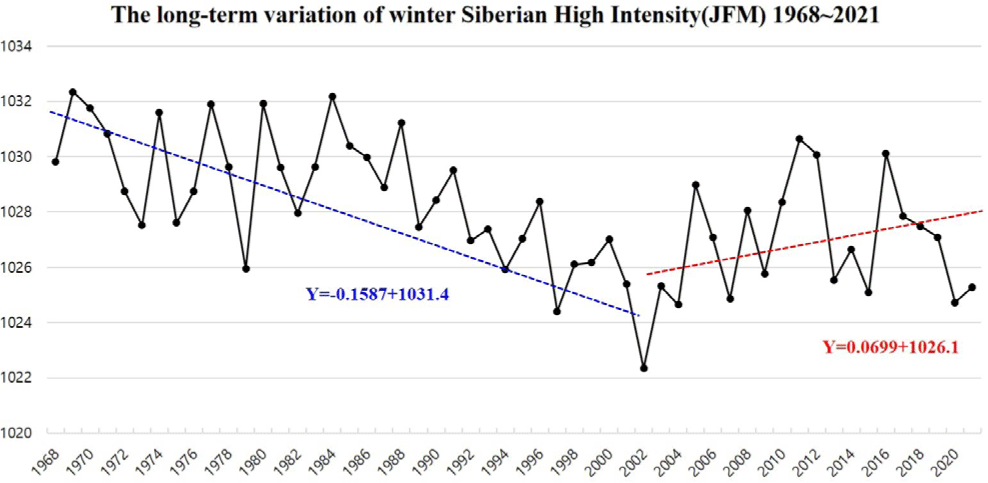
Panagiotopoulos et al. (2005) reported that the intensity of wintertime SH index had been shown the dramatic negative trend with –2.5 hPa/decade between 1978 and 2001. However, the significant change of Arctic sea ice loss in recent should be related to the SH and EAWM. Therefore, we examine the long-term change of SH and EAWM to understand the reason for seasonal pattern change of SST in the Korea Waters.
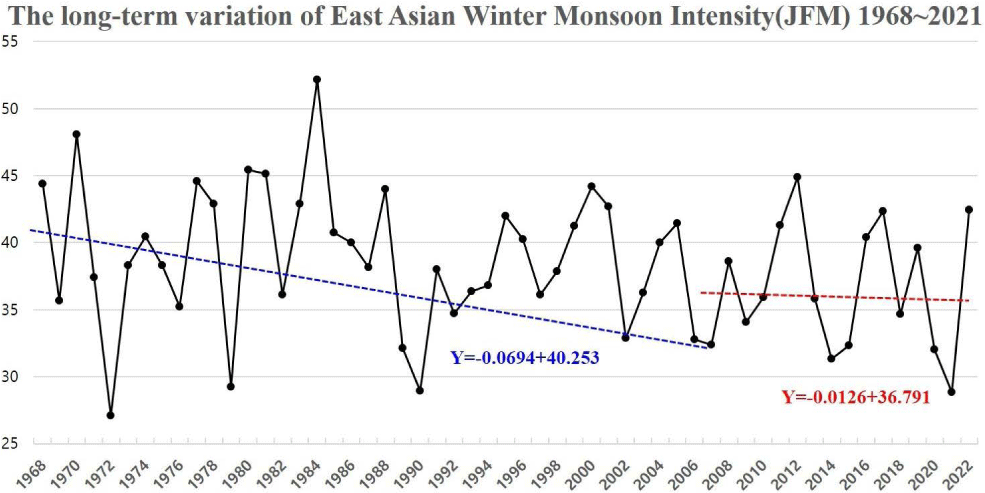
The long-term change of SH intensity during past 54 years from 1968 to 2021was shown in Fig. 9. We can found out the distinctive long-term change of SH intensity between before and after early-/mid-2010s. The intensity of SH was clearly decreased about –0.159 hPa/yr before 2002 and was reversely changed to the increasing trend about 0.070 hPa/yr after 2002. It means that SH was strengthened by dramatic reduced Arctic sea ice and another reasons from early- and mid-2010s. These significant shift of SH intensity should be influenced to the long-term change of EAWM. The intensity of EAWM was also clearly changed between before and after late-2010s (Fig. 10). The intensity of EAWM was gradually decreased about –0.069 m/s/yr before 2009. However, the decreasing trend of EAWM intensity was changed about –0.013/m/s/yr after 2008, though the intensity of EAWM was maintained the decreasing trend. As the difference of the decreasing trend, the intensity of EAWM was weakened about 5.5 time after 2008 compared to before 2008.
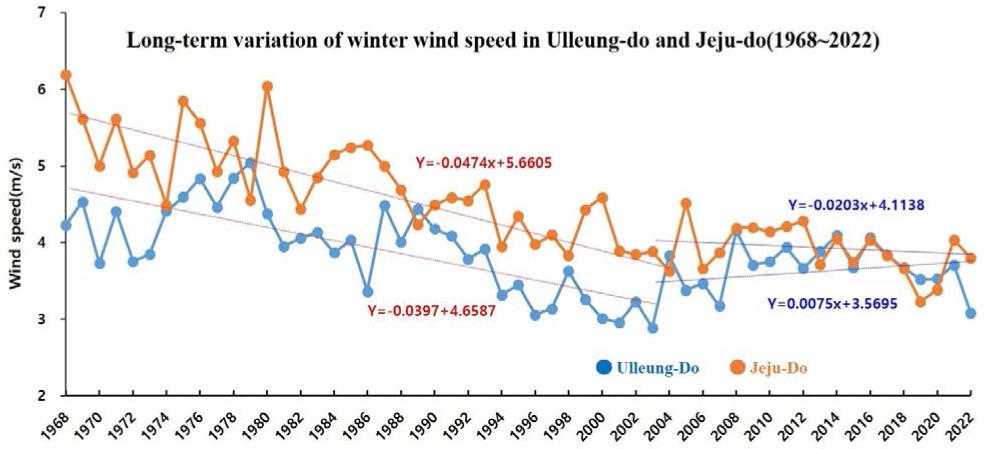
The global and meso-scale change of climate conditions around the high latitude of north hemisphere should be influenced to the long-term weather condition around the Korea Peninsula. To examine the impacts by the long-term change of SH and EAWM, the long-term changes of winter (December–February) wind speed in Ulleung-do and Jeju-do were shown in Fig. 11. As shown in Fig. 1, these two meteorological stations are located far from the Korea Peninsula and are limited from urbanization. We can find the winter wind speed in Ulleung-do was shown the significant decreasing trend about the –0.04 m/s/yr before 2003 and also shown the increasing trend about 0.08 m/s/yr after 2003. In case of Jeju-do, we also found out that the changes of decreasing trend for the winter wind speed were about –0.05 m/s/yr and –0.02 m/s/yr before and after 2003, respectively. These results means that the distinctive change of the long-term pattern for the winter wind speed was appeared since mid-2000s. We can also understand the long-term change of winter wind speed should be influenced to the vertical mixing related to SST changes on the surface layer in the Korea Waters and the cold weather around the Korea Peninsula.
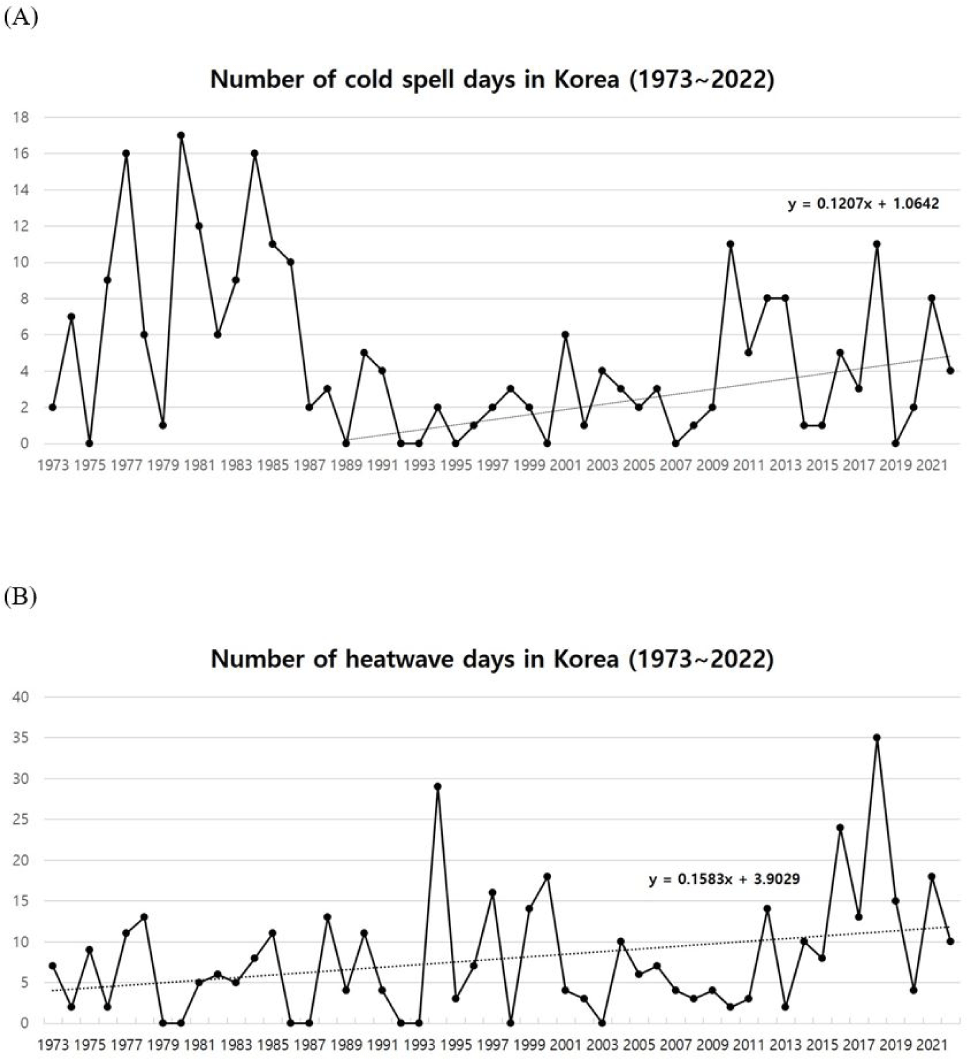
On the other hands, we also examined the occurrences of extreme weather during summer and winter around the Korea Peninsula. The long-term changes of the numbers of cold spell and heatwave days in Korea was shown in Fig. 12. The winter cold spells were not almost occurred from late-1980s to mid-2000s and were clearly increased since mid-2000s. The summer heatwaves were not significant before late-2000s and were clearly increased since late-2010s. It also means that the weather conditions in summer and winter were distinctively change since mid- or late-2000s.
Summary and Discussion
In this study, we examined the long-term change of ocean and climate conditions in the Korea Waters using the long-term oceanographic and atmospheric data. The long-term trends of annual mean SST in the Korea Waters was faster 2.5 times than global mean. Not only does the SST increasing trend, OHC in the Korea Waters also gradually increased. Especially, the increasing trend of OHC in the East Sea was significant in recent. Unlike many previous studies, the increasing trend of summer SST was higher than winter SST during past 55 years in the Korea Waters. After 2010s, the increasing trend of summer SST was higher about 3.9 times than winter SST in the Korea Water. At least, the summer SST is clearly dominant during a few decade compare to the winter SST in the Korea Waters. The increasing trend of the summer volume transport of TWC, which is very important heat source by advection in the Korea Waters, was distinctively higher about 1.9 times than the winter. The long-term trend of SH and EAWM, which are important climate factors in the East Asia, was shown the significant difference trends before and after early- and mid-2000s. The sharply decreasing trend of SH and EAWM were changed to increasing trend or slightly decreasing trend after early- and mid-2000s. From these change, winter wind speed around the Korea Peninsula was changed from the sharply decreasing trend to the increasing trend or slightly decreasing trend since mid-2000s. The number of cold spell days and heatwave days in the Korea clearly increased since mid- and late-2000s. As the above results, we can consider that the recent long-term pattern change of SST during summer and winter should be caused by the shift of climate factors, which are the re-strengthened SH and EAWM due to the Arctic warming and the occurrence of strong heatwave around the Korea, and the change of oceanic condition like advection heat variation since early- and mid-2000s.
In recent, we have experienced the frequent MHWs and MCSs in the Korea Waters. In addition, the MHWs and MCSs are more frequent and intensify in the Korea Waters (Han et al., 2019; Kim et al., 2021; Lee et al., 2020, 2022, 2023). IPCC reported that the MHWs in global ocean between 84%–90% that occurred between 2006–2015 are attributable to the anthropogenic temperature increase. It means that the relationship between the ocean warming and the occurrence of MHWs are very highly relevant. On the other hand, the global trends of MCSs are gradually decreased by the ocean warming. However, the occurrences of MCSs are inversely increased in some ocean areas. After 2010s, MHWs and MCSs were repeatedly appeared during summer and winter in the Korea Waters. These extreme ocean events should be closely related with the long-term pattern change of SST due to climate change in the Korea Waters.
The ocean conditions might be changed by the extreme events, periodic variation and long-term trends. In this study, we did not have enough longer data to understand the periodic and long-term variation of ocean and climate in the Korea Waters. Therefore, the tendency of the patterns and trends for the described ocean and climate conditions in this study may change. In the future, we have a plan to examine the change of SST and ocean warming pattern in the Korea Waters and their characteristics in more detail using the longer data.