Introduction
Thailand is the leading country to process and export tuna products to the world market. It is estimated that the tuna by-products are about 46,000 tons per year (Gamarro et al., 2013). Tuna viscera is one of the tuna by-products still containing useful compounds such as proteins and amino acids. Therefore, these by-products materials can be used as other forms of protein sources such as fish meal and protein concentrate. Tuna viscera have been reported as a source of essential amino acids in the human diet and feed (Chotikachinda et al., 2018; Derouiche Ben Maiz et al., 2019; Nugroho et al., 2019). The visceral processing of tuna into protein hydrolysate for the development of sauces or flavor enhancers is an alternative to adding value to tuna viscera which high contents of amino acid. Flavor enhancers are an important part of enhancing the palatability of food. The flavor enhancers could be produced from fish by-product with enzymatic hydrolysis (Li et al., 2021; Nguyen et al., 2011). Maillard reaction is the reaction resulting between the amino acids, peptides, and the reducing sugar such as xylose. Maillard reaction has been reported to improve the flavor characteristics of protein hydrolysates and masks the fishy aroma in the Maillard product (Derouiche Ben Maiz et al., 2019; Li et al., 2021; Zeng et al., 2012). As mentioned above, the method of enzyme hydrolysis of protein combined with Maillard reaction was an effective procedure to prepare flavor enhancer.
Solid phase microextraction (SPME) is used for measuring the flavor components. SPME is a simplified technique that has no need of solvent and distillation, as well as is robust and reproducible. Volatile components are identified and quantified with SPME-gas chromatography-mass spectrometry (GC-MS) analysis. The concentration of identified volatile components are further analyzed to estimate the sample aroma profile by using odor activity value (OAV), which refers to odor description of each volatile component. Creating aromagrams, named “odor impact spectrum” (OIS), from odor unit value (Uo) or OAV was introduced by Mookdasanit et al. (2003) and Tamura et al. (2001). OIS were the normalized OAV modified by an approximate Stevens’ law exponent (n = 0.5; Acree, 1997). OIS method offers a more simplified and faster technique compared with Charm analysis using gas chromatography-olfactory method.
To determine the effect of xylose, yeast extract (YE) and methionine on the aroma characteristic of the tuna viscera hydrolysate, the hydrolysates were produced by enzymatic hydrolysis and then the Maillard reaction was conducted. Volatile components and the potent odorants of the Maillard products were analyzed using GC-MS, OAV and OIS.
Materials and Methods
Examples of tuna viscera include the spleen, stomach, intestines, gallbladder, liver, and pancreas, which are a by-product of Global Pet Care Business Unit, Thai Union Manufacturing, Samut Sakhon. Samples were prepared by thawing frozen tuna visceral samples at 4°C for 24 h. Fresh tuna viscera were chopped into small pieces using a silent cutter. Sampling was performed for chemical composition analysis, including moisture, protein, lipid, and ash by Horwitz (2000). Amino acid contents and histamine contents were analyzed with high performance liquid chromatography (HPLC) (Latimer, 2019).
Optimal conditions for protein hydrolysate preparation were performed using Factorial (3×3) experimental planning for three factors: temperature (50°C, 55°C, 60°C), enzyme (0.5%, 1.0%, 1.5%) and time (4, 6, 8 hours). The samples and water were mixed with the ratio 1:0.5 (w/w). Add SVC 223B endo/exo protease enzyme prepared from Aspergillus oryzae (activity > 450,000 HUT u/g, Siam Victory Chemicals, Bangkok, Thailand) and hydrolyzed using a SHKE480HP/SHKE481HP incubator shaker, Thermo Scientific (Waltham, MA, USA) product, at 160 rpm, subjected to the experimental conditions, after which the reaction was stopped by heating at 98°C–100°C for 10 min, filtered and centrifuged (SUPREMA 21, Tommy Seiko, Tokyo, Japan) at 12,000×g at 4°C for 30 min. The supernatants were collected and the sample volumes equalized and stored at –20°C for further analysis. Degree of hydrolysis (%DH) was measured following Sonawane & Arya (2017) and calculated according to Equation (1) to determine optimal conditions for protein hydrolysate preparation. The tuna viscera protein hydrolysate (TVPH) sample under optimal digestion conditions was measured for the flavor components, amino acids, and histamine.
A sample (0.5 g) was hydrolyzed with 5 mL of 6 M HCl using an oil bath controlled at 110°C for 24 h. The hydrolyzed sample was diluted with Milli-Q water and then filtered through a 0.22-µm membrane filter (CA, United States). The amino acid contents of the filtrate sample were analyzed with HPLC (1200 infinity series, Agilent, Santa Clara, CA, USA) equipped with poroshell-120 HPH-C18 column (4.6 mm × 100 mm, 2.7 µm, Agilent) and quantified with o-phthaldialdehyde method. The HPLC analytical condition for amino acid analysis was modified from Latimer (2016).
The TVPH samples were flavored by Maillard reaction supplemented with xylose (Sigma Chemical, Bangkok, Thailand), methionine (Sigma Chemical) and YE (Jim’s Group, Bangkok, Thailand) as shown in Table 1. TVFE treatments were heated at 120°C for 60 min to catalyze the Maillard reaction (Savolainen et al., 2019). All TVFE treatments were analyzed for flavor components.
Volatile components were analyzed using Head Space-Solid Phase Micro-extraction gas chromatography/time-of-flight mass spectrometry (GC–TOFMS; LECO, St. Joseph, MI, USA) and the analytical condition of GC–TOFMS adapted from Pupan et al. (2018). The fiber was divinylbenzene/carboxen on polydimethylsiloxane (50/30 µm of thickness; SUPELCO, Bellefonte, PA, USA) for entrapping volatiles. The samples (2 g), salt (3 g), distilled water (8 g), and internal standard solution (2-methyl-3-heptanone) at a concentration of 10 ppm (10 µL) in a screw top vial with PTFE silicon septa were mixed with vortex mixer and then pre-incubated at 55°C for 15 min. The fiber was exposed to sample for 20 min at 55°C and then was desorbed for 5 min in GC injector. The volatiles were separated with the RTX-5 column (10 m in length, 0.18 mm in diameter, and 0.20 µm in film thickness). The temperature was set at 40°C as an initial temperature. The temperature increased to 200°C with a rate of 6°C/min, after that the final temperature went up to 240°C (10°C/min). The volatile compounds were ionized by time-of-flight mass spectrometer using energy at 70 eV, scanning range of 33–400 m/z and acquisition rate at 20 spectra/s.
Volatile compounds were identified by comparing the spectrum data and retention indices of each compound on the database (Adams, 2007; Raza et al., 2020; Wang et al., 2017). The concentration of volatiles was calculated by finding the area under the peak of each substance and compared with the area under the peak of the internal standard with known concentration and reported in ppm (Pupan et al., 2018).
OAV was calculated as volatile compound concentration divided by odor threshold (Equation [2]). This accurately reflects the potent aroma components to the overall aroma. Compounds showing an OAV ratio > 1 contributed to the odor, and their OAVs were corresponding to the odor contribution (Jiang et al., 2022).
OIS represent the flavor profile of the most common flavoring agents, calculated according to Tamura et al. (2001), by approximate Stevens’ law (Stevens, 1958). OIS is shown as follows in Equation (3).
where Uo equal to OAV; : perceived odor intensity of individual compound, : maximum value of .
Factorial experimental plan and statistical analysis was using analysis of variance and comparing mean difference by Duncan test method at 95% confidence level by the packaged program (IBM SPSS Statistics Standard version 27, IBM, Armonk, NY, USA). TVPH and TVFE volatile metabolomics data were normalized and evaluated with multivariate analysis following Settachaimongkon et al. (2014). Heat-map visualization combined with Pearson’s correlation, principal component analysis (PCA) was conducted using multivariate analysis in MetaboAnalyst 4.0 software (https://www.metaboanalyst.ca/).
Results and Discussion
The tuna viscera samples were analyzed for their proximate composition. The main component was moisture (74.65%) while the protein content was 19.12%. The high amount of protein content in this sample implied to be a suitable recourse to process the flavor enhancer with Maillard reaction. Protein hydrolysate has been confirmed as a good resource for flavor enhancers. In consideration of safety, an analysis of histamine content found that the skipjack tuna viscera contained 17.15 mg/Kg of histamine. Histamine contents are limited lower than 50 ppm in fishery raw material for human consumption (FDA, 2011); therefore, the tuna viscera were safely used as raw material for the further process.
Results of the study of optimum conditions for protein hydrolysate preparation from skipjack tuna viscera (Table 2) showed that the degree of hydrolysis (DH) increased significantly with increasing temperature (p < 0.05). The 0.5% enzyme content incubated at 60°C had a significantly higher %DH (47.8%) (p < 0.05) compared to samples incubated at 50°C and 55°C at 0.5% enzyme content. After increasing the enzyme content to 1% and 1.5%, it was found that the %DH of the sample incubated at 60°C was significantly higher. It could be concluded that incubation at 60°C was the optimum temperature.
a–f Different lowercase letters in the same column represent a significant difference (p < 0.05) of mean between treatments.
%DH tended to decrease with increasing digestion time (4–8 hours). The optimum condition for digestion was 0.5% enzyme concentration (w/w) at digestion time four hours, temperature 60°C, obtaining %DH equal to 47.80%. While in increasing the digestion time to six and eight hours, %DH decreased to 44.28% and 44.86%, respectively. The decrease in %DH observed with the long incubation period may be due to the restriction of enzyme activity by the enzyme-mediated substrate protein degradation until the peptide formed. The decrease in %DH may be caused from the reduced digestion rate due to lower substrate concentrations, enzyme inactivation and inactivation of enzymes (Guerard et al., 2002; Zheng et al., 2013).
Enzyme contents of 0.5%, 1.0% and 1.5% had a significant effect on the %DH of TVPH (p < 0.05), while optimum conditions for protein hydrolysate production significantly affected the quality of the tuna hydrolysate production (p < 0.05). Preparation of raw materials prior to decomposition must, therefore, make the shape of raw materials suitable for enzymatic degradation, with reaction temperature and reaction time all important. Therefore, the selection of the temperature conditions for each type of enzyme degradation should consider the rate of degradation and the stability of enzymes to temperature (Chotikachinda et al., 2018).
Based on the results, regarding cost and production time, the optimum condition for producing TVPH is 0.5% enzyme concentration (w/w) at a digestion time of four hours with temperature of 60°C, and %DH 47.80%. TVPH produced under the optimum condition contained histamine as 12.80 mg/kg which did not exceed the limitation (FDA, 2011).
The amino acid profile of skipjack tuna viscera, TVPH and YE are presented in Table 3. Cysteine and methionine were the main amino acid content in TVPH and YE and these two amino acids were crucial for meat flavor formation in Maillard reaction (Raza et al., 2020; Tomé, 2021). Glutamic acid and aspartic acid were the main amino acids found in both the offal of skipjack tuna and the YE and it is also an amino acid that gives taste. Supplementing with YE is an alternative flavor enhancer such as Asp and Glu which are clearly related to umami and meat flavor. As for the amino acids such as cysteine and methionine, they help to enhance the flavor formation. It has been reported that the Maillard reaction process using cysteine or methionine as precursors when heated will react with carbonyl compounds to form a flavoring agent in the sample (Gao et al., 2020).
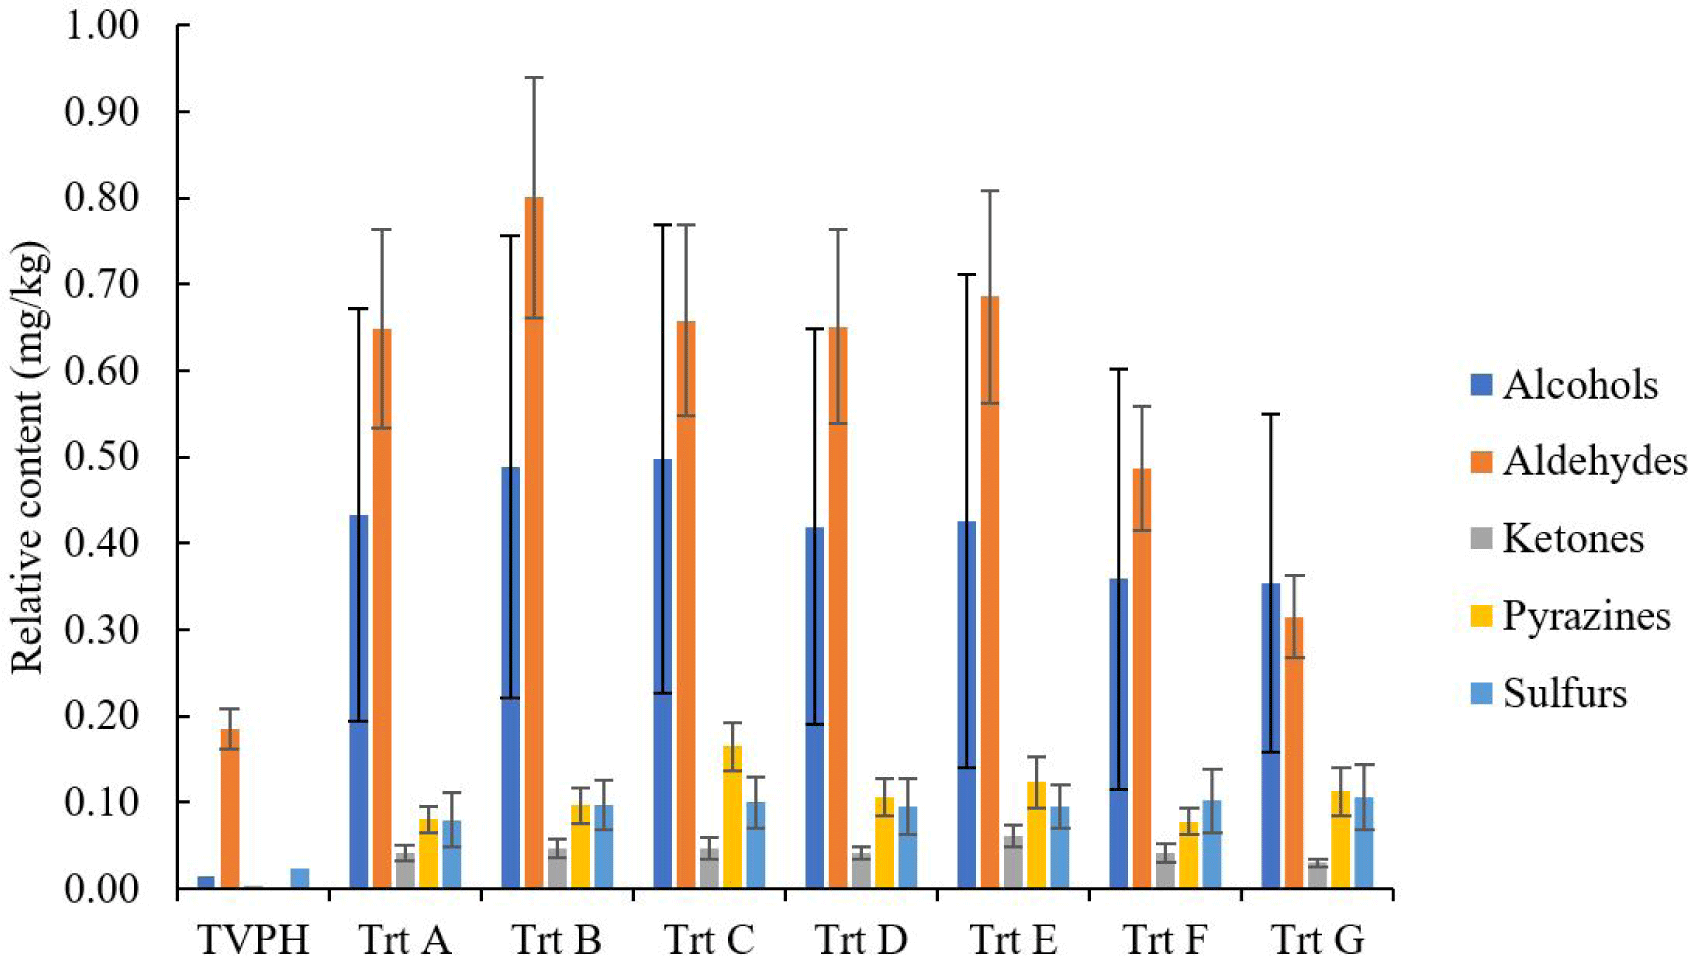
TVFE were TVPH heated under Maillard reaction to create new volatile components and increase some volatile compounds, which changed the flavor characteristics from the original sample. The chemical classes of volatile contents in TVPH and TVEF are shown in Fig. 1. The major volatile groups in TVPH and TVEF were aldehydes and alcohols. After Maillard reaction, aldehyde and alcohol volatile contents of TVEF (Trt A-Trt G) notably increased compared with TVPH. The next volatile class in TVPH is sulfur groups and it was found that this group also notably increased after heat treatment, especially in Trt C, D, E, F and F. Moreover, pyrazine groups were newly formed and notably found after Maillard reaction. The positively identified volatiles of TVPH and TVEF are listed in Table 4. Sixteen compounds such as 2-methylpropanal, methylpyrazine, 2,5-dimethylpyrazine, trimethylpyrazine, dimethyl disulfide and 2-acetylthaizone were created during the Maillard reaction process. Temperature causes thermal degradation of cysteine and carbonyl compounds to form volatiles containing sulfur and nitrogen classes in the Maillard products. The formation of pyrazine group compounds after heating was observed in the Maillard reaction. According to Tan & Yu (2012), pyrazine formation in the Maillard reaction is depended on temperature and reaction time. The pyrazine will not form until the reaction temperature reaches 120°C. This is consistent with these experimental results that pyrazine compounds were found when TVPH was heated at 120°C. Trt A without xylose added, while Trt B and Trt C were 1 and 2 g of xylose added, respectively. It was found that the addition of xylose significantly (p < 0.05) increased the quantity of methylpyrazine and 2,5-dimethylpyrazine in Trt B and Trt C higher than Trt A. Methylpyrazine was found in Trt A, Trt B, and Trt C as 0.007, 0.015, and 0.016 ppm respectively. Trt A, Trt B, and Trt C composed of 2,5-dimethylpyrazine contained 0.014, 0.054, and 0.061 ppm as 0.014, 0.054, and 0.061 ppm, respectively. The addition of xylose accelerated the pyrazine volatile formation via Maillard reaction in this study.

The TVFEs in this research were classified into three groups; first group (Trt B and C) were added only xylose, second group (Trt D and E) was fortified with xylose and YE and third group (Trt F and G) was mixed with xylose, YE and methionine. The sulfur and nitrogen containing volatiles in TVFE such as methylpyrazine, 2,5-dimethylpyrazine, methional, dimethyl disulfide, dimethyl trisulfide and 2-acetylthiazole were not significantly different (p > 0.05). Li & Liu (2022), Raza et al. (2020) and Tomé (2021) reported YE and methionine could enhance the formation of sulfur and nitrogen containing volatiles via Maillard reaction. The amounts of sulfur and nitrogen volatiles of Trt D, E, F, and G in this research were not significantly different (p > 0.05) from Trt B and C which may be the limitation of the Maillard reaction due to the excessive amount of amino acid and reducing sugar in Trt D, E, F, and G. The aldehyde volatile (2-methylpropanal) not detected in Trt G may occur from the carbonyl compound of this aldehyde reacting with amino acids or sugar products to transform other compounds during Maillard reaction (Gao et al., 2020).
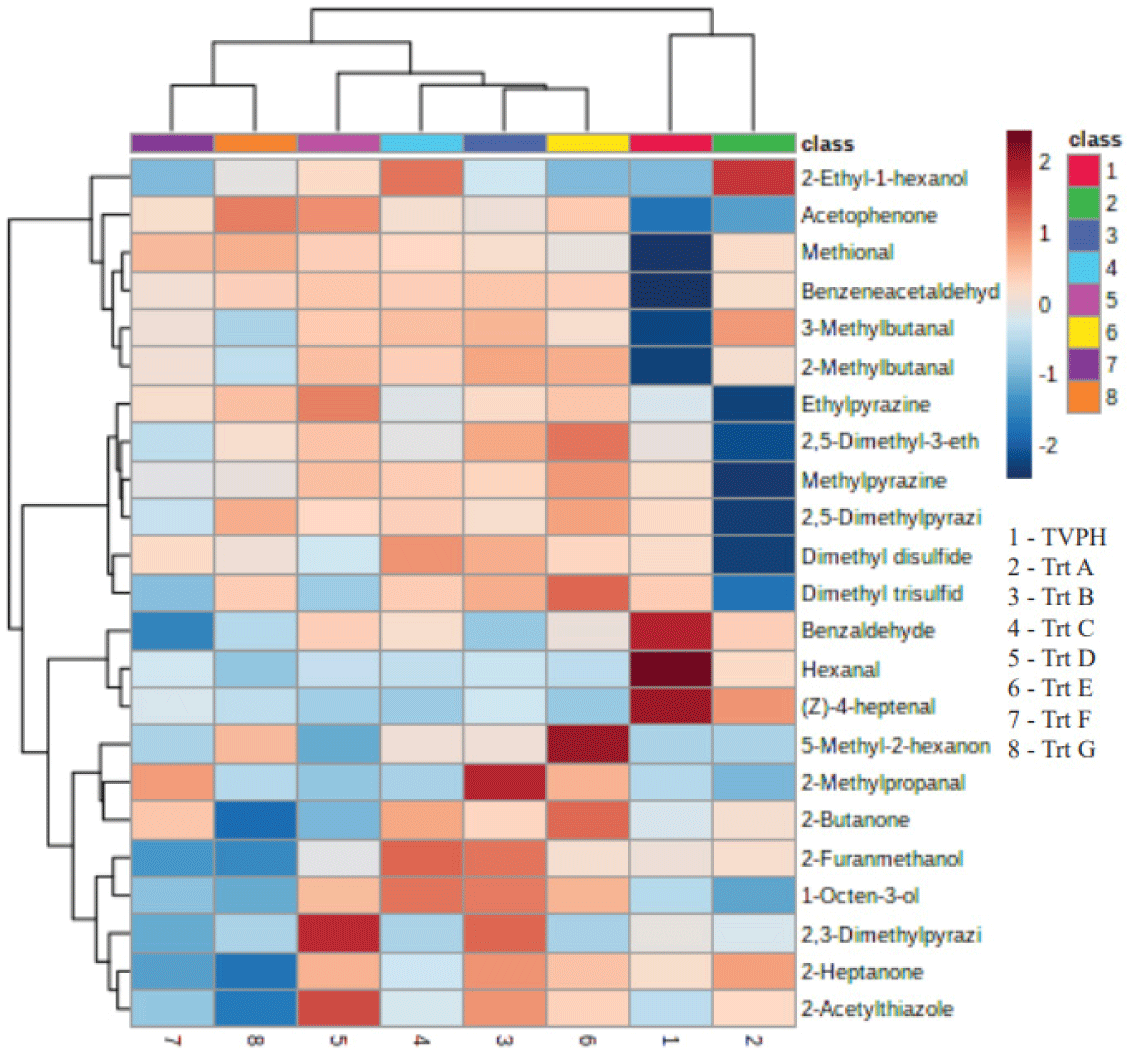
From the Pearson’s correlation integrated with heat-map visualization to assess the similarity of the protein hydrolysate metabolite profiles (Fig. 2), there were marked differences in the metabolite profiles among sulfurs, aldehydes, and alcohols. This observation may be relevant to the huge number of volatiles related to the analysis. The colors on the heat map relate to volatile amounts. The red color means a higher amount, and the blue color means a lower amount of volatiles among samples (Phuenpong et al., 2021). The quantity of compounds in the heat-treated TVFE in the Maillard reaction compared between Trt A (without supplements) and Trt B, C, D, E, F, and G (with supplements) showed that the sulfur and nitrogen containing compounds (dimethyl disulfide, dimethyl trisulfide, methylpyrazine and 2,5-dimethylpyrazine) in Trt A were less than those of Trt B to G. Aldehyde containing compounds increased notably when heated in Maillard reaction to form TVFE, such as 3-methylbutanal, 2-methylbutanal, and benzeneacetaldehyde. There was also a tendency to increase the formation of alcohol containing compounds (2-ethyl-1-hexanol and 1-octen-3-ol) after Maillard reaction.

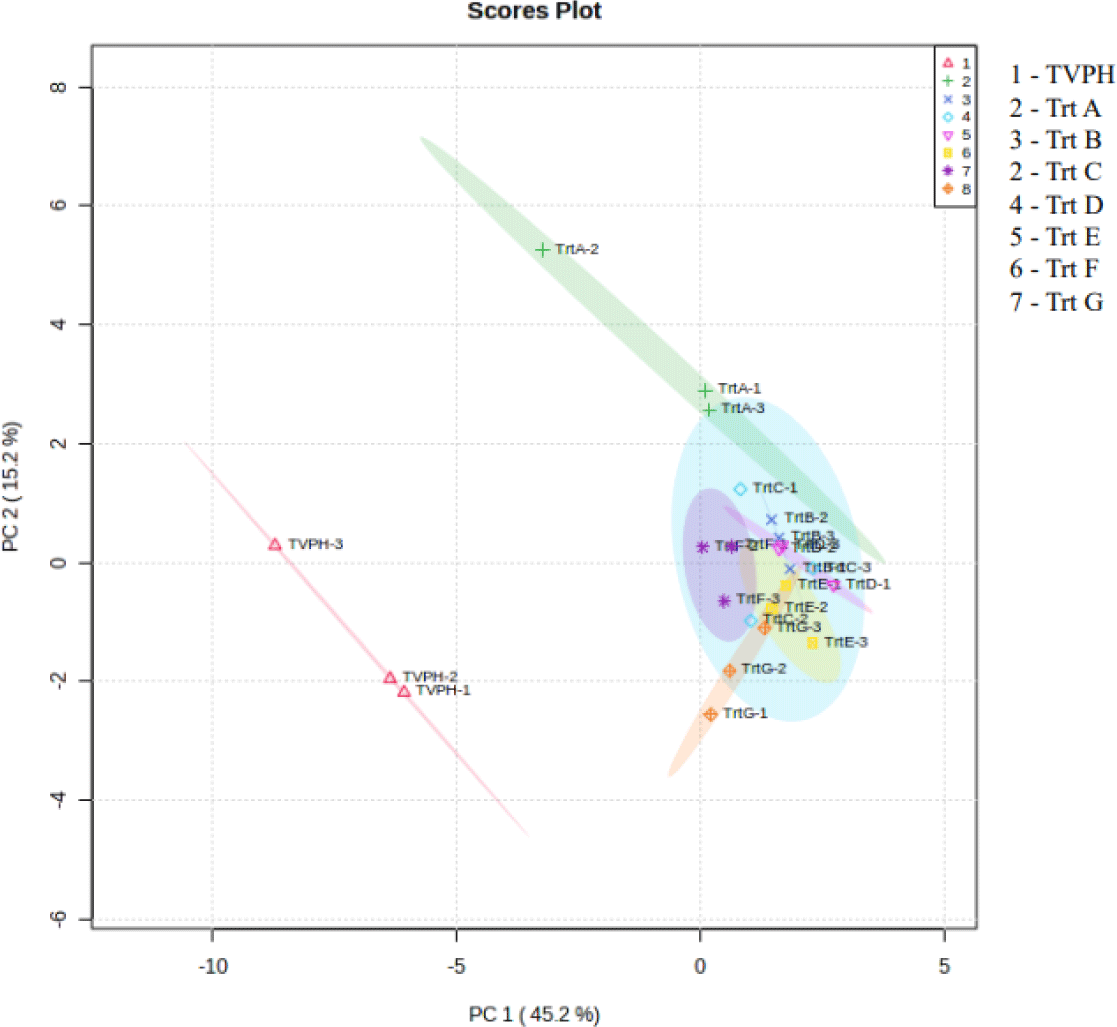
PCA was performed to classify the volatile profiles obtained from protein hydrolysates and shown in Fig. 3. From the interpretation of principal components (PC) in a quantitative manner, the overall PCA score plot was generated with a total variance of 60.4%. PCA showed clear separation of TVPH and Trt A (TVFE-without Maillard supplements), while Trt B, C, D, E, and G (TVFE-with Maillard supplement) samples overlapped along PC1 (45.2% variance).

To determine potent odorant in samples, OAV were applied to evaluate individual volatile components. The volatile has an OAV (Table 5) greater than 1, indicating that the volatiles contributed to its odor in the sample. From the odor threshold in Table 5, the concentrations of 1-Octen-3-ol and dimethyl trisulfide were very low (less than 0.1 ppb). Odor threshold of ٣-methylbutanal, (Z)-٤-heptanal, methional, dimethyl disulfide, and ٢-methylpropanal were proximately ٠.١–٠.٩ ppb, while ٢-methylbutanal, hexanal, benzeneacetaldehyde, and trimethylpyrazine had relatievely low thresholds between 1–3٠ ppb. These volatile compounds give the odor in tuna organ protein hydrolysates (TVPH and TVFE). Volatile compounds showing OAV > 1,000 such as 1-octen-3-ol, 3-methylbutanal and dimethyl trisulfide, contributed to meaty, chicken and chocolate-like aroma. Volatile components having OVA between 100–500 (methional, Z-4-heptenal and 2-methylbutanal) gave nutty and creamy aroma. Compounds containing OAV < 100 (2-methylpropanal, dimethyl disulfide and hexanal) gave fatty, onion, toasted aroma.
1) Data from Buttery (1981).
2) Data from Triqui & Reineccius (1995).
3) Data from Buttery et al. (1997).
4) Data from O’Neil (2013).
5) Data from Buttery et al. (1987).
6) Data from Masanetz et al. (1998).
7) Data from Schnabel et al. (1988).
8) Data from Buttery et al. (1969).
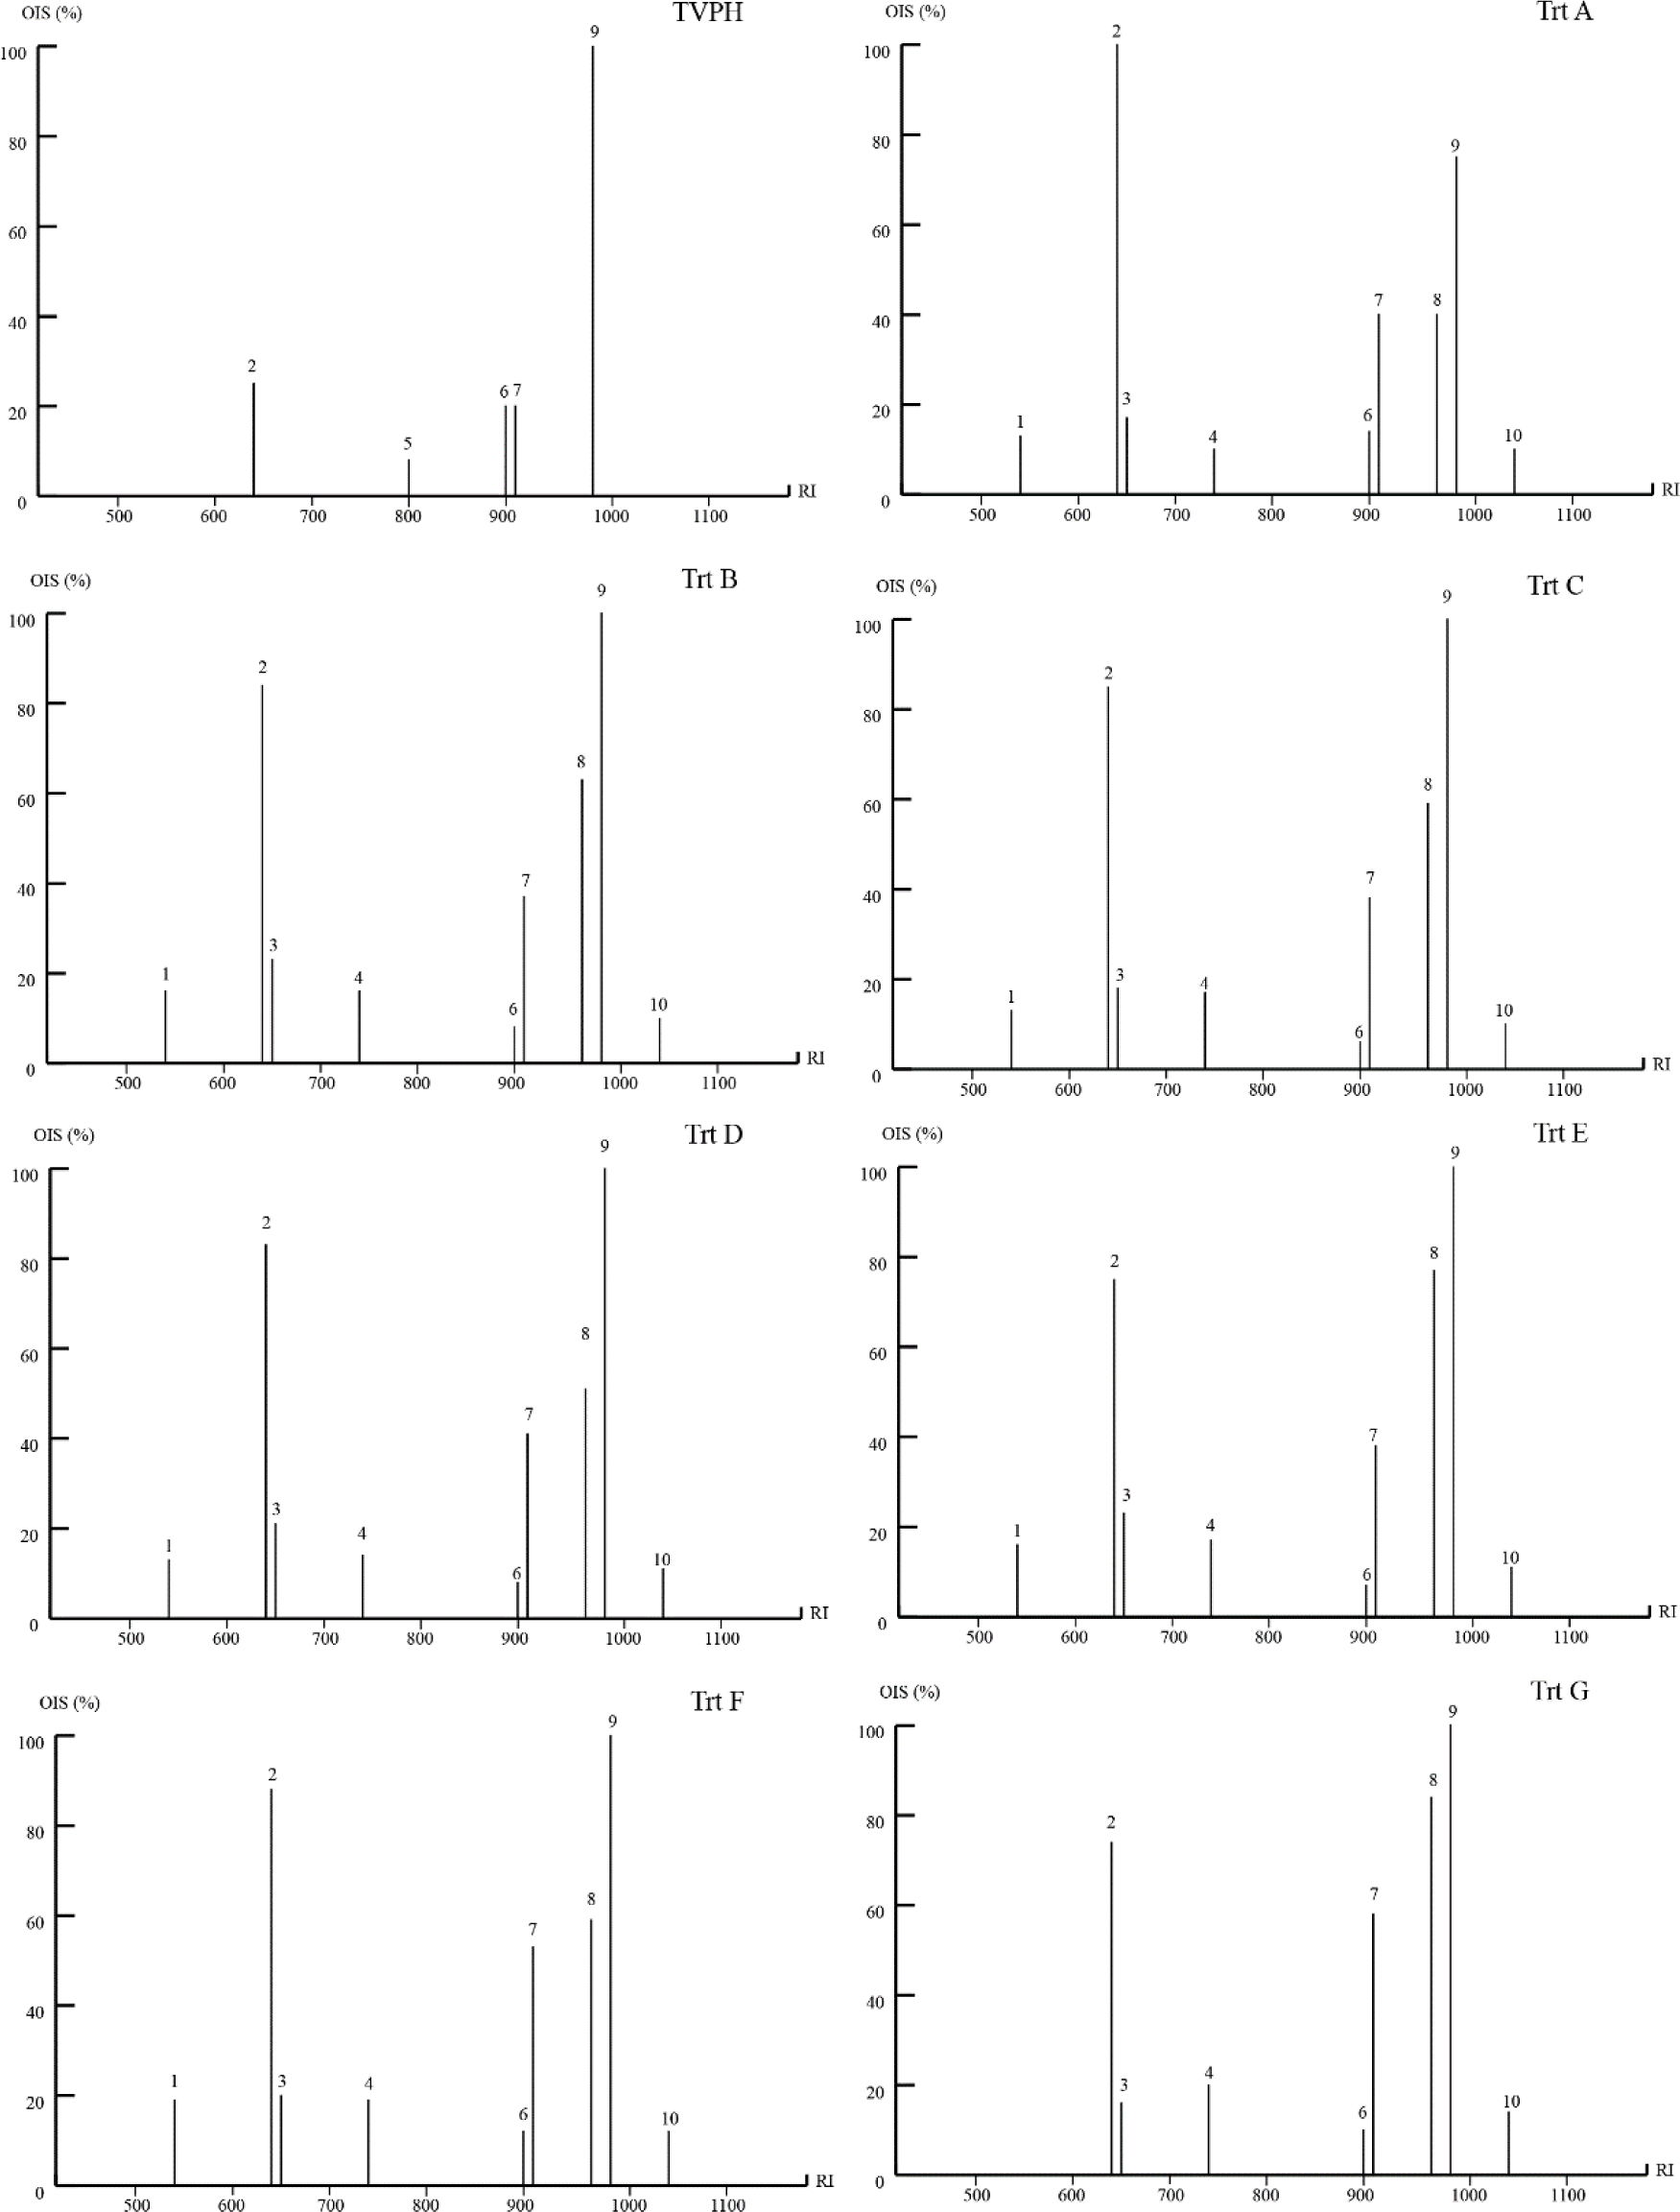
To visualize aroma profiles of sample, OIS was calculated and is shown in Fig. 4. Among the 25 volatile compounds in tuna visceral protein hydrolysate (TVPH and TVFE), 10 compounds showed odor activity above 5%. The potent volatile compounds were classified from OIS activity into three groups. First was the non-Maillard sample (TVPH) which lacked OIS in the sulfide volatiles, such as dimethyl disulfide and dimethyl trisulfide. 1-Octen-3-ol was the strongest odorant having OIS as 100% while 3-methylbutanal, (z)-4-hepteanl and methional showed OIS proximately 20% supported to TVPH aroma. Second was Maillard sample without supplements (Trt A) composed of OIS from alcohol, sulfide and aldehyde volatiles such as dimethyl trisulfide, 1-octen- 3-ol, benzeneacetaldehyde. 3-Methylbutanal was the strongest odorant containing OIS as 100% while the next potent odorant was 1-octen-3-ol (75%). Methional and dimethyl trisulfide were the next potent volatile odorants (40%). 2-Methylpropanal, 3-methylbutanal, dimethyl disulfide (z)-4-hepteanl and benzeneacetaldehyde contained OIS from 10-20% supported to Trt A aroma. Third were Maillard samples with supplements (Trt B, C, D, E, F, and G). 1-Octen-3-ol was the strongest odorant having OIS as 100%. The next potent volatile odorants were 3-methylbutanal, methional and dimethyl trisulfide having OIS from 37%–88%. 2-Methylpropanal, 3-methylbutanal, dimethyl disulfide (z)-4-hepteanl and benzeneacetaldehyde showing OIS from 10%–25% supported to the aroma profiles of these Maillard samples with supplements. OIS of volatile compounds provides a more convenient and faster procedure for the characterization of odor qualities and the determination of potential odors in various samples.

Conclusion
Flavor extraction from tuna viscera was extracted using Endo/Exo Protease enzyme by controlling three factors: temperature, enzyme content and incubation time. The results showed that 60°C, 0.5% (w/w) of enzyme and four hours of treatment were suitable for producing protein hydrolysate (TVPH). It was then used to produce a tuna flavor enhancer (TVFE) via a Maillard reaction. Maillard reaction with/without supplements (xylose, YEs and methionine) to enhance flavor was conducted. According to PCA and OIS results, volatile and aroma profiles of TVFE could be separated into two groups; first was Trt A (without Maillard supplements) and second was Trt B, C, D, E, F, and G (TVFE-with Maillard supplements). The presence of xylose and amino acids can form dicarbonyl compounds, nitrogen and sulfur containing compounds during Maillard reaction. It was concluded that, in the case of flavor enhancer, only xylose supplement was sufficient for enhancing flavor of TVFE. 3-Methylbutanal, 2-methylbutanal, 1-octen-3-ol 2,5-dimethylpyrazine, methional and dimethyl trisulfide were the potent odorants contributed to the meaty, creamy, and toasted aroma in TVFE.


