
Introduction
As an archipelago country, Indonesia has substantial maritime resources, including fishery, transportation, tourism, and cultural heritages (Glaser et al., 2015; Rochwulaningsih et al., 2019). However, excessive maritime exploration often results in increasing pollution issues, impacting marine biota and biodiversity (Mujiyanto et al., 2023; Thushari & Senevirathna, 2020). The increase in anthropogenic activities-induced pollution in recent decades has deteriorated the seawater condition and ecosystem (Jha et al., 2015; Wisha & Maslukah, 2017). Excessive nutrient enrichment, heavy metals, and other pollutants lead to a steady decline in the water quality in Indonesian waters (Adyasari et al., 2021). On the other hand, riverine and estuarine waters become more prone to ecosystem modification due to the limited capacity of pollutant retaining, thereby increasing the terrestrial pollutant intake without attenuation (Sahoo et al., 2017).
The ecosystem plays a vital role in ecology and economy. Ecologically, the ecosystem is the place for feeding, preying, proliferating, and ensconcing, where the food chain and web processes occur. Meanwhile, economically, the ecosystem supports fishers to occupy their daily consumption and meet market needs (Groot et al., 2010). Hence, the disturbances in the marine ecosystem can become a severe problem in the future if it is not well-managed and controlled, and integrated regular monitoring is necessary to control the pollution level and maintain the ecosystem’s health. Ecosystem-related issues recently reported in the Sinjai waters and Sembilan Archipelago, South Sulawesi, Indonesia, where destructive fishing, eutrophication, sedimentation, and heavy metal pollution tremendously deteriorate and degrade the surrounding water quality (Lampe et al., 2017; Rani et al., 2018; Rosalina et al., 2022).
The Sembilan Archipelago is one of the conserved areas in South Sulawesi, well-known for its substantial biodiversity (Rosalina et al., 2022). However, only a few studies report the ecosystem status and environmental conditions in the Sembilan Archipelago. Lampe et al. (2017) described the impact of destructive fishing on the environment in the Spermonde and Sembilan Islands waters. A high potential for eutrophication and sedimentation issues in the Sembilan Archipelago has been reported by Rani et al. (2018). A significant heavy metal content in seagrass meadows has also been reported, possibly contaminating the Sembilan Archipelago (Rosalina et al., 2022). On the other hand, this water region faces significant degradation due to increased anthropogenic waste and activities in the Sinjai Regency and the low transport mechanism within a semi-enclosed gulf of Bone (Kunarso et al., 2018; Rosalina et al., 2022). Meanwhile, Uspar et al. (2020) reported coral reef monitoring in this region, whereby the living coral covers more than 50% of the total life form. However, the coral reef fish ecosystem and composition have never been assessed and surveyed, and these aspects should be investigated.
Concerning the coral reef fish composition in the Sembilan Archipelago, humphead wrasse (Cheilinus undulatus) within the ecosystem could also be the bio-indicator detecting the changes in water conditions. The humphead wrasse is a high-level coral reef predator associated with deep habitats and steep slopes (de Mitcheson et al., 2010). Moreover, its influence on other coral reef fish should be clearly explained. Indeed, Sinjai waters had become well-known as the provider of humphead wrasse in the past, and now, the population of this fish is threatened by overfishing and habitat destruction (Zhao et al., 2022). Furthermore, this species is categorized as an endangered biota, listed in Appendix II of CITES (Convention on International Trade Endangered Species of Wild Fauna and Flora) (Daly et al., 2020).
The minimal population of the humphead wrasse in the ecosystem makes reports regarding the abundance of this “Napoleon fish” in the surrounding Sinjai seawater and Sembilan Archipelago and their interaction with other coral reef fish species and their response to the changes in water quality limited. Therefore, this study aims to determine the influence of the eco-environmental states of Sembilan Archipelago waters on the Napoleon fish abundance and the species composition of coral reef fish. This integrated study is expected to become the basis for future decision-making for local government and third parties in managing and controlling the balance of the ecosystem and environment for supporting sustainable development goals.
Materials and Methods
This study was conducted in the Sembilan Archipelago, Sinjai Regency, South Sulawesi Province, Indonesia (Fig. 1). The study area is separated from the Sinjai Regency central region, with a total area of about 7.55 km2. It is located approximately 12 miles from the city center of Sinjai Regency within the Bone Strait and is bordered by Southeast Sulawesi Province in the east. The Sembilan Archipelago is the smallest subdistrict in the Sinjai Regency, with only 1% of the total regency area. This area is characterized by a warm climate with an air temperature at midday ranging from 29.1°C to 32.4°C. Apart from that, the Sembilan Archipelago is well-known as the center of marine tourism, with many attractions and high biodiversity.
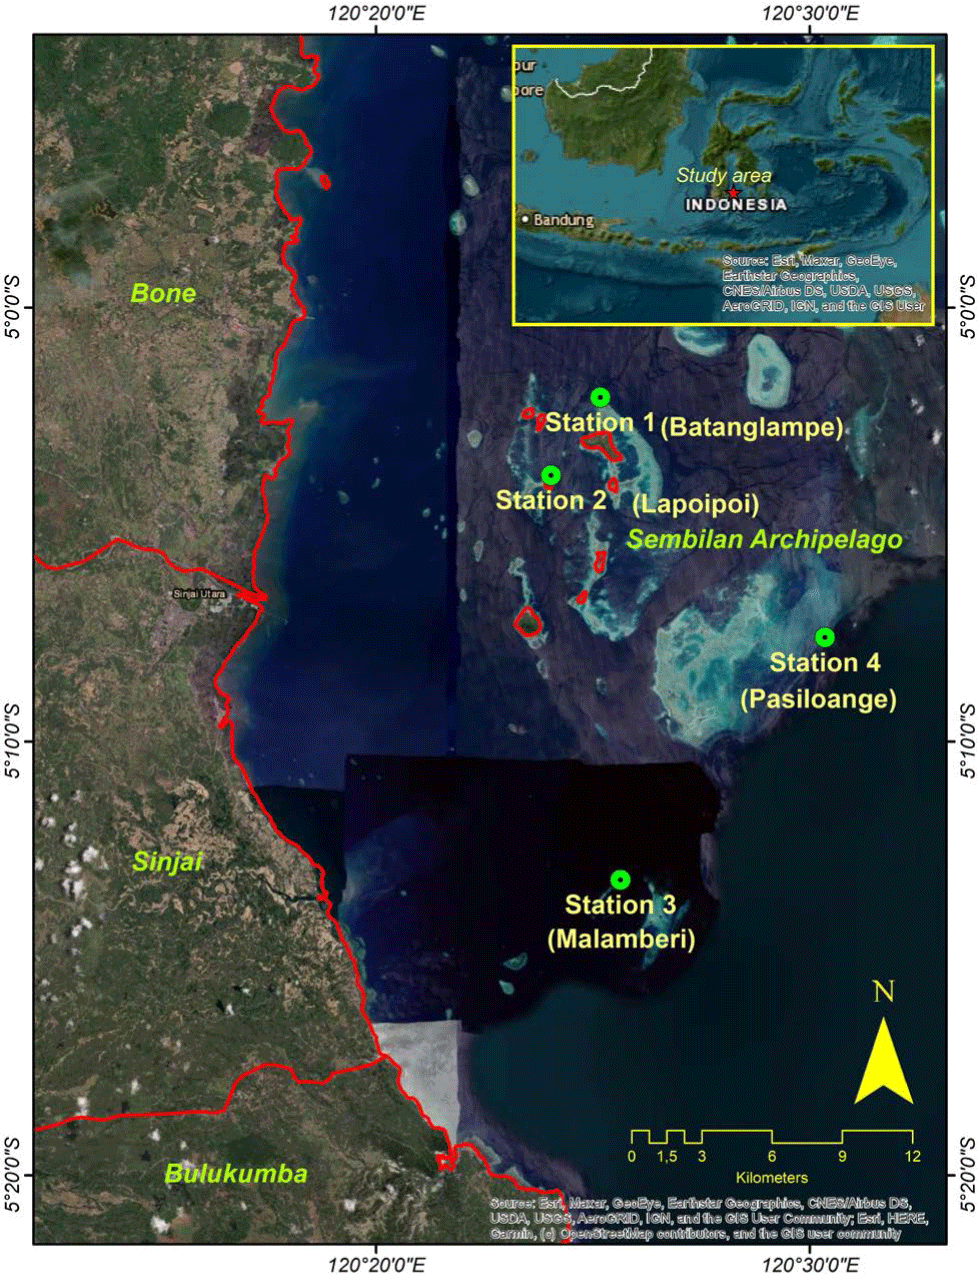
The field survey was focused on the four primary areas: Batanglampe Island, Lapoipoi Island, Taka Malamberi, and Taka Pasiloange (Fig. 1). According to locals, these locations are the significant water zone in the Sembilan Archipelago, where humphead wrasse inhabits and is frequently found. The site observation was carried out using a snorkeling visual census with several transect trajectories (Bellwood et al., 2005). Since the nature of humphead wrasse is less findable, a longer transect length is obligatory. In this case, a 1-km transect track was used to monitor the presence of the humphead wrasse and other reef fishes as the primary observed objects in this study. Due to the shallow water area observed in every station, a snorkeling method is sufficiently efficient to monitor the humphead wrasse fish and its ecosystems.
Fisheries-based survey methods are widely used to estimate the abundance and biomass of fish at underwater visual censuses (Syam et al., 2019). This technique increases the understanding of ecological impacts due to exploited fishery resources and the environmental degradation of coastal ecosystems (Mujiyanto et al., 2023; Wisha et al., 2019). In addition, field surveys tend to be more consistent than measuring the characterization of fish groups, such as abundance, size structure, and species composition. Region-specific survey data can also be used in estimating the density per unit area and diversity of sample taxonomic groups. Moreover, data in the form of species-specific values in biomass units are essential in studying fish, especially the changing nature of fish growth (Wisha et al., 2019).
The coral and other lifeform were surveyed using a point intercept transect technique. The sampling was performed twice in every location, considering two depth measurements (between 3−5 m and 6−10 m). The transect was unfurled about 100 m parallel toward the closest coastline as a monitoring reference to record the coral category and taxa. In this case, one colony is considered one individual (Wisha et al., 2019). The coral cover (in percent) was calculated using a formula as follows:
CRc = Percent coral reef cover (%)
Llf = Total length of life form (cm)
Lt = The length of transect (cm)
To assess the coral ecosystem in more detail, a species diversity quantification was also performed using a Shannon-Wiener formation as follows:
DI = Diversity index
R = The total amount of individual
ri = The total of individual of i-species
On the other hand, to assess the damaged coral ecosystem, reflecting the rate of environmental alteration based on dead and living corals, a mortality index quantification was employed as follows:
MI = Mortality index
%dc = The number of demised corals (%)
%lc = The amount of living corals (%)
The value of MI reflects the coral reef condition, whereby if the MI value is close to 0, there is no change in the living coral community. On the other hand, if the MI is close to 1, it indicates a high rate of coral mortality. The category of coral cover, diversity index, and mortality index are shown in Table 1.
| Category | Percent cover (%) | Diversity index (DI) | Mortality index |
|---|---|---|---|
| Poor | 0−24.9 | DI < 1 | 0.75−1 |
| Fair | 25−49.9 | 1< DI <3 | 0.5−0.749 |
| Good | 50−74.9 | DI > 3 | 0.25−0.499 |
| Excellent | 75−100 | − | 0−0.249 |
Water samples in each observation station were sampled using a Nansen bottle for further analysis in the laboratory. On the other hand, a direct water measurement was performed using a TOA DKK water quality checker. The observed parameters include temperature, salinity, pH, dissolved oxygen (DO), and chlorophyll-a. The water quality checking was done in the surface water with a depth of approximately 0−1 m, with at least three repetitions in every station.
The nutrient concentration was analyzed using a spectrophotometer, with a specific wavelength for every nutrient derivation. Nitrate was determined by applying a 410 nm wavelength with brucine identification. Ammonia was quantified using a 640 nm wavelength. On the other hand, nitrites were analyzed under an acidic condition, with pH ranging from 2−2.5, yielding a reaction with azo compounds and applying a 543 nm wavelength (Wisha & Maslukah, 2017). The phosphate determination was performed using 700-800 nm wavelength and ascorbic acid levels, resulting in blue phosphomolybdic complex compounds, and these compounds were reduced using ascorbic acid to yield a molybdenum complex with blue color. The color intensity reflects the phosphorus concentration (Tjahjo et al., 2023).
To analyze water quality status as a part of ecological assessment in this study, a coastal water quality index (CWQI) quantification was employed (Jha et al., 2015). The formula of CWQI is as follows:
c = Proportionality coefficient
Pi = Permissible limit for I-parameter
Pr = Parameter concentration rating (between 1−100)
The parameter concentration rating/score was based on the comparison to a standard quality. In this case, a national water quality standard for supporting marine life established by Indonesian Government, regulation number 22 in 2021, was employed. After quantifying all sub-indices from the considered parameters, the results were compared to the CWQI criteria shown in Table 2.
| CWQI range | Category |
|---|---|
| 0−25 | Very poor |
| 26−50 | Poor |
| 51−70 | Moderate |
| 71−90 | Good |
| 91−100 | Excellent |
Adapted from Jha et al. (2015) with permission of Elsevier.
The abundance of larvae in the plankton was surveyed using an oblique hauls technique from 10 m up to 0.5 m below the surface. In this survey, a plankton net with a pore size of 250 µm with a 0.5 m diameter of the circular aperture. The net was hauled for about two minutes at low boat speed (3 to 4 knots). The filtered water was approximately 100 m3 per haul, estimated using a flow meter. Then the filtered sample was prepared using 4% formaldehyde. The plankton and larvae samples were analyzed under a stereomicroscope with 100 times magnification in the laboratory. These above procedures were also applied to phytoplankton samples, with a different plankton net (0.35µm pore size) used to collect the samples. The identification was referred from Boyd (1990), Davis (1955), and Yamaji (1979).
After gaining the field-measured chlorophyll-a data, the primary productivity (PP) of the study area was estimated as part of ecological assessment by adapting a formula as follows:
PP = Primary productivity (mgCm−3d−1)
C = Constant (≈1.97)
a = Assimilation coefficient (≈3.2)
Cchl−a = Chlorophyll-a concentration (mgm−3)
DH = Solar radiation time in a day
A two-way hierarchical clustering analysis (CA) was used to group similar characteristics of the coral reef census in every station. Pearson’s correlation coefficient was employed to examine the relationship between environmental parameters, including water quality, nutrients, and biotic factors. On the other hand, a principal component analysis (PCA) was employed to analyze the correlation among all standardized parameters that significantly determine the water condition in every observation station. Furthermore, canonical correspondence analysis (CCA) was used to analyze the relationship between eco-environmental parameters and the coral reef fish species. These statistical-based analyses were performed using PAST software version 4.11 (Hammer et al., 2001).
Results and Discussion
Based on the field census, there were only four sightings of humphead wrasse in the study area, particularly at the Batanglampe and Lapoipoi stations, with a calculated density of about 4 Ind/ha, respectively (Table 3). No Napoleon fish were identified during the survey at the remnant stations (Malamberi and Pasiloange).
| Station | Transect length (m) | Covered area (ha) | Density (Ind/ha) |
|---|---|---|---|
| 1 (Batanglampe) | 1,026 | 1.03 | 3.89 ≈ 4 |
| 2 (Lapoipoi) | 1,028 | 1.03 | 3.88 ≈ 4 |
| 3 (Malamberi) | 1,376 | 1.38 | 0 |
| 4 (Pasiloange) | 1,548 | 1.55 | 0 |
The composition of coral reef fishes at the four study sites is almost similar from one to another. Except for station 1 (Batanglampe), where the family Caesionidae was not observed throughout the transect, the other stations were composed of about ten families: Serranidae, Siganidae, Acanthuridae, Caesionidae, Haemulidae, Labridae, Lethrinidae, Lutjanidae, and Scaridae (Fig. 2).
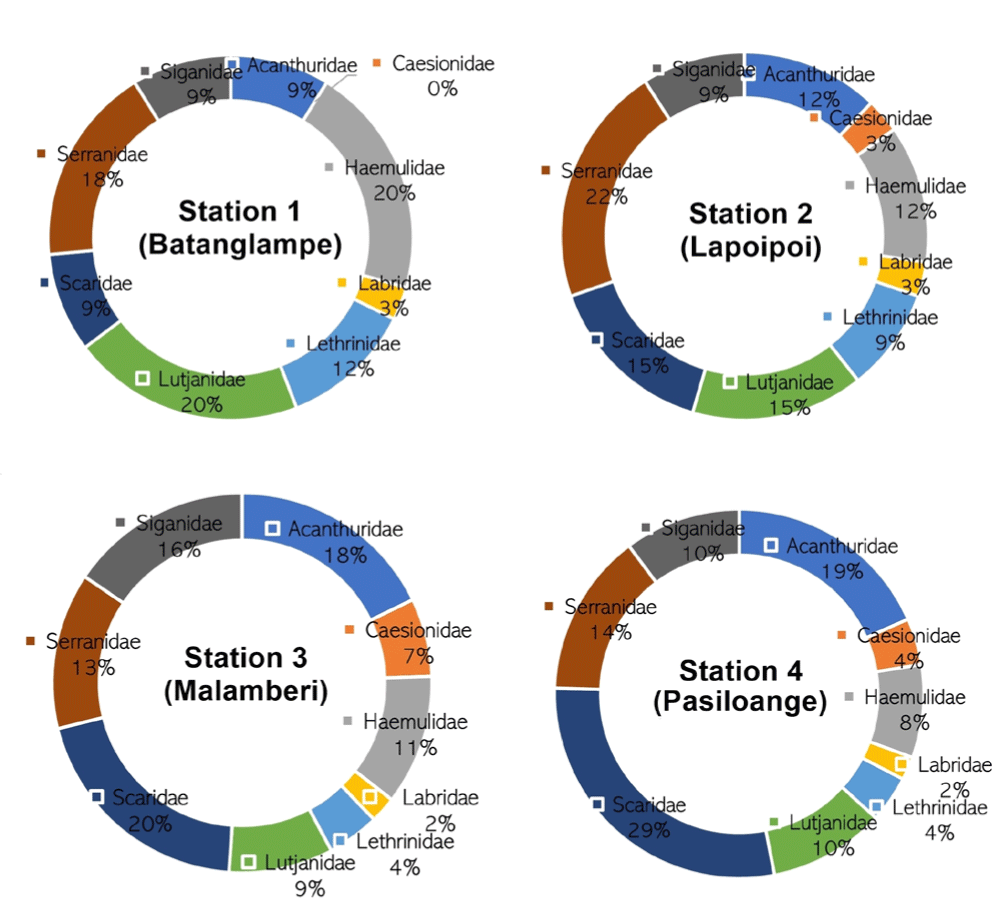
At station 1 (Batanglampe), the most dominant coral reef fish family was Hemulidae and Lutjanidae, with a percentage of about 20%, followed by Serranidae with 18% domination. The remnant families covered a small portion of the composition, with less than 15% domination. Unlike station 1, the coral reef fish at station 2 (Lapoipoi) was predominated by Serranidae with 22%, followed by Scaridae and Lutjanidae, with 15%, respectively. The remnant families were under 15% of coverage.
Most coral reef fish at station 3 (Malamberi) were Scaridae, Acanthuridae, and Siganidae, with percentages of about 20%, 18%, and 16%, respectively. The rest of the reef fish families were slightly sighted during the survey (< 15% domination). Different states were observed at station 4 (Pasiloange), where the most dominant families were Scaridae and Acanthuridae, with 29% and 19%, respectively. The other families showed a more minor domination with less than 15% (Table 4).
Overall, the domination of the coral reef fish family in every station is slightly different. However, a similar pattern was observed in the Caesionidae and Labridae families, showing the most miniature composition within the ecosystem in the study area, with an average of less than 5%. Family Serranidae was the most dominant at stations 1 and 2, where the humphead wrasse fish was observed. On the other hand, the family Scaridae was dominant at stations 3 and 4, where the humphead wrasse fish was not found throughout the observed transect. This condition considers that the presence of humphead wrasse fish relates to the dominant composition of Serranidae. However, this hypothesis should be studied more and proven analytically for future studies.
Ecologically, Cheilinus undulatus is associated with different habitats based on their life phase. The larva of this species is commonly found in seagrass meadows (Enhalus accoroides), hard corals (Acropora sp. and Porites cylindricus), soft corals (Sarcophyton sp.), macroalgae habitat (Sargassum sp.), and branching coral associated with macroalgae (Syam et al., 2019). During their juvenile phase, the humphead wrasse can be found in coral reefs close to seagrass, seaweed, rubbles, and shallow reefs associated with macroalgae. While during their mature phase, this fish inhabits a deeper layer in the reef slopes and reef walls (Daly et al., 2020; de Mitcheson et al., 2010).
The coral reef fish composition is shown in Fig. 3, whereby the most abundant species was observed at stations 3 and 4, totaling about 47 and 51. On the other hand, at stations 1 and 2, the amount of identified coral reef fish was less than 35. Based on two-way hierarchical clustering of coral reef fish data, Scarus sp. is the most observed in the study area, found higher at stations 3 and 4 (Pasiloange and Malamberi). The other dominant species are Acanthurus sp. and Lutjanus sp. observed at station 3. The remnant species are less than those whereby many species were not identified in the study area, as shown by dark blue blocks in Fig. 3. The clustering lines show a similar amount of coral reef fish based on the observed species and the observation station.
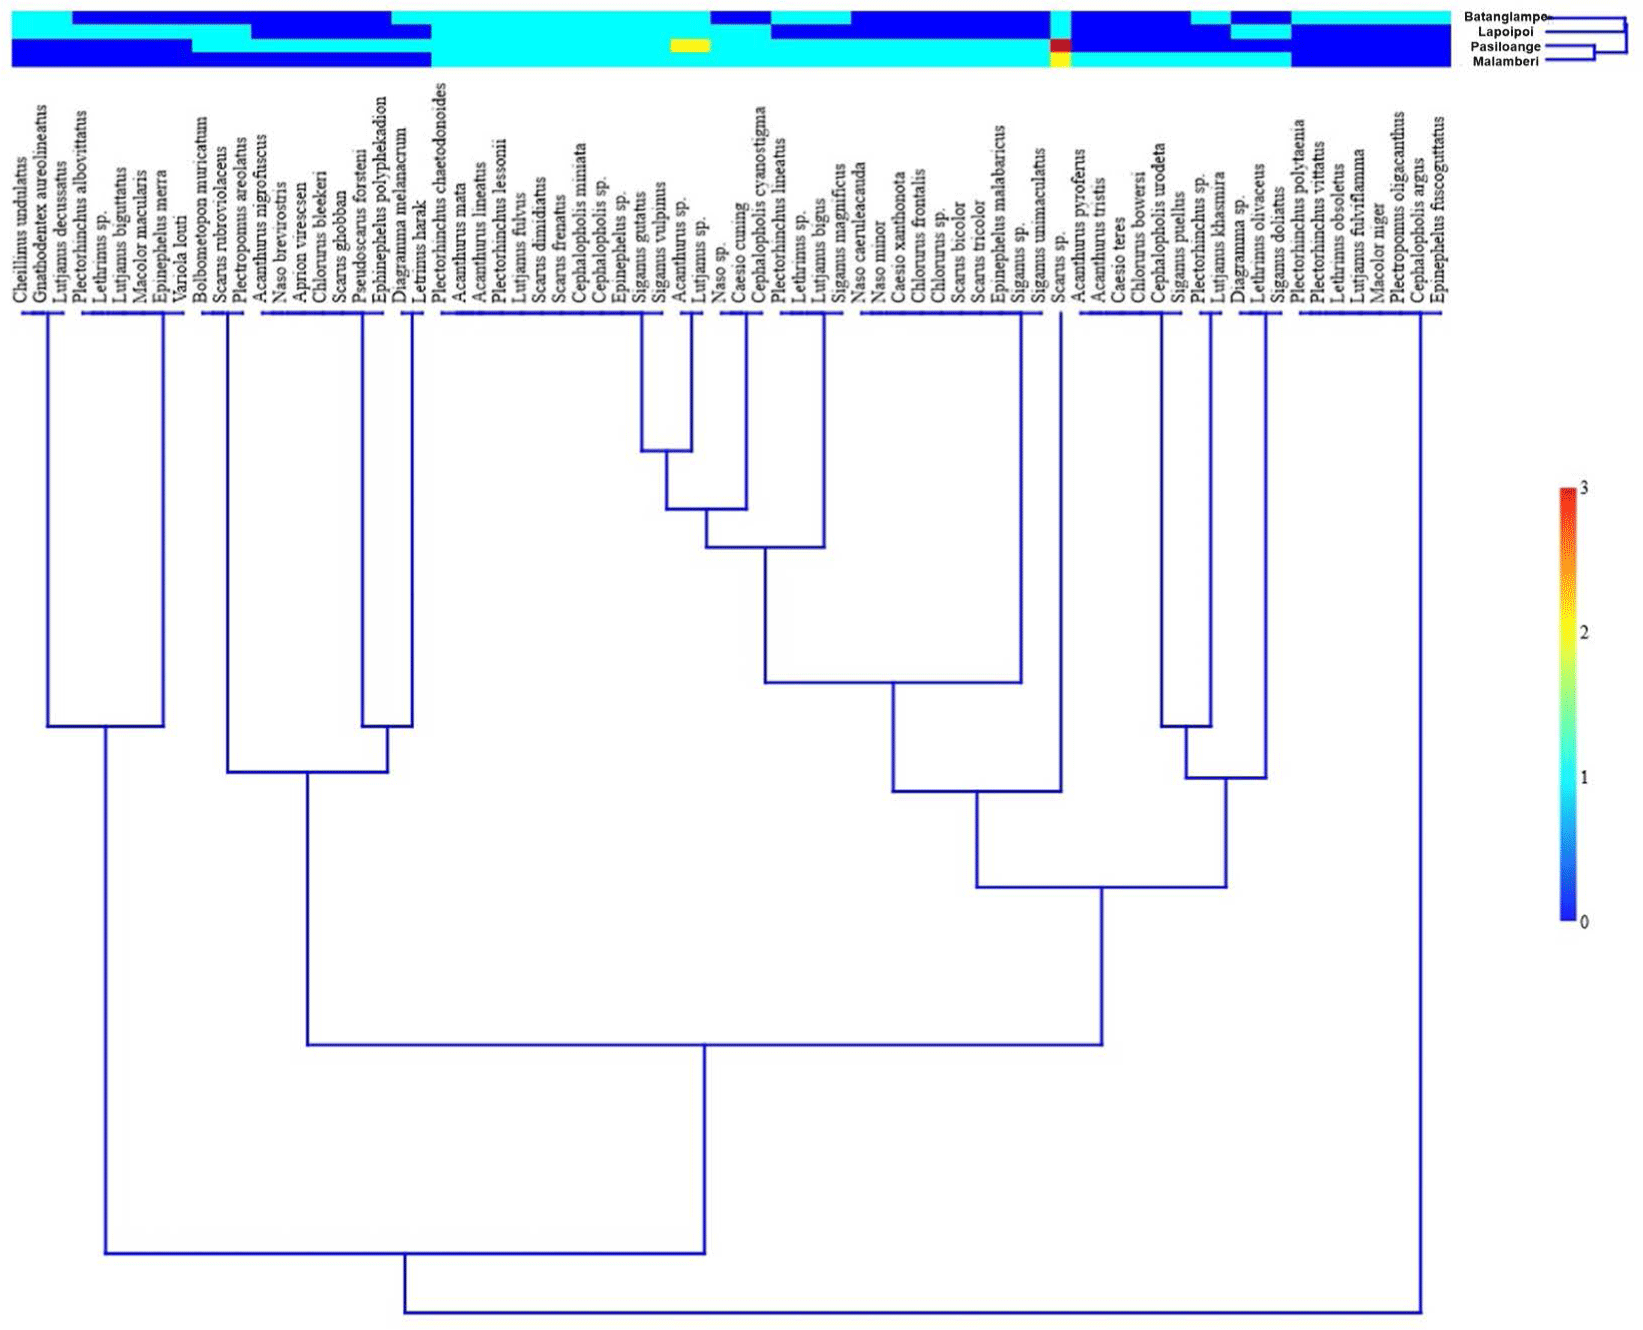
Based on the sighting of humphead wrasse and the species distribution of coral reef fish, it is slightly difficult to determine their relationship and interaction. Concerning the field data in this study, the humphead wrasse sightings coincide with the lower amount of coral reef fish composition. Hence, an ecological examination is necessary to determine the most prominent environmental factor relating to the number of humphead wrasse.
The percentage of lifeform in the study area is shown in Fig. 4. Overall, living corals at all observation stations were predominant, reaching approximately 50% coverage, with the demised corral percentage of less than 30%. At station 1 (Batanglampe), 50% of living corals were observed, predominated by branching, encrusting, and sub-massive Acropora and non-Acropora, even though the demised corals were sufficiently high, reaching 28.6%. The other lifeform classification identified in Batanglampe was algae (5.6%), other biotas (soft corals, sponges, and zoanthids) (8.6%), and abiotic factors (8.3%).
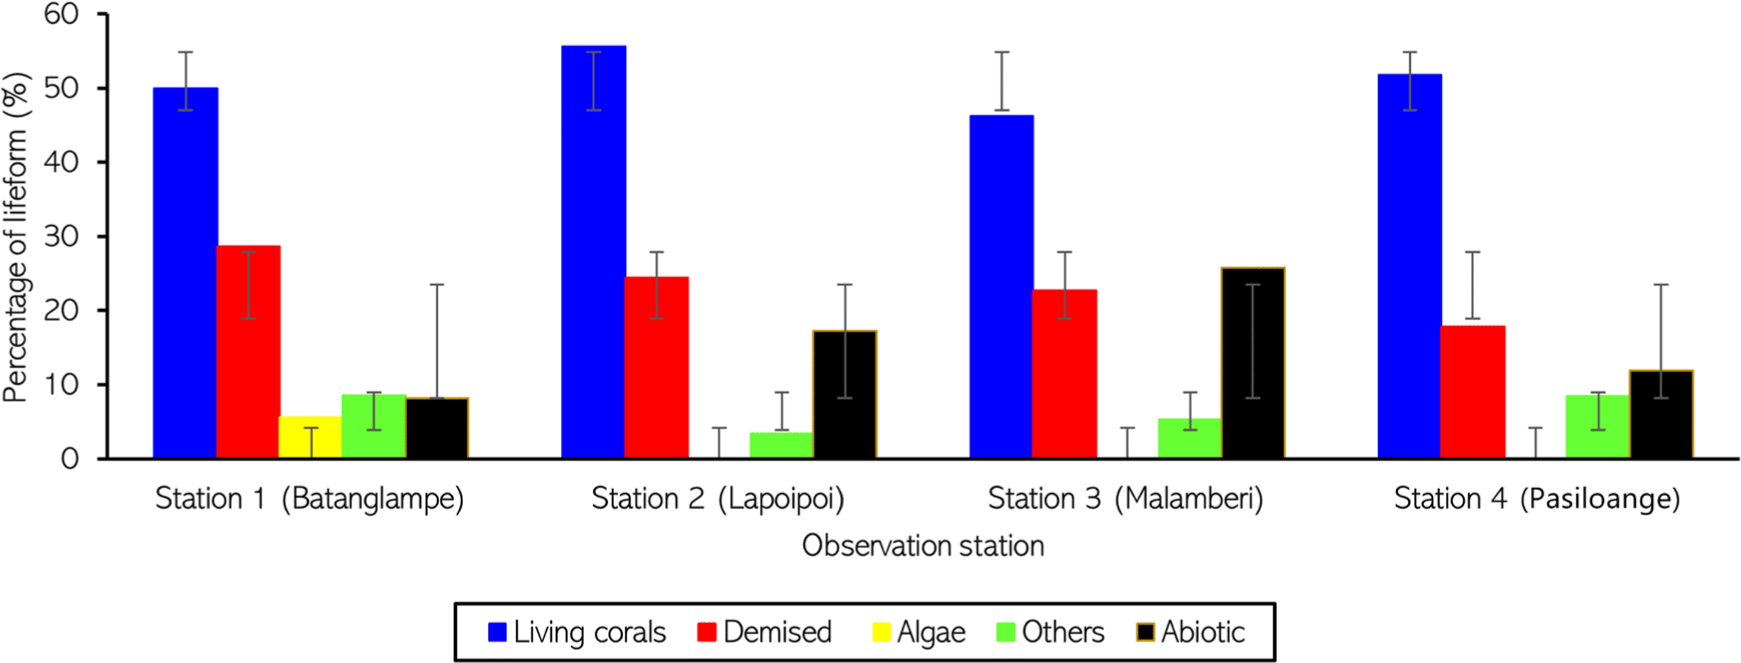
A better coral condition was observed at station 2 (Lapoipoi), whereby the living coral coverage reached 55.6%, with a majority of branching Acropora and encrusting non-Acropora, and the demised coral covered approximately 24.4%. No algae were observed in this station. Other biotas (soft corals, sponges, and zoanthids) and abiotic factors were 2.7% and 17.3%, respectively. A similar pattern of the observed lifeform was identified at station 4 (Pasiloange), where the living coral coverage was more than 50%, and the demised coral was 17.8%, with most of the branching type. Other biota and abiotic factors showed almost the same percentage, with less than 12%.
Unlike the other stations, the living coral percentage at station 3 (Malamberi) was the lowest, with 46.2%. A sufficiently high demised coral was also observed, covering about 22.7% of the total observed area along the transect line. The most found coral type was branching and encrusting Acropora and non-Acropora. Alge was not found in these stations, and non-coral biota was relatively low, with only 5.3% covers. However, abiotic factors were the second majority of lifeform cover in this station, with 25.8%.
Based on the living coral percentage, except for station 3, the other stations are categorized as good coral conditions. These results are also consistent with the value of the diversity index. On the other hand, based on the mortality index, stations 1, 2, and 3 are classified as good coral states, and station 4 is categorized as excellent coral condition due to the lowest demised coral observed.
Overall, all observation stations show an ideal coral condition supporting the life cycle within the ecosystem. Even though the coral mortality is sufficiently high at stations 1 and 2, the living coral percentage is, on average, 50% in all stations. Concerning the coral reef fish composition, due to the dependent humphead wrasse and other coral reef fish species on coral reef ecosystems (Daly et al., 2020; de Mitcheson et al., 2010; Mujiyanto et al., 2023; Syam et al., 2019), the high demised coral observed at station 1 and 2 reflects the lower coral reef fish abundance at those stations, which inversely proportional with the presence of humphead wrasse.
Compared to the quality standard established by the Indonesian government’s regulation number 21 in 2021, the water quality, biotic component, and nutrients showed a considerable variation in each observation station, which generally exceeds the allowed quality standard for marine biota. Water quality data are represented by temperature, salinity, DO, and pH. Overall, they are decent for supporting marine biota and consistent with the quality standards, even though at several stations, such as stations 1 and 2, the temperature and salinity were more/less than the standard, with a small deviation (Table 5). The water temperature salinity in the study area ranged from 30°C−32°C and 31‰−34‰, respectively, with the highest value observed at Batanglampe station. The relatively higher temperature in the study area could impact the surrounding ecosystem, such as increasing heavy metals and nutrient deposition in water (Tjahjo et al., 2023; Wisha et al., 2018).
The DO in the study area was typical and tended to be higher than the standard (> 5 mg/L), meaning that the water condition is normal, and the oxygen supply is adequate to support marine life. The higher DO value ranging from 7−8 mg/L also shows that the photosynthesis generated by the autotroph biota is relatively normal. On the other hand, except for the identified pH at station 4 (Pasiloange), the pH value in the other stations was within the recommended range for supporting marine biota, ranging from 7–8.5. A slightly lower pH value at station 4 indicates that there are pressures from anthropogenic factors increasing the acidity level in water (Jha et al., 2015; Wisha et al., 2018). However, even though the deviation was about 0.5, it is still tolerable, and the Pasiloange waters are still feasible for marine ecosystem.
Even though there are no specific standards for the biotic components, such as chlorophyll-a, zooplankton, and larvae abundance, the value obtained could reflect the water condition in every observation station. On the other hand, the standard for phytoplankton abundance for supporting marine life is 1 million cells/m3, and stations 1 and 2 showed a 5−6 times higher value than that. By contrast, at stations 3 and 4, the abundance was below the standard (less than 800,000 cells/m3) (Table 5). This state considers that the abundance of phytoplankton highly determines the sighting of humphead wrasse, which was only found at stations 1 and 2. It is logical since the abundance of phytoplankton reflects the energy source and foods for higher trophic biota, such as humphead wrasse. Concerning the condition of other biotic components, zooplankton abundance was directly proportional to phytoplankton, whereby the higher abundance was observed at stations 1 and 2 (more than 50,000 cells/m3). This similar relationship was consistent with many studies (Grémillet et al., 2008; Purnamaningtyas & Mujiyanto, 2021; Wisha et al., 2018; Yusuf et al., 2021). In addition to larvae abundance, the pattern was not proportional at every station, whereby higher abundance was observed at stations 2 and 4, with more than 500 Ind/L, while a smaller value was found at stations 1 and 3, ranging from 83−351 Ind/L (Fig. 5).
The chlorophyll-a concentration and the value of primary productivity showed a very similar pattern in every station, showing that the chlorophyll-a content in water reflects the state of primary productivity. The chlorophyll-a concentration ranged from 0.34−2.25 mm/m3, and the primary productivity ranged from 26.02−170.28. The highest value was identified at station 1, and the lowest was found at station 4. Primary production is defined as the amount of organic compound synthesis from the atmosphere and aqueous CO2, where this process occurs during a photosynthesis mechanism performed by the autotroph biota and relies on nutrient availability (Yusuf et al., 2021). Hence, the primary productivity in every station was in line with the abundance of phytoplankton and chlorophyll-a.
Nitrite concentration in the study area ranged from 0.19−0.22 µg/L, which was significantly low compared to the quality standard established by the Indonesian government, number 21 in 2021 (8−10 µg/L). The highest value was found at stations 2 and 4, and the slightly lower nitrite was found at stations 1 and 3. This significantly low nitrite concentration indicates that nitrobacteria optimally transform nitrite to nitrate within a high DO condition. Hence, the N cycle in the study area takes place normally (Tjahjo et al., 2023; Wisha et al., 2018). This state was consistent with the tremendously high nitrate concentration observed at the four observation stations, ranging from 0.475−0.603 mg/L. This range of nitrate was way higher than the allowed nitrate for marine ecosystems (0.06 mg/L). The highest nitrate was found at Lapoipoi and Malamberi stations, ranging from 0.518−0.603 mg/L. While the lower nitrate was found at Batanglampe and Pasiloange stations, ranging from 0.475−0.477 mg/L. As a result of the N cycle, nitrate enrichment is possible, thereby triggering a toxic environment (John & Flynn, 2000).
Ammonia concentration in the study area ranged from 0.085−0.339 mg/L. Except for station 2 (Lapoipoi), the ammonia concentration was below the allowed standard (less than 0.3 mg/L). The ammonia concentration indicates that the N fixation and ammonification process takes place very well in the Sembilan Archipelago, which is very useful for supporting autotroph biota in photosynthesis (Tjahjo et al., 2023).
Unlike ammonia, an opposite condition of phosphate was observed at the four observed stations, whereby the lowest value was found at stations 2 and 3 (less than 0.011 mg/L). In contrast, the other stations exceeded the allowed concentration (more than 0.015 mg/L). The highest phosphate concentration was observed at station 1, reaching 0.049 mg/L. In water, phosphate runs into dissolution and precipitation processes, yielding soluble inorganic phosphate and polyphosphate. The inorganic phosphate will be deposited in the sediment due to its instability in the form of gas, thereby declining the P concentration in the water column (Wisha et al., 2018).
Concerning the N:P ratios in the Sembilan Archipelago, it was calculated based on the value of dissolved inorganic nitrogen and dissolved inorganic phosphorus (Table 5). Overall, except for station 1, the other stations showed a very high ratio value, indicating the dominant N-nutrients in the water (P-limited conditions), reaching 143.20, particularly at station 2. At station 1, the N:P ratio was 11.47, showing that the limitation of N and P was slightly equal in this station, indicating a sufficiently high P concentration compared to the other stations. The total N and P remarkably influence phytoplankton growth, which relates to the food source availability for higher-level trophic. According to Arofah et al. (2021) and Klausmeier et al. (2004), the optimal N:P ratio will vary depending on the ecological conditions and the Redfield ratio 16 is not a universal biochemical optimum, but instead represents an average of species-specific N:P ratios.
Based on the CWQI scoring assessment, all observation stations are categorized as good water quality (at stations 1 and 4) and excellent water quality (at stations 2 and 3), with the CWQI value ranging from 87.99−98.26 (Table 6). The lowest parameter score belongs to nitrite since its concentration is tremendously lower than the standard. However, this low score is covered by the other parameter scores, which are adequate to support marine life, resulting in a high total score of CWQI. These results indicate no severe issues related to the water environment in the Sembilan Archipelago. The water quality status does not solely reflect the abundance of humphead wrasse and other coral reef fish composition. On the other hand, specific water quality parameters, such as nutrients and phytoplankton, would be more significant in determining the composition of higher-trophic coral reef fishes (Tjahjo et al., 2023). Therefore, even though the total value of CWQI shows a good water quality, the specific parameters considered within the calculation of CWQI may have a specific role in triggering environmental issues, such as algal blooming, nutrient enrichment, and even heavy metal deposition (Sahoo et al., 2017; Zhang et al., 2017).
| Station | CWQI value | Category |
|---|---|---|
| Batanglampe | 87.88 | Good |
| Lapoipoi | 93.07 | Excellent |
| Malamberi | 98.26 | Excellent |
| Pasiloange | 90.23 | Good |
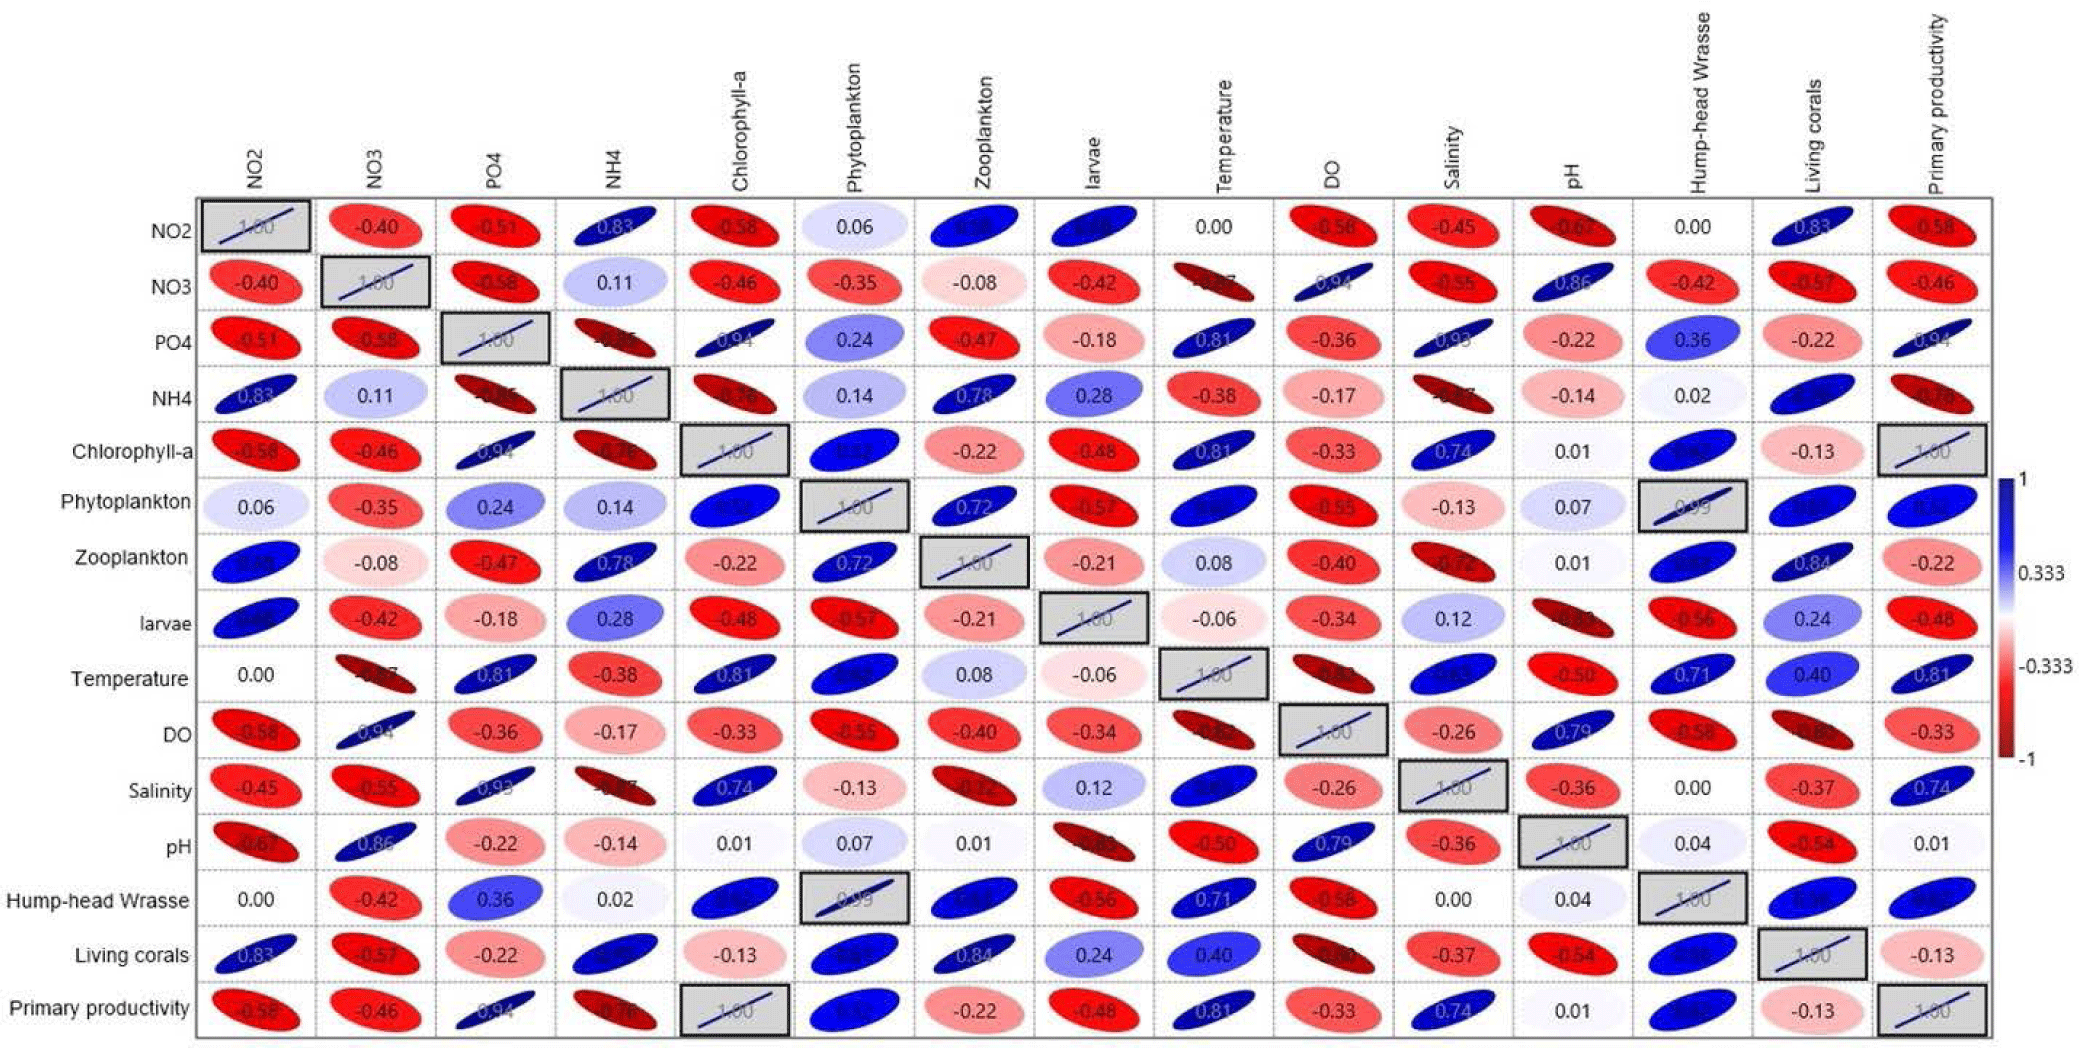
The results of Pearson’s correlation analysis are shown in Fig. 5. Overall, based on the water quality data, biotic component, nutrients, and the sighting of humphead wrasse, it is found that the most significant correlated parameters are between phytoplankton abundance vs. humphead wrasse and chlorophyll-a vs. primary productivity, with the correlation coefficient reaching about 1.00 (perfectly correlated) and significance F < 0.05 (statistically significant). This finding demonstrates the prey activity of the humphead wrasse in the area with higher food availability. In this case, the higher the phytoplankton abundance, the higher the food produced within the food chain (Grémillet et al., 2008).
The other highly correlated parameters are nutrients with other water quality and biotic parameters, such as nitrite vs. living corals, phosphate vs. temperature, salinity, and primary productivity, nitrate vs. DO and pH, ammonia vs. zooplankton and living corals, with the correlation coefficient ranging from 0.7−0.94. These states relate to biogeochemical cycles in the coastal water, whereby nutrients become the primary parameters within the cycle and impact the surrounding environment (Bianchi et al., 2012). On the other hand, aside from its high correlation with the humhead wrasse, phytoplankton also has a close relationship with zooplankton, temperature, living corals, and primary productivity, with the correlation coefficient value ranging from 0.52−0.72 (Fig. 5). Zooplankton is more than 50% correlated with humphead wrasse and living corals. This state is describable since, through their consumption of phytoplankton and other food sources, zooplankton play a significant role in aquatic food webs, as a resource for higher trophic level consumers and as a mediator for organic material within the biological pump (Kagami et al., 2014).
The relationship between humphead wrasse and eco-environmental parameters was assessed using PCA, as shown in Fig. 6. The total variance was 99.99% for components 1, 2 and 3. Principal component 1 (PC1) accounted for 42,78% of the total variance, characterized by temperature, humphead wrasse, and phytoplankton, with the loadings value ranging from 0.8−1.5 (Fig. 6A). This result is consistent with Pearson’s correlation analysis results, whereby those three parameters are significantly correlated with a sufficiently high correlation coefficient (0.71−0.99). Aside from the influence of nutrient availability, water temperature could shape the abundance and distribution of phytoplankton in water (Qu et al., 2018; Tjahjo et al., 2023), while at the same time, the amount of phytoplankton growth could determine the distribution of higher trophic biota (Grémillet et al., 2008), such as the abundance of humphead wrasse.
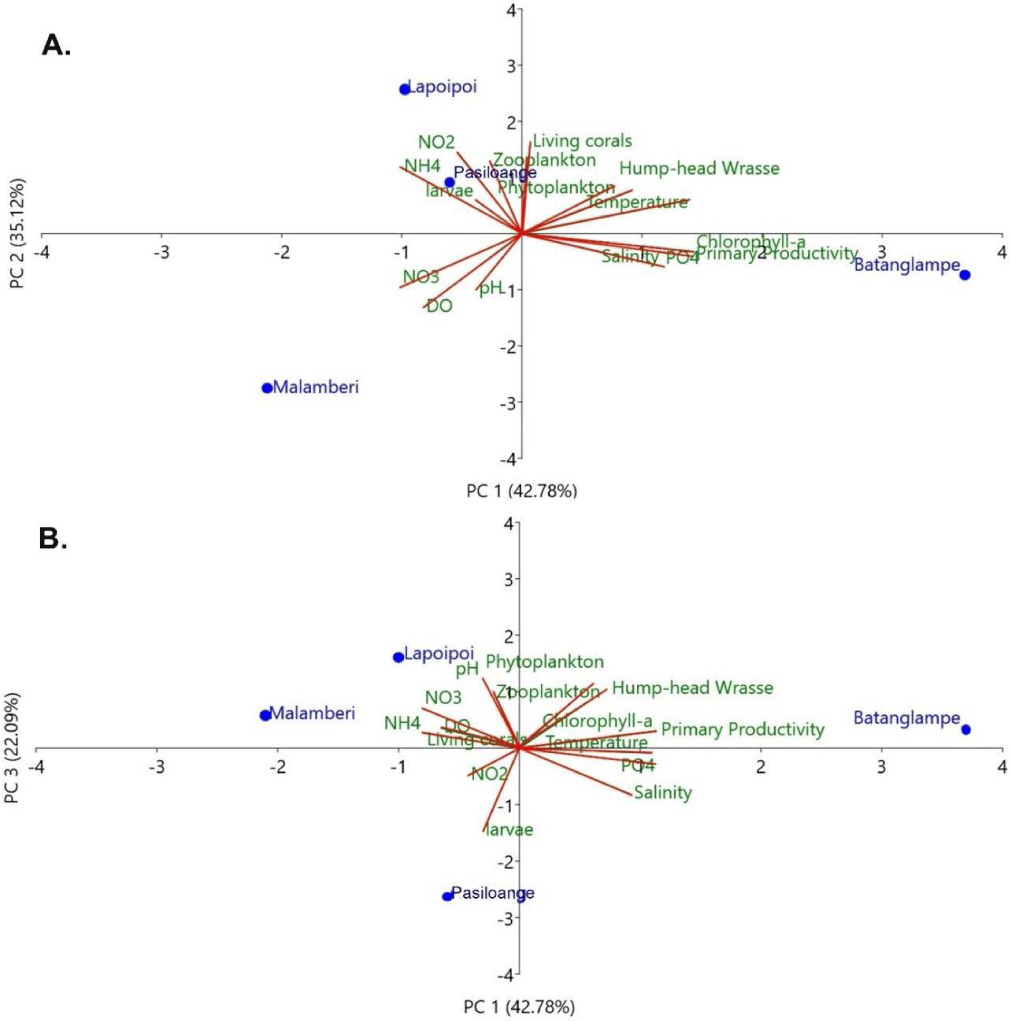
The other possible correlations are observed in chlorophyll-a, primary productivity, salinity, and phosphate concentrations, even though the correlation may be slightly significant (negatively correlated in PC2), with the loadings value ranging from 1.2−1.5. These parameters also characterize Batanglampe station. This state is explainable since phosphate and salinity and other environmental parameters could be the threshold of autotroph biota (phytoplankton), reflected by the chlorophyll-a and primary productivity (Tjahjo et al., 2023; Wisha et al., 2018). On the other hand, the negative value of PC1 shows the less correlated parameters (nitrate, DO, and pH), meaning that these parameters are negatively correlated with the other assessed parameters, despite characterizing the Malamberi station.
Principal component 2 (PC2) explains about 35.12% of the variance. The positive value of PC2 shows that nitrite, ammonia, zooplankton, living coral, and larvae are significantly correlated, with the loadings value ranging from 0.8−1.6. These parameters characterize stations 2 and 4 (Lapoipoi and Pasiloange). In addition to principal component 3 (PC3), the positive loadings for pH and DO (ranging from 0.3−1.3) show that the influence of these parameters is possible to characterize the water quality status in the study area (Fig. 6B). The biplot of PC1 vs. PC3 also shows that the Malamberi station is characterized by nitrate, DO, and living corals.
To estimate the role of eco-environmental parameters in characterizing coral reef fish composition, A CCA was performed (Fig. 7). The CCA1 and CCA2 axes accounted for 83.97% and 11.84% of the variation. Nitrite, ammonia, and larvae abundance significantly correlated with the family Scaridae, especially in the Pasiloange station on CCA1. Moreover, families Siganidae and Caesiodae distribution and abundance are slightly characterized by nitrate and DO and primarily determine the composition at station 3 (Malamberi), even though the negative frequency is identified for these parameters on CCA2. Based on the frequency shown in the CCA2 axis, living corals, nitrite, larvae abundance, ammonia, temperature, zooplankton, salinity, humphead wrasse, phytoplankton, and phosphate are positively correlated with families Serranidae, Lethrinidae, Lutjanidae, and Scaridae, particularly at stations 1 and 2. These results are consistent with the fish composition data, whereby the presence of the Napoleon fish coincides with the high abundance of Serranidae, making a unique interaction between them possible. The other families (Haemulidae, Labridae, Siganidae, Acanthuridae, and Caesiodae)are negatively correlated with pH, nitrate, and DO, especially at station 3.
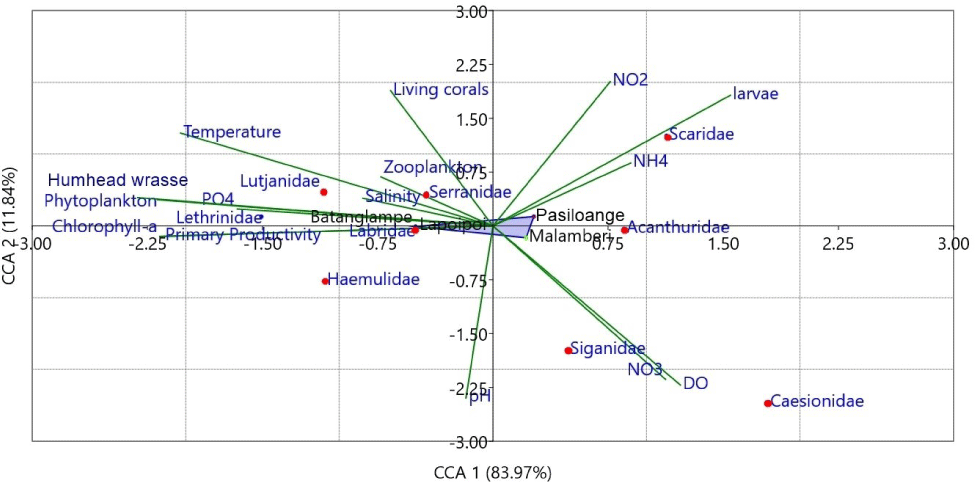
Overall, the influence of eco-environmental parameters on characterizing the composition of coral reef fish in every observed station varies considerably. The most influential parameters are living corals, nitrite, ammonia, larvae abundance, and temperature, with a frequency ranging from 0.8−2.0. As the habitat of coral reef fish, the percentage of coral covers plays a significant role in characterizing fish composition (Wisha et al., 2019). Nutrient availability also has a specific control over fish distribution relating to the feeding source (Zhang et al., 2017). Hence, the phytoplankton and zooplankton are given a positive frequency in the CCA results. In addition, pH does not solely control the fish composition in the study area.
Conclusion
Families Serranidae and Scaridae were the most dominant in the study area, and the presence of humphead wrasse aligns with the dominant composition of Serranidae. Coral reef conditions in all observation stations are ideal for supporting the life cycle within the ecosystem. The abundance of humphead wrasse coincides with the higher coral mortality and lower reef fish composition in the study area. The water quality, biotic components, and nutrients vary considerably in each observation station, which generally exceeds the allowed quality standard for marine biota. Based on the CWQI scoring assessment, all observation stations are categorized as good and excellent water quality. Based on statistical-based examination, it is found that the most correlated parameters are phytoplankton abundance, humphead wrasse, and temperature. Even though the coral reef fish adaptation over water quality parameters varies considerably, the most influential parameters are living corals, nitrite, ammonia, larvae abundance, and temperature.