

Introduction
Tilapia cultivation is an essential sector in fisheries that continues to grow to meet the community’s need for animal protein (Li et al., 2020; Taoka et al., 2024). However, one of the main challenges in intensive cultivation is maintaining water quality, with exceptionally stable dissolved oxygen levels (Ali et al., 2022). Low dissolved oxygen can cause stress, decreased appetite, stunted growth, and even mass mortality in fish (Fouda et al., 2023; Nghia et al., 2022). Therefore, efficient aeration technology is needed to support an optimal cultivation environment.
One innovation increasingly applied is the use of smaller bubble production tools, such as microbubbles, ultrafine bubbles, or nanobubbles. Various bubble generator designs have been proposed by researchers, such as the venturi (Deendarlianto et al., 2017), orifice (Juwana et al., 2019), swirl (Mawarni et al., 2023; Tabei et al., 2007), and porous pipe (Deendarlianto et al., 2017) technologies. Smaller bubble sizes offer several advantages over conventional bubbles, including longer residence time in the water, greater bubble surface area, and higher oxygen transfer efficiency (Catrawedarma et al., 2025a; Mawarni et al., 2023). This technology enables a faster, more stable increase in oxygen levels and supports the water-cleaning process by oxidising and decomposing organic matter (Heriyati et al., 2022).
The application of technology to form bubbles on a micro (Boyd & McNevin, 2021; Heriyati et al., 2022; Lim et al., 2021) and nano (Nghia et al., 2022; Sean et al., 2025; Subhan et al., 2022) scale in fish cultivation has been proven to increase growth, increase stocking density, and optimize feed efficiency (Fouda et al., 2023; Lim et al., 2021; Marques et al., 2023; Nghia et al., 2022; Salim et al., 2016; Sean et al., 2025). A comparison of microbubble and macrobubble aeration in vannamei shrimp cultivation found a decrease in pH and an increase in the conversion of total ammonia nitrogen (TAN) to nitrate (Lim et al., 2021). It shows that microbubble aeration improves water quality and increases vannamei shrimp growth by reducing the feed conversion ratio (FCR) for 70 days in biofloc cultivation.
Heriyati et al. (2022) reported that microbubble aeration was able to stabilize dissolved oxygen levels at 4.28 mg/L until the end of the experiment on the 50th day and reduce CO2 and ammonia content in red fish cultivation ponds with a recirculation system. In addition, fish biomass was higher with a lower FCR value. Taoka et al. (2024) studied the effect of ultra-fine bubbles on water quality in tilapia cultivation, which could improve water quality and change the microbiome for 36 days in a recirculation system cultivation. Sean et al. (2025) used a recirculation system for seawater cultivation. The recirculation system with nanobubbles increased the number of nitrifying bacteria, thereby enhancing the breakdown of nitrogen waste and reducing nitrite levels. However, there was no great difference in fish growth or feed conversion ratio, attributable to low stocking density and high water exchange rate. One nanobubble generator unit was used for 12 cultivation ponds.
Despite its advantages, the technology for forming micro- and nanobubbles has a primary drawback, namely, energy efficiency. Smaller bubbles tend to require more energy, so their application requires careful consideration of their effectiveness and economic value in increasing dissolved oxygen in the water. Most aquaculture systems use centralized micro- or nanobubble generators, which pose a drawback when a malfunction affects the entire pond. Using a split-bubble generator system is advantageous when a bubble generator malfunctions in an aquaculture pond, as it does not affect other ponds, since each pond uses a single bubble generator.
Modern recirculation cultivation systems enable water to circulate from the cultivation pond to the filter tank and back to the cultivation pond (Heriyati et al., 2022; Marques et al., 2023; Taoka et al., 2024). For this purpose, a pump circulates water, and an aerator supplies air to the cultivation pond via an airstone. It is wasteful because the pump is used solely to circulate water. Therefore, in this study, the pump’s energy is used to generate bubbles via an aerator-ejector bubble generator, replacing the need for an airstone. The water energy flowed from the pump through the ejector bubble generator, which contained a nozzle-jet-reducing cross-section. In front of the nozzle jet, an air supply from the aerator is provided, so that the output from the ejector-bubble generator is water and bubbles that are sprayed strongly due to the reduced cross-section. It can produce more bubbles and enable smaller bubbles to form due to flow turbulence (Catrawedarma et al., 2025a). Thus, the pump not only circulates water but also generates bubbles. Therefore, the effect of the air-bubble spray emitted from the nozzle requires further investigation by comparing water quality and tilapia growth rates using the aristone aeration system, the ejector, and the ejector-plate that blocks the air-bubble spray.
Materials and Methods
This research was conducted at the Aquaculture Technology workshop of Politeknik Negeri Banyuwangi, with a schematic diagram of the tool as shown in Fig. 1. This cultivation apparatus comprises a submersible water pump (5) that delivers pressurized water into the bubble generator (13), which is immersed in the pond (1) via the circulation pipe (11). Air from the air pump (15) is channelled to the bubble generator (13) via the air hose (14), producing bubbles as output. Dirt and wastewater from the pond (1) flow to the filter tank (10) through the drain hole (3) and drain pipe (4). Within the filter tank (10), a filter support (6) supports the plastic mesh filter (8) and the porous stone filter (7) as a biofiltration to serve as a breeding ground for bacteria. At the bottom of the filter tank (10), there is a knock-down water level (9) to remove dirt that settles there.
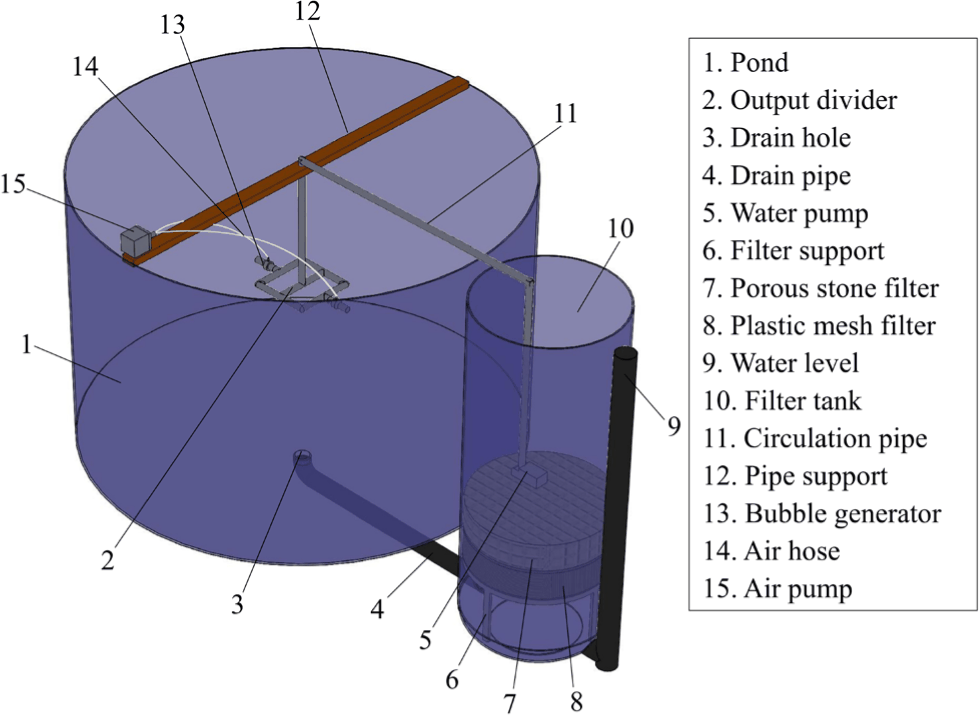
The research began by flowing water to a height of 0.85 m in a circular tarpaulin pool with a diameter of 1.5 m and a height of 1.0 m. Then, turning on the submerged water pump (Sunsun JTP 5800, Sensen Group, Zhoushan, Zhejiang, China) with a discharge of 5,800 L/hour to supply water into the bubble generator. It is submerged at a depth of 0.25 m below the water surface. The pumped water was filtered through fishing nets and perforated stones, placed in the filter tank. Next, the air pump (YAMANO ACO-003, Shenzhen Yamano Aquariums, Shenzhen City, China) with a discharge rate of 40 L/min was turned on to supply air to the bubble generator. It was generating bubbles that mixed with the water in the cultivation pond. The water and air pumps operate continuously for 24 hours to maintain uninterrupted water circulation.
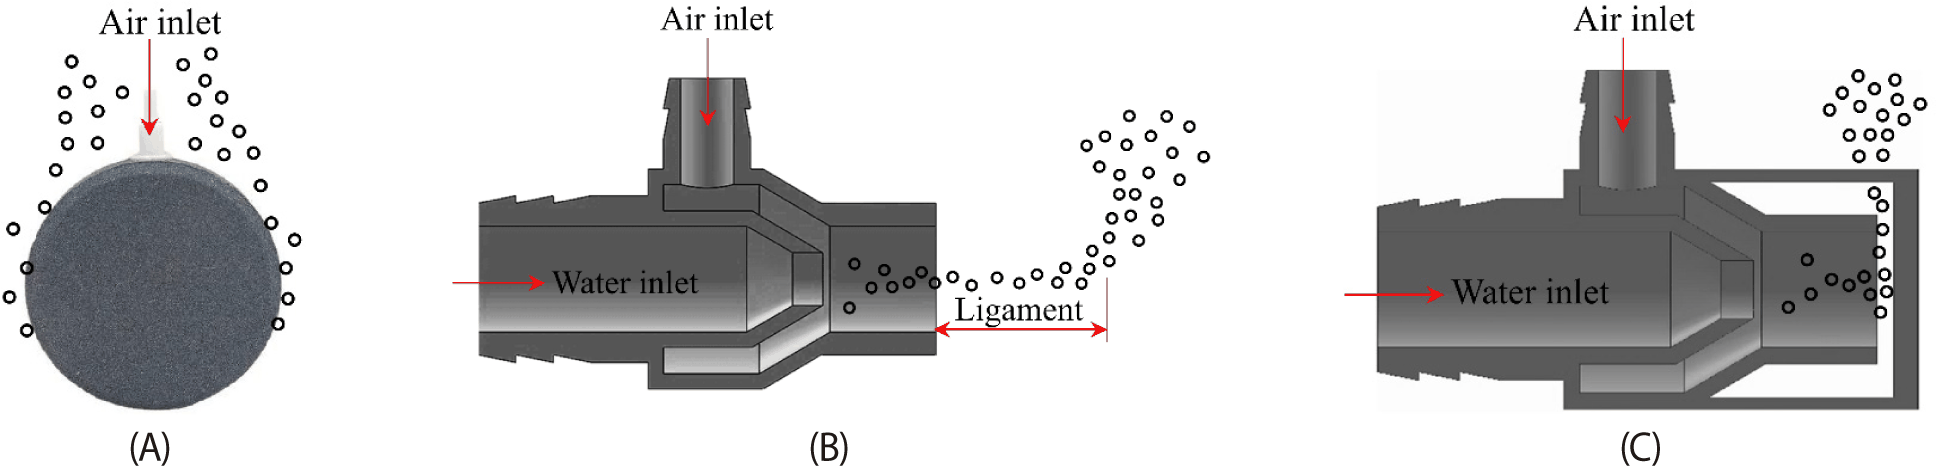
Furthermore, 200 tilapia seeds with an average initial weight of 1.2 ± 0.01 g and a length of 5 ± 0.01 cm were spread in each pond using different aeration methods, including airstone, ejector, and ejector-plate bubble generator, as shown in Fig. 2A–2C, respectively. To ensure the effectiveness of the aeration method, each treatment used only one pond. The water and air flow rates for all treatments were kept constant at the maximum discharge of the water and air pumps, ensuring the same electrical power consumption. The fish were fed twice daily Hi-Pro-Vite 781-1 (Charoen Pokphand Group, Huai Khwang, Bangkok, Thailand), a product with an average diameter of 2 mm and containing 31% protein, 5% fat, 8% fiber, 12% water, and 13% ash. This type of feed is feed that floats for about 2 hours, so it can be used as an indicator of uneaten feed. The daily feed dose was set at 5% of the fish’s body weight. It falls within the ideal range of 3%–6% (Lim et al., 2021f), so the feed dosage varied for each treatment. This dosage was increased weekly after the average fish weight was taken.
Fish weight and length measurements are conducted weekly by randomly sampling a minimum of 20 fish from each pond. Digital scales are used to measure fish weight, and millimetre paper is used to measure fish length. After being measured, the fish samples were returned to the pond. In addition, mean body weight (MBW), FCR, average daily wet gain (ADW), average daily length gain (ADL), weight gain percentage (WG%), and specific growth rate are calculated from fish weight and length by using equations 1–8. The survival rate was calculated on the last day of cultivation, namely the 90th day. During the cultivation period, the water in the pond was never replaced or drained. Water quality measurements, including temperature, salinity, pH, dissolved oxygen with calibrated 7.80 mg/L at atmosphere, and conductivity, are made using JALAtech sensors with accuracies of ± 1.5%, ± 0.2%, ± 0.1%, ± 0.5%, and ± 1.0%, respectively. Data on nitrite (NO2–), nitrate (NO3–), phosphate (PO43–), and also TAN were measured daily using commercial chemical reagent test kits (Table 1).
where ∑W is the total weight of fish (g), n = number of fish samples measured, MBWt = mean body weight at the end of cultivation (g), MBW0 = mean body weight at the beginning of cultivation (g), t = number of days of cultivation, Lt = average length at the end of cultivation (cm), L0 = average length at the beginning of cultivation (cm), ln = natural logarithmic, we = number of weeks of cultivation, Nt = number of fish at the end of cultivation (fish), N0 = number of fish at the beginning of cultivation (fish), F = total feed given during cultivation (g).
Results and Discussion
Fig. 3A shows the weekly weight growth of fish for various types of aeration fitted with an exponential curve. The general pattern shows a gentle increase during the first five weeks, followed by a sharp rise in the sixth week and thereafter. All aeration treatments exhibit a similar growth pattern until the sixth week. In the seventh week, the ejector-type began to differ markedly, whereas the airstone and ejector-plate types began to diverge in the eighth week. The ejector type shows the highest increase in fish weight, as indicated by the trend in the seventh to twelfth weeks.

Furthermore, the ejector-plate type has moderate performance, while the airstone has the lowest. The average weight of fish cultivated using the airstone, ejector, and ejector-plate types is 12.38 g, 13.35 g, and 13.18 g, respectively. Therefore, the average fish weight increased by 23.99% from the airstone type compared to the ejector type, and increased by 6.44% from the airstone type compared to the ejector-plate. When comparing the ejector plate with the ejector, there was an increase in the average fish weight of 16.46%.
The difference in fish weight gain is due to the size and distribution of bubbles supplied by each type of aeration (Ali et al., 2022; Heriyati et al., 2022). Bubble distribution in the airstone and ejector-plate types is limited to the centre of the pond because bubbles that exit immediately flow upward, resulting in increased water movement and hydrodynamic forces only there (Catrawedarma et al., 2021a, 2025a; Heriyati et al., 2022). On the other hand, ejector-type aeration can distribute bubbles up to the pond walls due to the presence of ligaments at the nozzle-jet outlet, as shown in Fig. 2B. The phenomenon of ligament formation in ejectors can be explained by defining the compression ratio as an indicator of ejector performance. The compression ratio is the ratio of delivery pressure to suction pressure (Koirala et al., 2021). At the same entrained flow rate, the compression ratio of the ejector is higher than that of the ejector-plate (Catrawedarma et al., 2025b). It indicates that the ejector’s pressure drop is lower, resulting in greater flow energy, which allows for ligament formation and water movement around the pool. This condition can reduce bubble size due to collisions between bubbles exiting the ejector and the pond walls. This phenomenon can also more effectively move water in the pond, thereby increasing hydrodynamic forces. This force induces friction between the two phases of water and air, causing collisions between bubbles and ultimately breaking them into smaller bubbles (Mawarni et al., 2023; Shen & Hibiki, 2018). The smaller the bubble size, the greater the surface tension, resulting in a lower bubble rising velocity, resulting in a longer bubble residence time in the water, which causes a larger surface area of contact between the two phases of air and water, resulting in higher dissolved oxygen, which ultimately increases fish metabolism and accelerates fish growth (Catrawedarma et al., 2025a, 2025b; Juwana et al., 2019).
Based on the characterization, the ejector-plate type produces the smallest bubble size, while the airstone type produces the largest, as reported by (Catrawedarma et al., 2025a, 2025b; Sari et al., 2024). On the other hand, the ejector offers the most efficient increase in fish weight, owing to the size and uniform distribution of bubbles throughout the pond. Differences in bubble distribution result in variations in dissolved oxygen concentrations. The further away from the bubble generator, the lower the dissolved oxygen (Juwana et al., 2019; Mawarni et al., 2023).
Fig. 3B shows the average length development of fish over 12 weeks for three aeration treatments. Each treatment is displayed in data points and a trendline to indicate the trend of length changes. The growth pattern of fish in the ejector aeration type shows the fastest and highest length growth. Beginning in the sixth week, length growth increased markedly and continued through the twelfth week, reaching 26.5 cm. The trendline is an exponential curve indicating an increasingly rapid increase in length over time. The length growth of fish in the airstone type was dense at a moderate level; the average length increased steadily and tended to be linear. Until the twelfth week, the average length was less than 15 cm. The lowest length growth rate was observed in the ejector-plate aeration type, with an average length consistently below that of the airstone type, at 12–13 cm at the twelfth week.
Among the three types of aeration, the ejector type offers substantial advantages for fish growth. Its high dissolved oxygen concentration indicates this, as bubbles collide with the pond walls, reducing their diameter. It has a longer contact time with the water, thereby increasing the dissolved oxygen concentration. In addition, the resulting aeration distribution is more effective due to bubble bursts emanating from the nozzle-jet, so that bubbles are not concentrated at the centre of the pond, as in the airstone and ejector-plate types. The stronger water movement in the pond with ejector-type aeration also contributes to fish growth. Water movement also stimulates fish to move against or with the water flow. Fish that move frequently tend to grow longer (Abdel-Tawwab et al., 2019; Arslan et al., 2025; Mallya, 2007). The lowest water movement occurs with ejector-plate aeration because the water jet exiting the nozzle is impeded by the upstream plate, thereby reducing the energy required to move water in the pond.
Fish growth parameters are presented in Table 2. The ejector type has the highest specific growth rate of 3.11%/day, followed by the ejector-plate and the airstone at 2.88%/day and 2.83%/day, respectively. The ejector-plate survival rate is highest, followed by the ejector and airstone at 95.69%, 94.79%, and 91.00%, respectively. Fish deaths most often occur during the first 10 days of cultivation, coinciding with the onset of adaptation to the new environment. The lowest FCR is achieved by the ejector type at 0.15, indicating that feed is used more efficiently to increase the growth rate of fish. A higher FCR indicates wasteful feed, meaning a lot of feed but little growth (Colt & Schuur, 2021; Taoka et al., 2024).
Fig. 4 shows daily temperatures across all aeration types, with no discernible variations. Environmental factors greatly influence the temperature of water. Its range is 27°C–30°C, with substantial daily fluctuations. Visually, the ejector-type aeration system shows a more stable temperature range of 28.6°C to 28.8°C, whereas the airstone-type system shows a higher temperature. The average temperatures for the airstone, ejector, and ejector-plate aeration systems are 28.67°C ± 0.42°C, 28.61°C ± 0.45°C, and 28.65°C ± 0.40°C, respectively. These temperature differences are caused by water movement within the pond and external factors such as weather. Water movement is stronger and more uniform in the ejector-type due to air-bubble jets from the nozzles. This water movement provides a more uniform temperature distribution, resulting in lower temperatures.
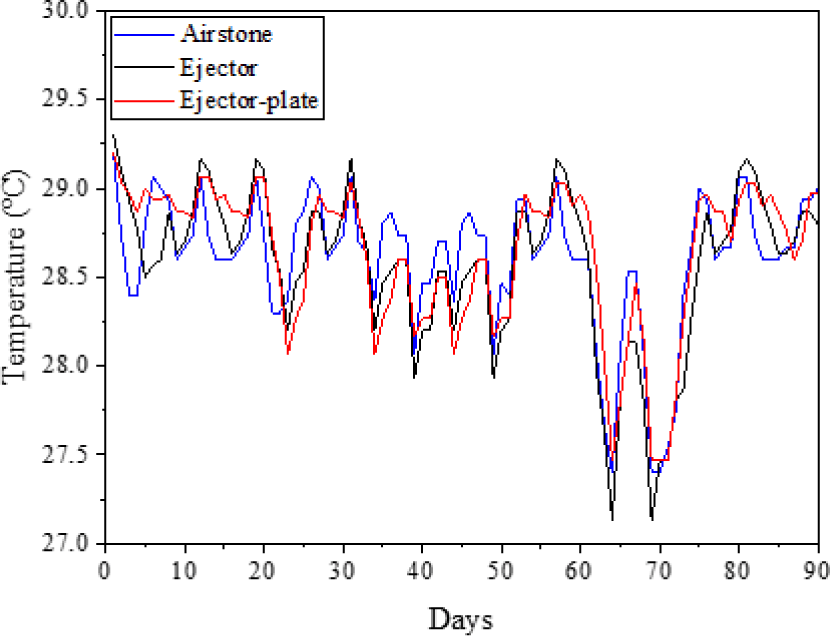
Fig. 5 shows the effect of aeration type on daily dissolved oxygen levels. Overall, dissolved oxygen varies greatly every day. All aeration types exhibit similar patterns, but with varying amplitudes and stability levels. At the beginning of cultivation, dissolved oxygen in the pond increased sharply due to bubble injection from the bubble generator; this increase persisted until the seventh day. It indicates an initial response to aeration. Subsequently, dissolved oxygen (DO) reached DO% saturation due to the continuous injection of large volumes of bubbles. This trend is similar to that reported in (Boyd, 2017). Airstone aeration has the weakest oxygenation. This system is unable to maintain consistently high dissolved oxygen levels from day to day. The ejector aeration curve has the highest dissolved oxygen levels almost every day. The ejector aeration method is the most effective for increasing daily dissolved oxygen. Oxidation levels and turbulence enhance oxygen uptake by the water due to the air-bubble spray from the nozzle. Ejector-plate aeration is in the middle position and can produce a higher dissolved oxygen concentration than airstone aeration. This method is suitable for systems that require a stable dissolved oxygen level with minimal fluctuations. The average dissolved oxygen value of the three aerations was 17.35 ± 2.853 mg/L for airstone, 18.19 ± 2.643 mg/L for ejector, and 18.01 ± 2.709 mg/L for ejector-plate. This condition falls into the very high category, with a temperature range of 28°C–29°C. Several factors influencing the DO measurement results include the time of day, at 10:00 a.m. The outdoor location of the pond means it is exposed to very intense sunlight, which allows for photosynthesis and results in abundant phytoplankton/algae growth. During photosynthesis, algae release oxygen into the water, increasing its oxygen content. This oxygen from photosynthesis accumulates because it is produced faster than it evaporates into the air during the day.
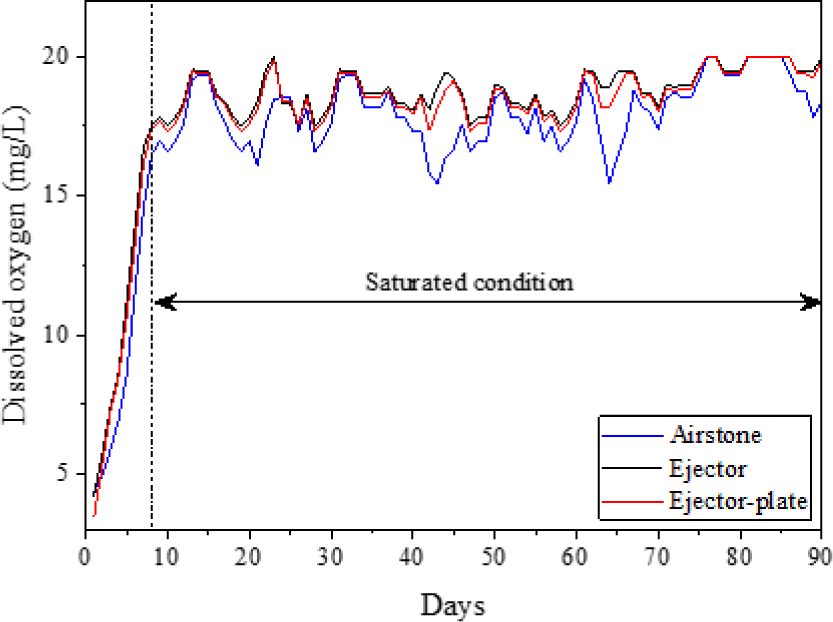
The difference in dissolved oxygen values was attributable to bubble size (Temesgen et al., 2017; Wu et al., 2019). The airstone produced the most enormous bubbles at low pressure, resulting in a slower increase in dissolved oxygen. Furthermore, the velocity of the two-phase air-bubble flow exiting the ejector is higher due to the reduced cross-sectional area and increased shear stress. It facilitates bubble fragmentation into smaller sizes and ultimately increases the contact area between the water and the bubbles, thereby increasing dissolved oxygen (Catrawedarma et al., 2021b, 2025a; Sari et al., 2024). The ejector type generates high-flow turbulence due to ligaments protruding from the nozzle. Turbulence increases hydrodynamic forces in the surrounding water, thereby disrupting the surface tension of the bubbles, which ultimately break into smaller bubbles (Catrawedarma et al., 2021a, 2021c, 2022, 2025a, 2025b).
Fig. 6 shows the daily pH changes for the three aeration types. At the beginning of cultivation, pH tends to rise sharply, which mimics dissolved oxygen levels. It is caused by algal blooms in outdoor cultivation, which reduce CO2 and increase O2 during photosynthesis. The airstone type typically has the lowest pH, with large and unstable fluctuations, and the pH peak rarely exceeds that of the ejector type. It is because airstone is the weakest type of aeration, so it doesn’t release much CO2 to raise the pH. The ejector type has an intermediate pH among the three types, with smoother fluctuations than the airstone type and a more stable curve. This type produces more vigorous aeration, leading to greater CO2 release. It can cause a more pronounced and more stable increase in pH. The ejector-plate type has the highest pH, with large fluctuations, but consistently maintains a high pH, with a peak well above those of the other types. This condition indicates that the ejector-plate type is most effective at removing CO2 from water, as evidenced by the greatest improvement in pH. This type induces strong CO2 degassing, thereby increasing water’s alkalinity (El-Leithy et al., 2019). The average pH values for the airstone, ejector, and ejector-plate types were 9.04 ± 0.466, 9.17 ± 0.495, and 9.21 ± 0.517, respectively. This value is still within the tolerance limits for freshwater fish life but has implications for slower growth and detrimental reproductive effects (Mustapha & Atolagbe, 2018). In outdoor aquaculture ponds, CO2 degassing is strongly influenced by rainfall and algae photosynthesis. Photosynthesis absorbs CO2, reducing carbonic acid levels and increasing pH. Algae form in ponds due to direct contact between the water and sunlight, and increased nutrient uptake from fish waste. Fish waste increases with higher metabolic activity, which in turn increases with dissolved oxygen.
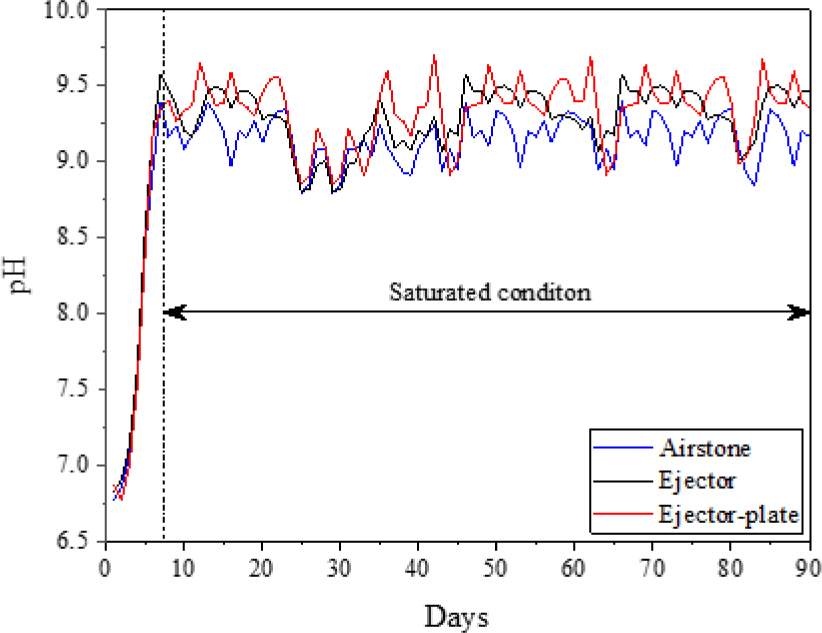
When photosynthesis occurs, CO2 will be absorbed maximally and the concentration of dissolved CO2 in the water to decrease, thus shifting the carbonate equilibrium. HCO3– turns into CO2 to replace the lost, and H+ ions are reduced, ultimately increasing pH and dissolved oxygen. It has an impact on sublethal stress, which includes impaired osmoregulation because the gills work harder and disrupt the ion balance, and increased ammonia toxicity due to the increasing number of NH3 fractions when the pH is higher (Boyd, 2017; Boyd et al., 2020). In addition, there is an increase in metabolic energy requirements in fish due to efforts to balance blood pH, so that energy for growth is reduced. This increase in pH is an indication of low alkalinity; if alkalinity is sufficient, then the pH spike during the day can be suppressed and stabilize the carbonate system and reduce extreme fluctuations.
Fig. 7 shows the salinity changes over 90 days for the three aeration types. The salinity range was 0.08–0.17 mg/L, with no discernible trend. The airstone-type aeration had the highest salinity values on most days, ranging from 0.12 to 0.16 mg/L, with an average of 0.10 ± 0.016 mg/L. The salinity peaks were also larger and exhibited sharper fluctuations than those under the other aeration types. It is also influenced by water’s weak hydrodynamics, which results in stronger bonds between water molecules and higher salinity.
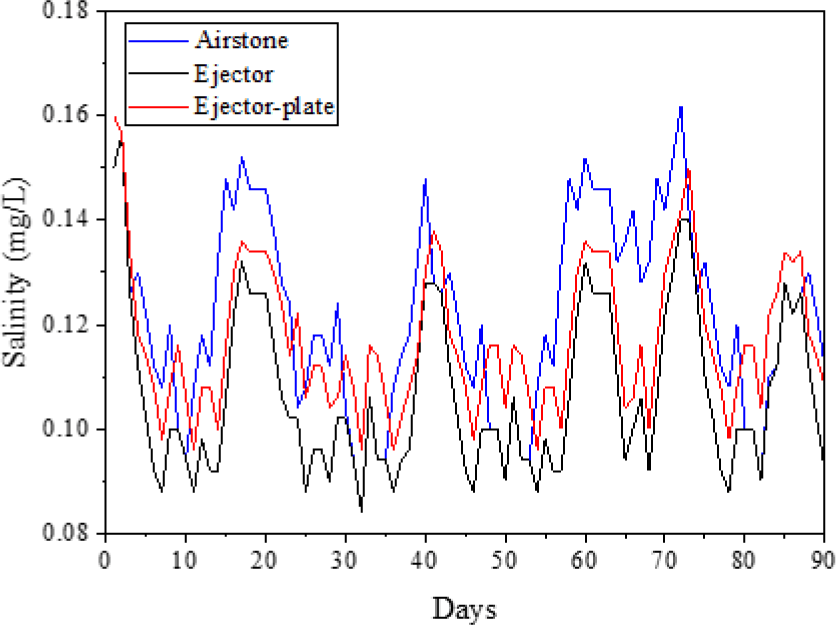
Furthermore, this type produces large, buoyant bubbles that drag water to the surface and rupture, increasing the opportunity for evaporation, reducing water volume, and increasing salinity. Furthermore, evaporation is greatly accelerated by higher water temperatures, as shown in Fig. 4. The ejector type had low salinity, with values typically between 0.09 and 0.13 mg/L (mean ± SD, 0.12 ± 0.018 mg/L), and exhibited smoother fluctuations than the airstone type. It indicates that the ejector type can release water molecules due to the strong hydrodynamic force from the jet nozzle, thereby diluting the water and evenly distributing salinity. The ejector-plate type falls between the other two types and is more stable than the ejector but not as low as the airstone. The range is between 0.11–0.14 mg/L with an average value of 0.11 ± 0.14 mg/L. It indicates that the system provides a moderate mixing effect and does not increase salinity to the extent of the ejector type. The overall pattern shows peaks that recur every ± 10 days, while deep salinity valleys are observed in the same period across all three aeration types. It indicates that natural phenomena such as rain, which can dilute water and thereby reduce salinity, and evaporation are involved (El-Leithy et al., 2019). It can increase salt concentration, thereby increasing salinity, and is consistent.
Fig. 8 shows the daily changes in water conductivity over 90 days of cultivation under various aeration conditions. Conductivity describes the amount of dissolved ions in water, such as salinity, minerals, and ionized organic waste (Li & Liu, 2019). The type of aeration can affect conductivity through uniform mixing, CO2 degassing, compound oxidation, ion release, and temperature changes (Taoka et al., 2024). The airstone aeration type has the highest conductivity, indicating the presence of many minerals in the water. These minerals can originate from undecomposed waste feed or other organic activities. The airstone type produces large bubbles with high buoyancy, which burst on the surface. This condition causes low dissolved oxygen levels, reducing the effectiveness of waste feed and waste decomposition. The amplitude of conductivity fluctuations in the ejector type is smaller than in the airstone type, with the presence of ligaments when bubbles exit the ejector. Turbulence increases, leading to more uniform mixing and smaller bubbles formed through interference from hydrodynamic forces and bubble collisions. The smaller bubble size increases dissolved oxygen, aiding in the decomposition of waste feed and waste.
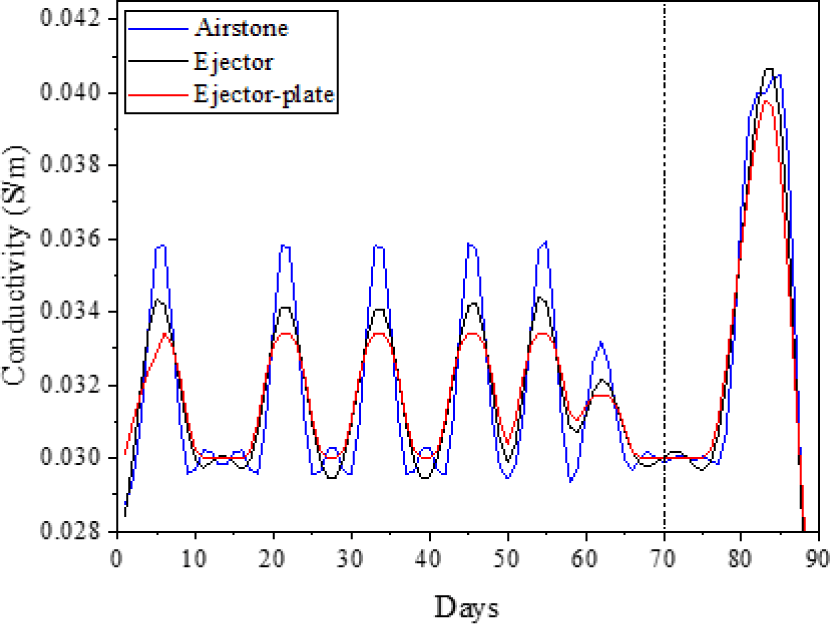
Meanwhile, the ejector-plate type produces smaller bubbles than the ejector type because of the presence of a barrier plate that reduces the energy of the two-phase flow of water-bubbles in the pond, so that mixing in the water is less even, which has implications for the decomposition of leftover feed and dirt being less practical, resulting in lower conductivity. Water conductivity increased sharply after the 70th day across all aeration types due to increased feeding, leading to mineral accumulation in the water. A sudden increase or decrease in conductivity indicates pollution from the addition of chloride, phosphate, and nitrate (Li & Liu, 2019). The average conductivity of each kind of aeration was 0.03 ± 0.004 S/m, the ejector type was 0.03 ± 0.003 S/m, and the ejector-plate type was 0.03 ± 0.003 mg/L.
Fig. 9 shows the relationship between NO3– and aeration type during 90 days of cultivation. In the initial cultivation phase, the airstone type showed a rapid upward trend, followed by a decrease. Subsequently, the NO3– concentration was relatively stable during the middle phase from the 35th day to the 70th day, and increased again in the final phase. It indicates that nitrification to nitrate proceeded normally, as denitrifying bacteria functioned effectively due to moderate turbulence. Notable increases in the ejector and ejector-plate types were noted after the initial phase, specifically on the 35th day. It is due to vigorous mixing and high oxygen distribution, which accelerates the conversion of nitrite to nitrate. In addition, vigorous mixing can disperse nitrogen-rich sediments in the water, thereby accelerating nitrate formation. The average NO3– for the airstone was 21.19 ± 15.749 mg/L, the ejector was 31.38 ± 15.213 mg/L, and the ejector-plate was 33.68 ± 15.359 mg/L.
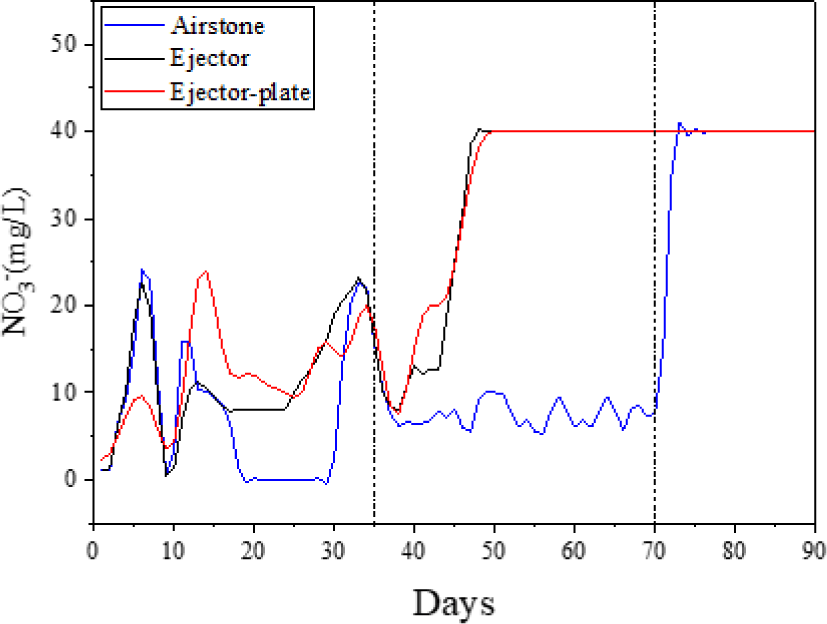
Fig. 10 displays daily NO2– changes across various aeration types. All aeration types exhibit similar curve trends, but there are substantial differences in the initial phase. In this initial phase, the ejector-plate type exhibits the most substantial increase in nitrite. It facilitates accelerated ammonia oxidation by promoting the formation of smaller bubbles, thereby increasing the contact area. The middle phase shows that all three curves exhibit low oscillations with relatively minor differences. It indicates that once the water is evenly mixed, the type of aeration has no substantial effect on NO2– fluctuations. Once the system stabilises, nitrite production is driven by nitrifying microbes. In the final phase, all aeration types exhibit a substantial spike in NO2–. It is strongly influenced by increased feeding as fish weight increases, resulting in greater organic waste from fish metabolism and, ultimately, higher ammonia production (Abdel-Tawwab et al., 2019; Mallya, 2007). Furthermore, this is attributable to the increasing organic load from the initial to the final phase, as there is no water change for the 90th day of cultivation. The average NO2– values were 1.82 ± 1.561 mg/L for airstone, 2.05 ± 1.565 mg/L for ejector, and 2.42 ± 1.702 mg/L for ejector-plate.
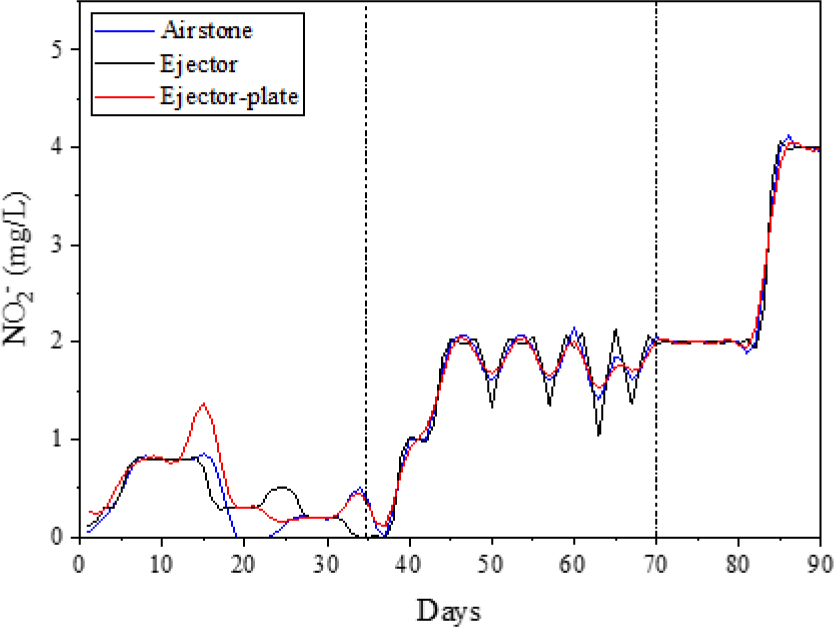
Fig. 11 shows the effect of aeration type on phosphate (PO43–). The airstone type has the lowest phosphate (PO43–). It tends to be the most stable due to low turbulence, which results in better phosphate sedimentation and more stable phosphate absorption by bacteria and algae. The airstone type has the lowest dissolved oxygen and phosphate (PO43–) concentrations, resulting in a more dominant algal population that absorbs phosphate (PO43–) as a photosynthetic nutrient. The ejector type exhibits pronounced fluctuations due to high turbulence, which disrupts phosphate (PO43–) release from the sediment and degrades the bacterial biofilm that utilizes phosphate. The ejector-plate type is relatively stable at the highest phosphate (PO43–) value because the bubbles that emerge are large, which can accelerate organic decomposition and thereby release phosphate (PO43–). The average phosphate (PO43–) for airstone is 2.58 ± 1.187 mg/L, ejector 3.26 ± 0.796 mg/L, and ejector-plate 3.36 ± 0.593 mg/L.
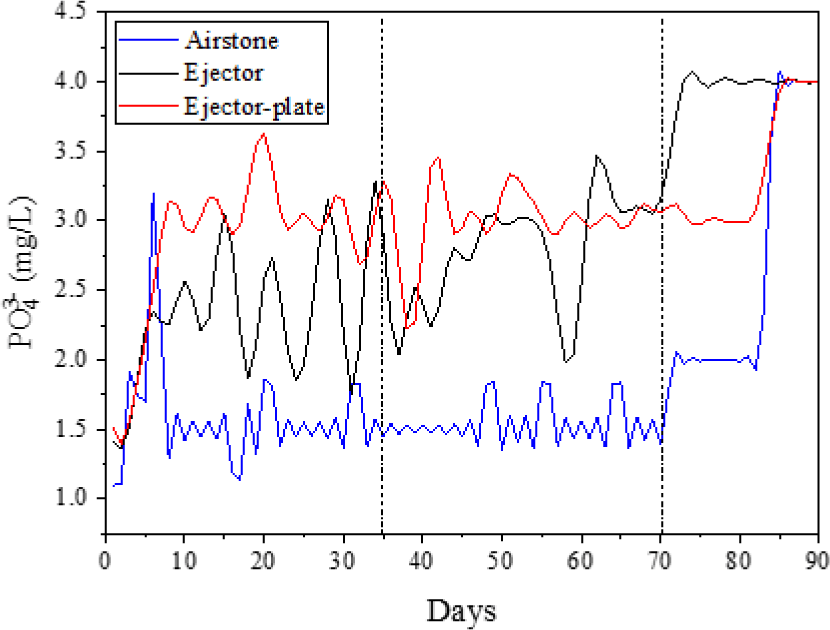
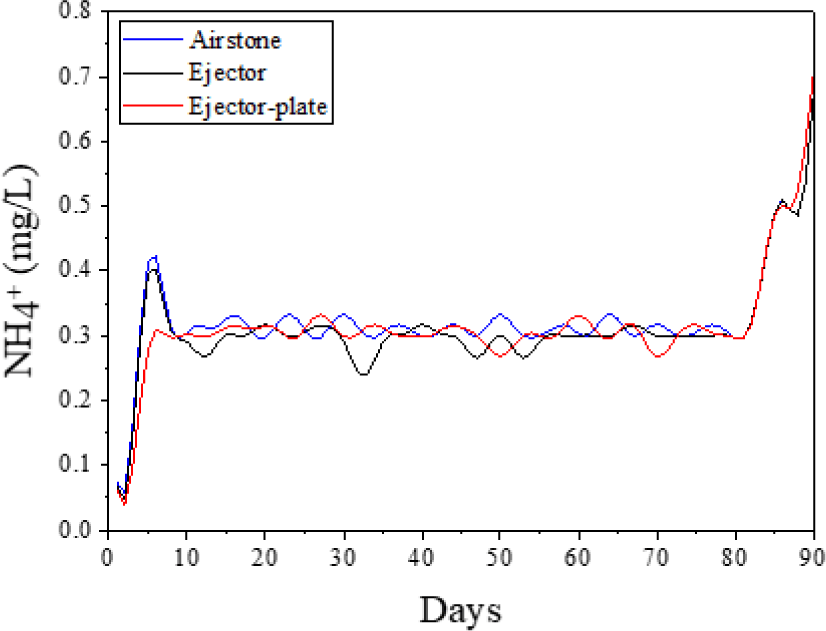
Fig. 12 shows the effect of aeration type on daily TAN levels, including NH3 and NH4+, respectively the unionized and ionized ammonia fractions; all aeration types produced nearly identical TAN values. Differences were apparent at the beginning and end of the phase, with the airstone’s ammonia slightly higher than the ejector and ejector-plate types. Under stable conditions from day 10 to day 80, all three aeration types reduced TAN by increasing dissolved oxygen, which nitrifying bacteria use to convert TAN into NO2– and NO3–. From day 80 to day 90, TAN increased across all aeration types. The ejector type generated the strongest turbulence, stirring the sediment and releasing bound ammonia from the pond bottom, disrupting the nitrifying bacterial biofilm, thereby reducing nitrification efficiency and increasing anaerobic bacterial decomposition, resulting in greater TAN release. The airstone and ejector-plate types produced sufficient oxygenation without greatly disturbing the sediment, thereby supporting stable nitrification and preventing TAN release. The average TAN for airstones was 0.43 ± 0.235 mg/L, ejector 0.50 ± 0.298 mg/L, and ejector-plate 0.46 ± 0.236 mg/L. The average values indicate that airstones had the lowest dissolved oxygen and TAN. It was due to the lowest feeding rate, which led to the lowest weight growth rate and, consequently, low fish metabolism, which in turn led to low TAN production. The increase in NO2– and TAN concentrations in the final stage indicates physiological implications for fish. Increased NO2– can disrupt oxygen flow due to methemoglobin formation. On the other hand, at pH = 9, the increase in the NH3 fraction of TAN indicates a potential risk of ammonia toxicity and physiological stress (Boyd, 2017).
Conclusion
Research on the effects of airstone, ejector, and ejector-plate aeration on fish growth rate and water quality was conducted over 90 days of fish cultivation in a recirculation pond. The results showed that the average fish weight was 23.99% higher with the ejector type than with the airstone aeration type, and 6.44% higher with the airstone type than with the ejector-plate type. When comparing the ejector-plate with the ejector, there was an average increase in fish weight of 16.46%. The ejector type had the highest specific growth rate of 3.11%/day, followed by the ejector-plate and airstone at 2.88%/day and 2.83%/day, respectively. The formation of ligaments in ejector-type aeration provides turbulence and mixing of the pond water, thereby increasing dissolved oxygen levels. Water movement also provides a more uniform temperature distribution, resulting in lower temperatures. In addition, bubble flow turbulence and buoyancy contribute to CO2 degassing, thereby increasing the water’s pH. Flow turbulence also dilutes the water, reducing salinity. Turbulence also stirs up sediment from the pond bottom, rising concentrations of NO2–, NO3–, PO43–, and TAN. A water change is recommended on the 70th day due to sudden increases and decreases in conductivity.

