Background
The Pacific white shrimp, Litopenaeus vannamei (Boone, 1931), one of the most important farming shrimp species in the last decade, occupies a vital position in aquaculture industry. However, basic nutritional data such as protein requirement, P/E ratio, vitamins, and minerals in diets for the shrimp have not been fully established. The nutritional study in shrimp is generally complicated by the difficulties associated with making water-stable experimental diet. Crustaceans including shrimp shred their food particles prior to ingestion, which leads to rapid leaching and thereby makes their food consumption measurements very difficult Wilson 2002.
Cultured shrimp is supposed to get essential amino acids through the feeds because they cannot synthesize all the amino acids (National Research Council 2011). A minimum dietary protein level is required to supply adequate amino acids for normal maintenance of metabolism and physiology in aquatic animals. Generally, low levels of dietary protein lead to rapid growth reduction and weight loss because animals withdraw the necessary protein from their tissues to maintain vital physiological functions. On the other hand, high levels of dietary protein can lead an increment of feed costs and nitrogen excretion into the water because animals only use portions of protein for their body building block and the remaining portion is converted into energy which can be easily obtained from cheap carbohydrates or lipids (Zhou et al. 2007). The dietary protein contents can significantly affect the water quality via nitrogen excretion. In the case of shrimp culture system, most of nitrogen input into the water column is generated by feeds and is not converted to shrimp tissues.
The optimal dietary protein requirement of L. vannamei has been reported from 20 to 45% depending on the shrimp size, water conditions, and dietary characteristics such as, protein quality, energy content, and palatability (Velasco et al. 2000; Martinez-Cordova et al. 2003; Perez-Velazquez et al. 2007; Venero et al. 2008; Jatobá et al. 2014; Shahkar et al. 2014; Sui et al. 2015; Yun et al. 2015; Yun et al. 2016). Most of the previous studies have used practical diets for the requirement of protein in shrimp. This study, therefore, was conducted to determine the optimal protein requirements of Pacific white shrimp in three different growth stages following exposure to a semi-purified diet.
Materials and methods
Formulation and proximate compositions of the experimental diets for trials 1, 2, and 3 are shown in Table 1. Six semi-purified diets were formulated to contain crude protein levels of 25, 30, 35, 40, 45, and 50% (designated as P25, P30, P35, P40, P45, and P50, respectively) by increasing casein and gelatin at the expense of starch. All dry materials were thoroughly mixed (NVM-16, Gyeonggido, South Korea) and pelleted through a pellet machine (SP-50; Gumgang Engineering, Daegu, South Korea) after addition of fish oil and distilled water. The pelleted diets were dried at 25 °C for 24 h, crushed into desirable particle sizes, and stored at − 24 °C until used.
1Suhyup Feed Co. Ltd., South Korea (crude protein: 73.1%, crude lipid: 6.60%)
2Sigma Chemicals, Gelatin
3Casein was purchased from USB Co. Ltd., Cleveland, OH, USA
4Vitamin/mineral premix (g kg−1of mixture): retinol, 3.0; cholecalciferol, 1.0; ascorbic acid, 20.0; tocopherol, 20.0; menadione, 2.0; thiamine, 4.0; riboflavin, 6.0; pyridoxine, 5.0; cobalamin, 6.0; inositol, 54.0; panththenic acid, 12.0; biotin, 0.2; niacin amide, 40.0; folic acid, 2.0; Ferriccitrate, 10.0; Cu, 1.0; Zn, 30; Mn, 2.0; Co, 10.; I, 1.0; K, 6.0; Se, 0.01
The three feeding trials were conducted in an indoor shrimp culture facility at the Institute of Marine Sciences of Jeju National University (Jeju, South Korea). Three different size groups of L. vannamei were obtained from NeoEnBiz shrimp farm (Dangjin, South Korea) and were acclimated for 2 weeks each during which the shrimp were fed a proper commercial diet (SAJO DongA One, Seoul, South Korea).
In the first feeding trial (trial 1, 0.65 g size shrimp), the shrimp were randomly distributed into 18 acryl aquaria of 92 L capacity at a density of 18 shrimp per aquarium with aeration to maintain enough dissolved oxygen. Triplicate groups of shrimp were hand-fed with one of the diets four times a day at 08:30, 13:00, 17:30, and 20:00 h for 36 days. The daily feeding rates were slowly reduced from 15 to 6% of wet body weight during 36 days of the feeding trial.
In the second feeding trial (trial 2, 4.80 g size shrimp), the shrimp were randomly distributed into 18 acryl aquaria of 92 L capacity at a density of 12 shrimp per aquarium with enough aeration. The feeding protocol was the same to the trial 1, but the feeding rate was slightly reduced from 10 to 4% of biomass during 42 days of the feeding trial.
In the third feeding trial (trial 3, 10.5 g size shrimp), the shrimp were randomly stocked into 18 acryl aquaria of 216 L capacity at a density of 11 shrimp per aquarium with enough aeration. The feeding protocol was the same to the trial 1, but the feeding rate was 5% of the biomass during 48 days of the feeding trial.
Three feeding trials were conducted in the same way except for the duration, shrimp size, and respective feeding rates. The culture water was changed every 3 days, and the aquaria were cleaned with a sponge to prevent the growth of microflora. Fluorescent lighting was maintained for 12 h light/dark cycle. The water temperature was 28 ± 2 °C, pH was 7.5 ± 0.2, salinity was 30 g L−1, and dissolved oxygen was above 7.0 mg L−1. Total ammonia nitrogen and nitrite were kept < 0.1 and 0.005 mg L− 1, respectively, during the three feeding trials. Shrimp growth was measured every 2 weeks. Feeding was stopped 18 h prior to weighing to minimize handling stress on the shrimp.
At the end of each feeding trial, all the shrimp in each tank were counted and individually weighed for calculation of weight gain (WG), daily body increase (DBI), feed conversion ratio (FCR), protein efficiency ratio (PER), and survival. After weighing, three medium sizes of shrimp were selected from each tank (nine shrimp per dietary treatment) for whole-body analysis in trials 1 and 3. Analyses of moisture and ash contents of the experimental diets and whole-body samples were performed by the standard procedures (AOAC 2005). Crude protein was measured by using an automatic Kjeltec Analyzer Unit 2300 (Foss Tecator, Höganäs, Sweden), and crude lipid was analyzed by Folch et al. (1957).
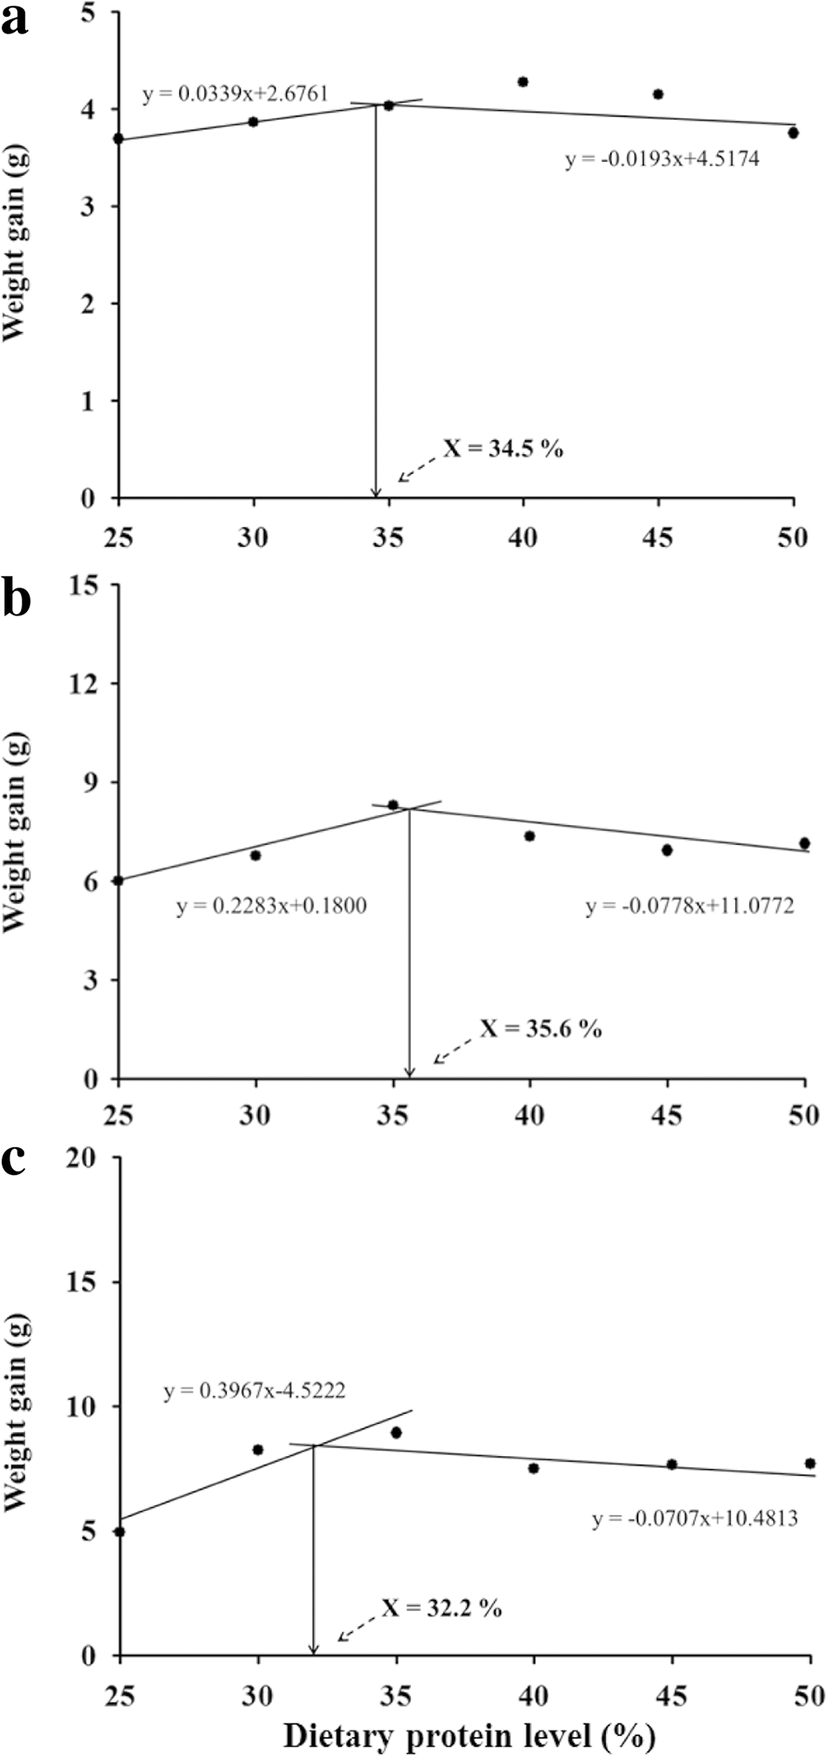
All diets were assigned by a completely randomized design. Data were analyzed one-way analysis of variance (ANOVA) in SPSS version 18.0 (SPSS Inc., Chicago, IL, USA). When ANOVA identified differences among groups, the difference in means was compared with Duncan’s multiple range tests. Statistical significance was determined at P < 0.05. Weight gain results were fitted to broken line models for the estimation of optimal dietary protein level (Fig. 1). Data are presented as mean ± SD. Percentage data were arcsine transformed before analysis.
Results
The results of growth performance, feed utilization, and survival are shown in Table 2. The average survival was 86.9, 85.2, and 86.9% for trials 1, 2, and 3, respectively. In trial 1, the growth performance was not affected by the dietary protein levels. However, PER was significantly higher in shrimp fed P30 diet compared to those fed P40, P45, and P50 diets. In trial 2, significantly higher growth rate was observed in shrimp fed P35 diet compared to shrimp fed P25 diet. FCR was significantly lower in shrimp fed P35 and P40 diets than that in shrimp exposed to P25 diet. Shrimp exposed to P25, P30, and P35 diets showed significantly higher PER compared to those fed P45 and P50 diets. In trial 3, P25 diet resulted in significantly lower growth rate than other experimental diets. FCR was significantly higher in shrimp fed P25 diet than other experimental diets. PER was significantly higher in shrimp fed P30 diet compared to that of shrimp fed P25, P40, P45, and P50 diets.
Values are mean of triplicate groups and presented as mean ± S.D. Values with different superscript letters in the same row are significantly different (P < 0.05). The lack of superscript letter indicates no significant differences among treatments
1FBW final body weight (g)
2Weight gain (%) = [(final mean body weight − initial mean body weight)/initial mean body weight] × 100
3Daily body increase (g/day) = (final body weight − initial body weight)/days
4Feed conversion ratio = dry feed fed (g)/wet weight gain (g)
5Protein efficiency ratio = wet weight gain/total protein given
6Survival (%)
As shown in Table 3, significantly higher moisture content was observed in P25 group than in other groups in trial 1. In trial 3, moisture was significantly higher in P25 and P50 than in P30, P40, and P45 groups. Whole-body protein was significantly lower in P25 group than that in other groups.
Values are mean of triplicate groups and presented as mean ± S.D. Values with different superscript letters in the same row are significantly different (P < 0.05). The lack of superscript letter indicates no significant differences among treatments
Broken line analysis of growth data indicates that the optimal levels of crude protein would be 34.5, 35.6, and 32.2% in diets for small, medium, and large (juvenile, sub-adult, and adult stages) shrimp, respectively.
Discussion
Growth and feed utilization of aquatic animals fed purified diets are normally lower than those of the animals exposed to practical diets (Kim et al. 1991). Nonetheless, the use of purified diets is inevitable for the study of nutrient requirements. In the present study, fish meal as an attractant and gelatin and casein as purified ingredients were used as the main protein sources. The semi-purified experimental diets were readily accepted by the shrimp during the whole feeding trials. The growth of the shrimp was equal to or better than that reported for similar-sized L. vannamei exposed to formulated diets in which no purified ingredients are used. Smith et al. (1985) conducted three feeding trials with similar-sized groups of L. vannamei and found 0.21, 0.15, and 0.10 g body increase per day for 4.0, 9.8, and 20.8 g sized groups, respectively. Rosas et al. (2001) reported daily body increase of 0.04 and 0.13 g for 0.3 and 1.5 g sized groups of L. vannamei, respectively. Xia et al. (2010) also reported a daily body increase of approximately 0.10 g in 6.2 g sized L. vannamei. These previous studies (Smith et al. 1985; Rosas et al. 2001; Xia et al. 2010) had used all practical diets for the feeding trials. In the present study, higher growth was observed as calculated as daily body increase of 0.11, 0.17, and 0.15 for 0.65, 4.81, and 10.5 g sized groups of L. vannamei, although semi-purified diets were used. Therefore, the semi-purified diet in the present study seems to be formulated nutritionally well balanced to support optimal growth of juvenile, sub-adult, and adult sized of L. vannamei.
Generally, practical experimental diets have been used in most protein requirement studies for Penaeid shrimps. Most previous studies had used practical ingredients, i.e., fish meal and soybean meal as the main protein sources to increase or decrease the crude protein levels in the practical experimental diets. When fish meal is used as the main protein source to gradually increase the crude protein in diets for protein requirement study (Xia et al. 2010; Yun et al. 2016), the result might be over-estimated because of unknown growth factors in fish meal. On the other hand, when soybean meal (Kureshy and Davis 2002) is used as the main protein source, the result might be under-estimated because of its anti-nutritional factors. In this regard, the present result could be very significant in providing protein requirement data for Penaeid shrimp by using semi-purified experimental diets.
The recommended dietary protein levels from previous studies vary from 30 to 57% for Penaeid shrimps. The present study showed that the difference in protein levels affected the growth and feed utilization of L. vannamei (Table 2). A broken line analysis based on weight gain suggested that the optimal dietary protein levels would be 34.5 and 35.6% for small-sized (0.6–5 g) and medium-sized (4–13 g) groups of L. vannamei. The optimum dietary protein level for maximum growth of L. vannamei can be affected by differences in shrimp size, stocking density, species of shrimp, culture system, and dietary protein sources. In the range of approximately 1 g sized shrimp, optimal growth was observed with 33 to 44% crude protein in diets when krill meal was used as a main protein source (Rosas et al. 2001). Gao et al. (2016) reported that the optimum dietary protein level for L. vannamei (0.31–6.0 g size) was 34% when a semi-purified diet was used. Shahkar et al. (2014) reported that 33% dietary protein level is optimum for an optimal growth of L. vannamei (approximately 1–11 g size) when fish meal was used as the main protein source, whereas Martinez-cordova et al. (2003) found that the optimal protein level was 25% when L. vannamei (1–17 g size) was cultured in a pond system with three commercial diets containing 25, 35, and 40% CP for 16 weeks. In a very high salinity condition (60 g/L), the optimum dietary protein level was estimated to 46.7% when the L. vannamei (0.09–2.2 g size) was fed a semi-purified diet (Sui et al. 2015).
Most of the protein requirement studies on shrimp are limited to the juvenile stages, and the protein requirements of post-juvenile stages have mostly been estimated. There has been little information about the protein requirement during the adult stage of the shrimp. Based on the growth of large shrimp (10–20 g size) in the present study, the optimal dietary protein level was estimated to be 32.2% by a broken line analysis. To the best of our knowledge, one study (Smith et al. 1985) is available with which to compare the growth of large (10–20 g size) L. vannamei in the present study. Smith et al. (1985) reported that adult-sized (20–25 g) shrimp was not affected by the protein levels but affected by protein sources (animal or plant), whereas small-sized shrimp (4–11 g) was significantly affected by protein levels. The difference in results between the present study and Smith et al. (1985) can be explained mainly by the difference in protein sources such as semi-purified sources (casein and gelatin) and practical sources (shrimp meal), respectively, as well as different experimental conditions.
The PER tended to decrease with increased dietary protein, which is consistent with results in shrimp (Hu et al. 2008; Xia et al. 2010; Shahkar et al. 2014). The lowest PER found in 40 to 50% protein diets indicates that the excessive protein was used for metabolic purposes other than growth. Usually, a low dietary protein is efficiently utilized for protein synthesis by shrimp (Shiau and Peng 1992; Hu et al. 2008; Xia et al. 2010). Also, the differences in protein sources could result in different PER values (Hajra et al. 1988). In the present study, fish meal was fixed to 18% and then casein and gelatin mix (4:1, v/v) was gradually increased to make the dietary protein level different. Therefore, the differences in PER values in the present study might be attributed to the difference only in protein level rather than protein quality.
The differences in the quantity or quality of protein, the ratio of dietary protein to energy, and species contribute to the varying effects of dietary protein on carcass composition (Hubbard et al. 1986; Siccardi, 2006). The lower whole-body protein content was observed in low level of dietary protein (P25 diet) which was often reported in fish species (Kim and Lee 2009; Shahkar et al. 2014). Also, Siccardi (2006) evaluated the requirement of daily digestible protein (DP) and digestible energy (DE) of L. vannamei with two types of diets (25% CP diet and 35% CP diet) and different feeding regimes. They concluded that the protein requirement of shrimp needs to be reevaluated considering feeding methods such as ad libitum/restricted feeding and daily feeding amount as well as dietary energy contents.