Background
Whiteleg shrimp (Litopenaeus vannamei) is an important cultured species, accounting for more than 53% of the total production of farmed crustaceans (FAO 2018), and their production and consumption are increasing notably every year. Shrimps are considered perishable due to easy loss of freshness during storage and distribution, especially when transported with the viscera intact. Various enzymatic and bacterial activities occur in the shrimp during storage and distribution, leading to spoilage accompanied by the production of unpleasant odor, discoloration, and chemical changes in the meat (Du et al. 2015; Ginson et al. 2013). The production of unpleasant odor, occurrence of black spots, and meat softening are principal sensory and biochemical quality index features due to their close correlations with decreases in freshness (Du et al. 2015). Unpleasant odor is known to be caused by aldehydes, ketones, trimethylamine, ammonia, and volatile sulfur compounds produced by degradation of lipids and proteins by microorganisms (Ocaño-Higuera et al. 2011; Tsironi et al. 2009; Du et al. 2015; Jaffrès et al. 2011). Black spots occur mostly due to discoloration, which is a defect caused by the activity of tyrosinase during storage (Mu et al. 2012; Tsironi et al. 2009). The decomposition and softening of meat due to a rapid freshness drop is a result of protein degradation caused by microorganisms (Dai et al. 2016).
Freshness is directly related to the value of a commodity, and thus it is crucial to evaluate it promptly. Sensory evaluation is the most important method for determining the freshness and quality of aquatic products (Sant’Ana et al. 2011; Cardenas Bonilla et al. 2007; Alasalvar et al. 2001). However, the disadvantage of sensory evaluation is its lack of objectiveness. Therefore, chemical methods based on scientific procedures have been used coupled with a sensory method as an effective multimodal way of quality evaluation. Several studies have been conducted on freshness and quality changes of shrimp during storage. Le et al. (2017) studied changes in chemical indicators such as total volatile basic nitrogen (TVB-N), trimethylamine (TMA), and histamine by storing black tiger shrimp (Penaeus monodon) at 0 °C. Huang et al. (2012) analyzed the quality of chitosan-based edible coatings of whiteleg shrimp (L. vannamei), while storing at 0 °C. Tsironi et al. (2009) reported the shelf life of frozen shrimp at variable temperature conditions. Jeyasekaran et al. (2006) analyzed sensory test results, pH, and bacteriological amount during storage of Indian white shrimp (Penaeus indicus) in dry ice. Ginson et al. (2013) analyzed changes in K-value and sensory acceptability of high-pressure-processed Indian white shrimp (Fenneropenaeus indicus). Nirmal and Benjakul (2009) reported the effect of ferulic acid on polyphenol oxidase and quality changes of white shrimp during iced storage. Iu et al. (2011) performed sensory evaluation and assessed TVB-N, TMA, and microbiological changes during the accelerated storage period of Acetes chinensis. Gonçalves et al. (2015) evaluated spiny lobster (Panulirus argus) using a quality index method, microbiological test, and TMA. As described above, most of the studies on guidance for aquatic products focused on sensory evaluation and/or chemical methods such as TVB-N, TMA, and K-value. Thus, studies on the changes in volatile nitrogen compounds (dimethylamine, ammonia) and volatile sulfur compounds (hydrogen sulfide, methyl mercaptan, dimethyl sulfide, and dimethyl disulfide) for aquatic products are scarce.
This study aimed to provide a basic standard for assessing freshness and acceptability by sensory evaluation as well as evaluation changes in biochemical indicators (K-value, TVB-N, volatile nitrogen compounds, and volatile sulfur compounds) during the storage of whiteleg shrimp at ambient temperature.
Materials and methods
Fresh whiteleg shrimp (L. vannamei) each of approximately 24 ± 2 g in weight and 17 ± 2 cm in length were purchased from a local aquatic products market in Busan of Korea. The shrimp were kept in seawater with ice and were transferred to the laboratory within 2 h. After shrimp with signs of visual defect or breakage were removed, the remaining shrimp were picked out. The shrimp were washed clean with tap water and divided into two samples, whole body and meat. The meat sample was collected immediately by hand with gloves to prevent contamination. Shrimp whole body and meat were divided into ten and stored in several sampling bags at − 4 °C until the sensory and biochemical experiments were conducted. All experiments were performed 3 times using more than five shrimps each time.
Sensory evaluation and overall acceptability of whole body and meat of whiteleg shrimp were assessed by twenty trained panelists on a 5-point (5 for excellent, 4 for good, 3 for fair, 2 for poor, 1 for unfit) scale. Panelists were trained using discriminative tests with practice evaluation methods to identify spoilage characteristics in shrimp. Prior to conducting the different analyses, preliminary experiments and observations were conducted based on the storage period to set the evaluation parameters and criteria, which were expected to have a great influence on the organoleptic freshness of the samples. Quality evaluation parameters selected were indicators of odor, shell color, black spot, state of internal organs, adhesion of head and body, meat firmness, and meat color. The shrimp were stored at 25 °C in an incubator, and the sensory evaluation was carried out every hour from initial storage. The parameters of sensory evaluation were odor, shell color, black spot, state of internal organs, adhesion of head and body, meat firmness, and meat color, which were expected to be significantly influenced by the freshness of the shrimp. The mean of the scores given by the 20 panelists represented the overall sensory quality of the shrimp (Table 1).
1)Only for whole body
1,2)For both whole body and meat
K-value was measured according to the method of Shin et al. (2013). Ten grams of the sample for each storage time was weighed and ground. Then, 20 mL of 10% perchloric acid was added, and the mixture was stirred for 30 min and then centrifuged at 3000 rpm for 10 min at 4 °C to collect as much supernatant as possible; this was repeated three times. The supernatant was mixed thoroughly and adjusted to pH 6.5 with the refrigerated 5 N KOH, and a final volume of 100 mL was drawn. After the solution was allowed to stand for 30 min, the supernatant was taken out, filtered (0.25 μm membrane filter), and poured into a 1.5-mL vial. The filtrate was analyzed by HPLC (Hitachi L-2000, Hitachi, Tokyo, Japan) with a C18 column (3.9 × 300 mm, 10 μm, Waters, Dublin, Ireland). The injection volume was 20 μL, the temperature was maintained at 40 °C, and the flow rate was 0.8 mL/min. The mobile phase was 1% triethylamine-perchloric acid, and a UV detector was used at 254 nm. All standard materials were purchased from Sigma-Aldrich Korea, and the amounts of each ATP and its related compounds were determined and calculated based on the standard ATP, ADP, AMP, IMP, inosine (HxR), and hypoxanthine (Hx).
Ten grams of the sample was put into 50 mL of distilled water, homogenized with a stirrer (MSH-30A, Daihan Scientific, Gangwon-do, Korea) and filtered (Whatman no. 1). The filtrate was adjusted to be slightly acidic (pH 4.5–5.5) with 5% sulfuric acid solution and diluted to 100 mL with distilled water. One milliliter of the filtrate was placed in a Conway unit and measured according to the Conway microdiffusion method (Conway 1947).
Samples of each 500 g were weighed, ground, and sealed in an aluminum gas bag (265 × 212.5 mm, As One, Osaka, Japan), which was placed in a drying oven at 50 °C for 30 min. The generated headspace gas was directly injected into a gas chromatography-nitrogen phosphorus detector (GC-NPD) using a gas tight syringe, to analyze dimethylamine (DMA) and trimethylamine (TMA). The GC-NPD was used to conduct a quantitative analysis, and the RTX-35 AMINE (30.0 m × 0.53 mm × 1 μm, Restek, Bellefonte, PA, USA) was used as a capillary column. The optimized oven temperature program was initially 50 °C for 10 min and increased at a rate of 10 °C/min until it reached 150 °C, where it was held for 20 min. The operating temperatures of the injector and the detector were each 250 °C. Helium was used at 6.5 mL/min as a carrier gas. For NPD, hydrogen and air were used at 27 mL/min and 275.5 mL/min, respectively. Ammonia measurement was performed by directly injecting headspace gas collected using the same procedure as in TMA and DMA detection into an ammonia gas detection tube (Gas Tec, Kanagawa, Japan).
Volatile sulfur compounds were measured according to the method of Mahattanatawee and Rouseff (2014) with some modifications. The volatile sulfur compounds were analyzed by GC-PFPD (GC-2010, Shimadzu, Kyoto, Japan), by directly injecting headspace gas using the same procedure as in TMA and DMA detection. The oven temperature program of GC consisted of an initial temperature of 35 °C for 15 min and was increased at 5 °C/min until it reached 100 °C, where it was held for 1 min. The column used was DB-1 (30.0 m × 0.25 mm × 0.28 μm, Agilent Technologies, Stevens Creek Blvd, Santa Clara, USA). The condition of carrier and detector gases was identical to that in the TMA and DMA analyses with GC-NPD. Injector and detector temperatures were 200 °C and 360 °C, respectively.
Results and discussion
Figure 1 shows the overall sensory scores according to the quality parameters and description of whiteleg shrimp; scores range from 5 (best quality) to 1 (worst quality). Whiteleg shrimp exhibited a significant quality decline during storage at ambient temperature. At initial storage, fresh shrimp exhibited fresh odor in both whole body and meat, with a sensory score of 5. After storage for 7 h, the whole body manifested a decrease in quality, with a sensory score of 3. After storage for 17 h, the whole body sample exhibited an offensive ammoniacal and strong sulfur compound odor, with a sensory score of 1. After 20 h of storage, the shrimp had a strong smell of ammonia and volatile sulfur compounds. According to Du et al. (2015), shrimp produces an unpleasant odor as its quality changes. In our study, the first sensory changes that occurred in the stored shrimp were related to odor and appearance.
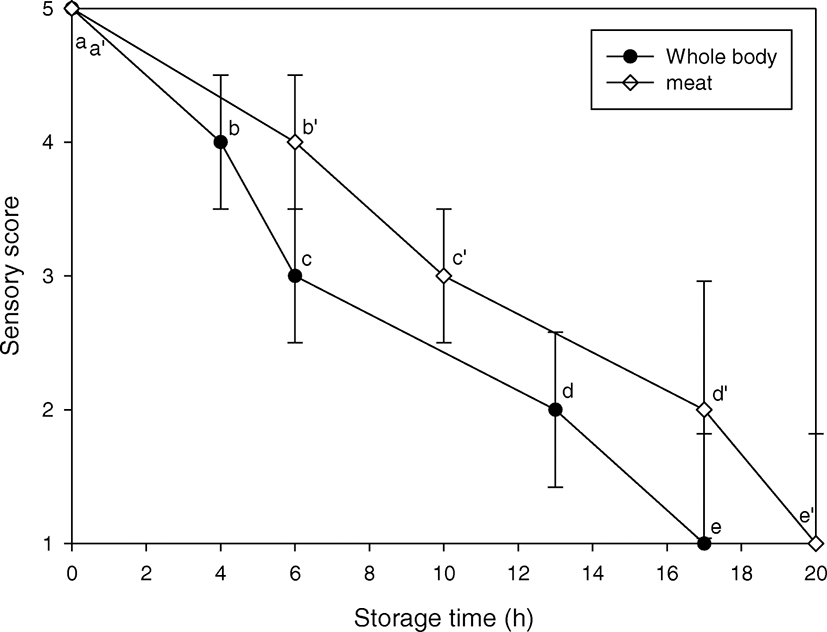
The initial shell color of the shrimp was light gray. After 13 h of storage, the whole body of the shrimp from the tail to head portion changed to pink and then to red color, with a sensory score of 2, and after 17 h, the shell color was reddish, with a sensory score of 1. When astaxanthin is in a state of binding with proteins, it has a blue-green color (alive), but becomes darker when it is released due to protein denaturation (Higuera-Clapara et al. 2006). Fresh shrimp did not show black spots. However, after 7 h, black spots appeared partially on the head and tail, resulting in a score of 3. After 17 h, black spots were remarkable, with a score of 1. Black spots in shrimp are caused by production of melanin by tyrosinase and the effect of hemocyanin (Mu et al. 2012; Jang et al. 2003; Huang et al. 2012). This change in shrimp is thus called melanosis and occurs if shrimp are improperly stored after harvest.
Initially, the head and the body of fresh shrimp maintained a firm connection, but once the freshness decreased, the head was loosened and slightly detached from the body. After storage for 17 h, the adhesion force became weak, and the head and body were easily separated. Fresh internal organs of the shrimp had a scarlet color, with a strongly adhered head. After 13 h of storage, shrimp changed to a red color and their internal organs turned to liquid and flowed downward, with a sensory score of 2. After 17 h, the internal organs were dark red, with a score of 1. The fresh shrimp had a very strong elasticity, being rigid and firm, but the elasticity of the meat lessened and the meat softened as the freshness decreased. After 17 h, the shrimp lost elasticity and were easily broken down by a relatively small force.
Fresh shrimp meat was light gray in color, but the gloss of spoiled meat decreased and the color of the body (from tail to head) changed from pinkish to reddish. The whole body and meat of the shrimp exhibited an overall red color after 17 and 20 h, respectively. All the parameters were considered useful to distinguish the freshness of the whiteleg shrimp. However, the parameter changes could be irregular depending on how the whiteleg shrimp was stored. Similarly, Iu et al. (2011) reported that color and odor for dried Acetes chinensis changed significantly during storage. Tsironi et al. (2009) observed changes in frozen shrimp appearance, odor, and color during storage. Jeyasekaran et al. (2006) found changes in odor, color, and texture in sensory evaluation of frozen shrimp that were similar to the results of this study.
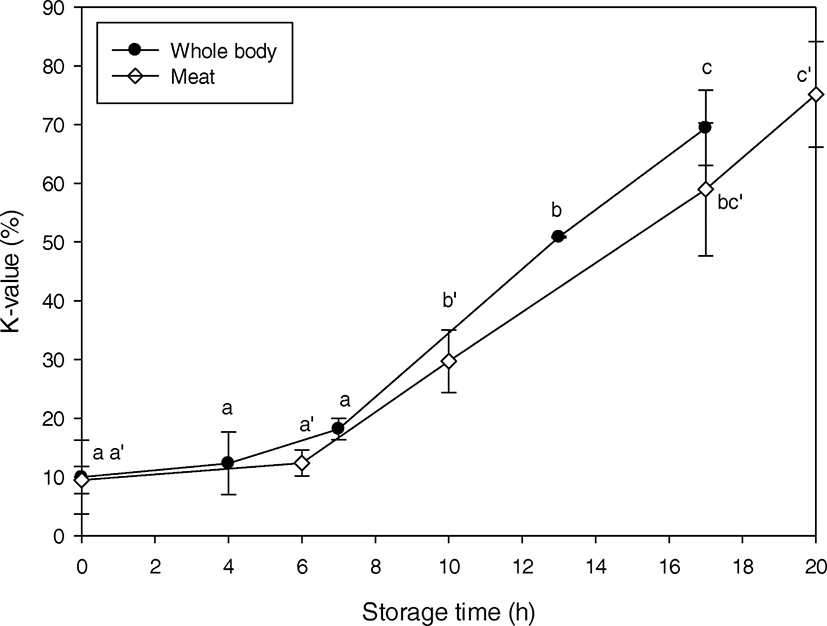
Figure 2 shows the changes in K-value depending on the storage time of the whole body and meat of whiteleg shrimp. Whole body of the fresh shrimp showed K-values of 9.96–12.32% (4–5 points), fair-quality shrimp exhibited a K-value of 18.14% (3 points), and poor-quality shrimp exhibited a K-value of 50.83% (2 points, after 13 h of storage). K-value of shrimp meat increased more slowly than did that of the whole body throughout the storage period. Meat showed a K-value of 9.46% when fresh, which increased to 29.70% at 3 points after 7 h of storage; poor-quality shrimp exhibited a K-value of 58.97% (2 points, after 17 h of storage) and 75.14% at 1 point after 20 h of storage. K-value is a relative proportion used to assess ATP of degradation products, and it is used as an index to determine freshness through initial change of nucleotides in aquatic products (Ólafsdóttir et al. 1997). However, the rate of nucleotide degradation, processing method, and storage conditions differ by species (Ginson et al. 2013). Saito et al. (1959) described fishery products with K-values lower than 20% as very fresh, those with less than 50% as moderately fresh, and those with higher than 70% as unfresh. This is similar to our results, which indicated that products with K-values of less than 20% are fresh and those with K-value of 50–70% are unfresh. In addition, similar to our results, Ocaño-Higuera et al. (2011) reported that K-value has a direct linear relationship with storage time, and thus can be used as a useful indicator for monitoring loss of freshness. Alasalvar et al. (2001) reported that sensory score of fish showed good agreement with K-value results throughout the storage period. Therefore, K-value analysis is considered to have a significant correlation with the sensory evaluation. Like other seafoods, K-value analysis can be a useful indicator for evaluating the freshness of whiteleg shrimp.
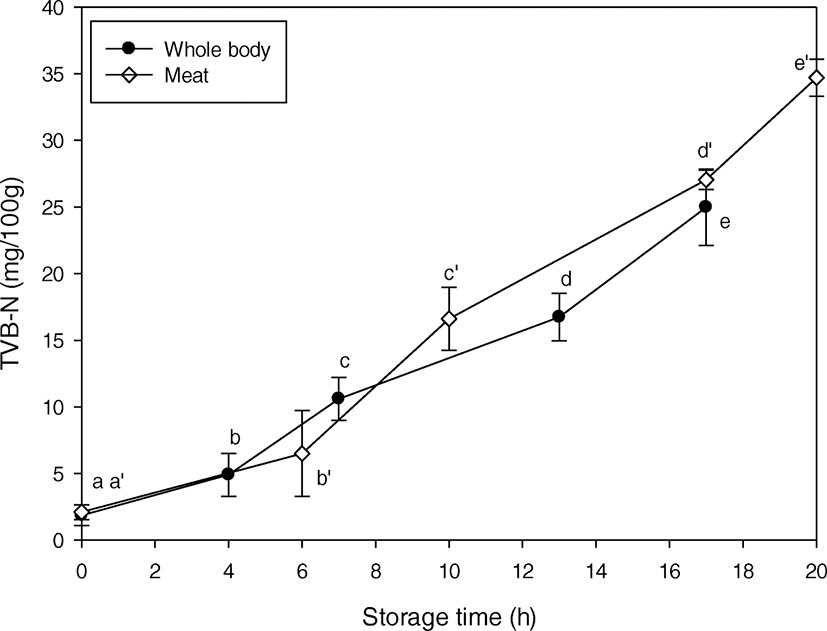
TVB-N includes measurement of TMA, DMA, ammonia, and other nitrogen compounds associated with seafood spoilage and increases as spoilage progresses (Ocaño-Higuera et al. 2011). Figure 3 shows the change in TVB-N depending on the storage time and condition of the whole body and meat of whiteleg shrimp. For the whole body, TVB-N levels of (5–4 points) 1.86–10.60 mg/100 g, 10.60 mg/100 g, 16.74 mg/100 g, and 24.98 mg/100 g indicated fresh (5–4 points), fair (3 points), poor quality (2 points, storage for 13 h), and unfit (1 point, storage for 17 h), respectively. Shrimp meat samples showed a similar tendency during the storage period. In general, TVB-N levels are applied to determine the freshness of fish. Fish decomposition is a progressive proteolysis of the muscle tissue induced primarily by the action of microorganisms and, to a minor extent, autolytic enzymes (Ocaño-Higuera et al. 2011). In fish, the standard is known to be 5–10 mg/100 g for fresh fish, 15–25 mg/100 g for normal fresh, 30–40 mg/100 g for initial spoilage, and 50 mg/100 g or more for spoilt fish (Özyurt et al. 2007). However, this standard cannot be applied to sharks or stingrays because they contain a large amount of urea or TMAO and generate a large amount of ammonia, TMA, and DMA (Jo et al. 2013). Increases in these parameters during storage have been observed in many studies. Dai et al. (2016) measured TVB-N changes by shrimp (Metapenaeus ensis) storage at 4 °C. Lee and Um (1995) reported that TVB-N increased from initial 5 mg/100 g to 14.8 mg/100 g after 8 months by storing shrimp (Penaeus japonicus) at − 18 °C. In fact, based on the results of TVB-N values and sensory evaluation, the biochemical freshness standards for whiteleg shrimp are slightly lower than the standards used in fish.
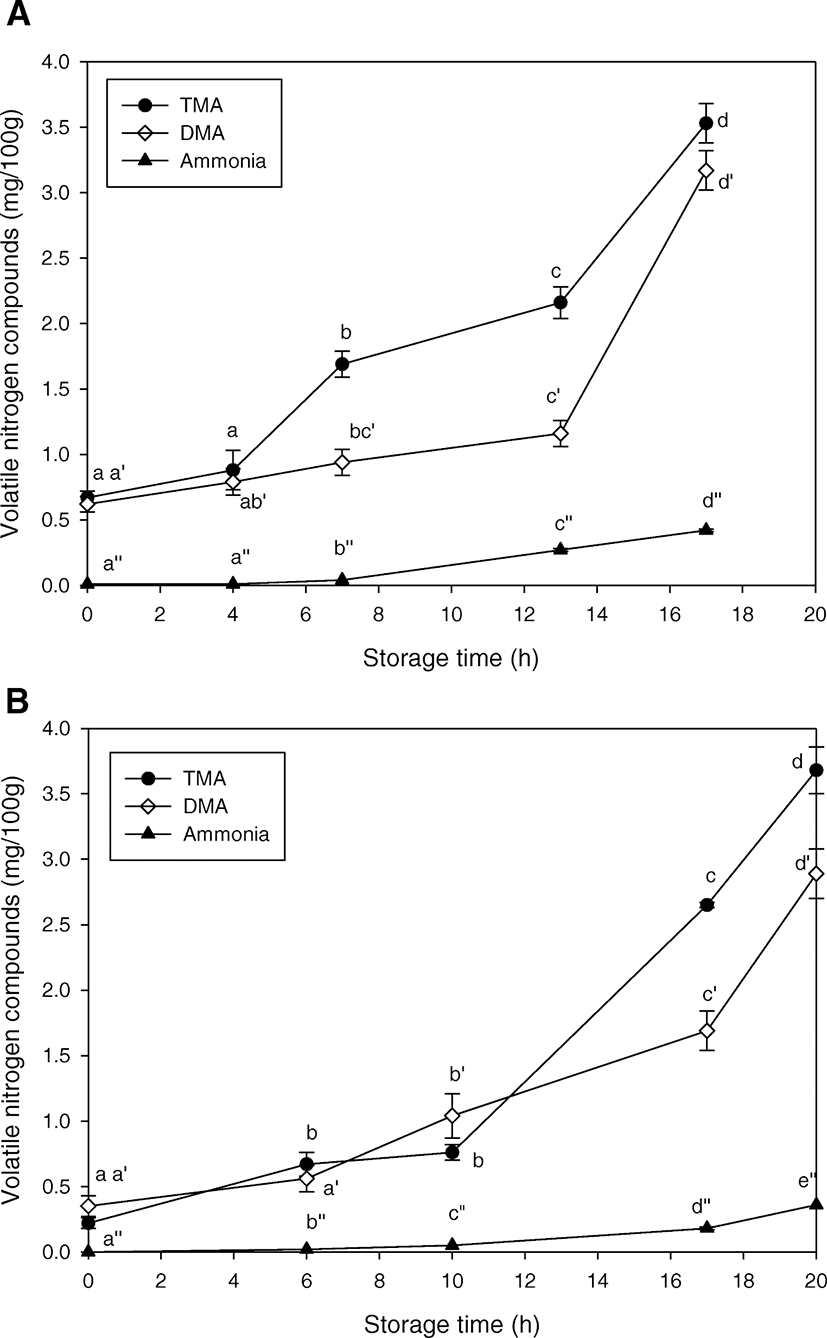
Volatile nitrogen compounds such as TMA, DMA, and ammonia are produced as a result of freshness degradation of aquatic products and affect the sensory quality of those products. TMA is a typical fishy odor component produced by trimethylamine oxide (TMAO) due to bacterial action and is also occasionally present in fresh meat (Ólafsdóttir et al. 1997). DMA is produced by the degradation of TMAO and the decomposition of amino acids, and ammonia is mainly produced by the decomposition of amino acids due to the action of bacteria (Huss. 1995). Among these volatile nitrogen compounds, TMA is occasionally used as a freshness judgment criterion for fish. The TMA value for the initial decomposition baseline in fish is well known to be 3 mg/100 g (Song et al. 2005). Figure 4 shows changes in the content of volatile nitrogen compounds (TMA, DMA, and ammonia) during storage of whole body and meat of whiteleg shrimp. Under TMA analysis, the whole body showed a low value of 0.67–0.88 mg/100 g at the initial fresh status (5–4 points), while the fair-quality whole body (3 points after 7 h storage) had a value of 1.69 mg/100 g. The TMA value of the whole body was 2.16 mg/100 g or more when in poor quality (less than 2 points, after 13 h of storage). The TMA value of meat was slightly lower than that of the whole body at the fresh stage but was similar to that of whole body at the poor quality stage (less than 2 points, after 17 h of storage).
In a previous study, Okpala et al. (2014) reported a significant increase in TMA values during iced storage of Pacific white shrimp. Iu et al. (2011) reported that the TMA value increased from an initial 7.93 mg/100 g to 16.06 mg/100 g after 14 days of shrimp storage at 37 °C. TMA levels of Acetes chinensis in our study showed a similar trend to the results obtained by Le et al. (2017).
DMA values for the whole body fresh shrimp (5–4 points) were 0.62–0.79 mg/100 g during the storage period, while the values for the poor-quality shrimp (less than 2 points, after 13 h of storage) were increased more than 1.16 mg/100 g. For the unfit sample (1 point, after 17 h of storage), the DMA value was 3.17 mg/100 g. DMA of the meat was slightly lower than that of the whole body. Ammonia measurement during storage showed that ammonia in the whole body was hardly produced in the fresh (5–4 points) shrimp; however, it was 0.27 mg/100 g in the poor-quality shrimp (2 points, after 13 h of storage). Ammonia content of the meat was 0.18 mg/100 g or more, with the meat exhibiting poor quality at 2 points after 17 h of storage. These results indicate that the TMA and DMA rapidly increased as quality decreased, presenting a strong correlation with the results of the sensory evaluation of freshness. Ammonia is produced less than TMA and DMA, but its lower threshold value gives it a significant effect on sensual discrimination due to spoilage.
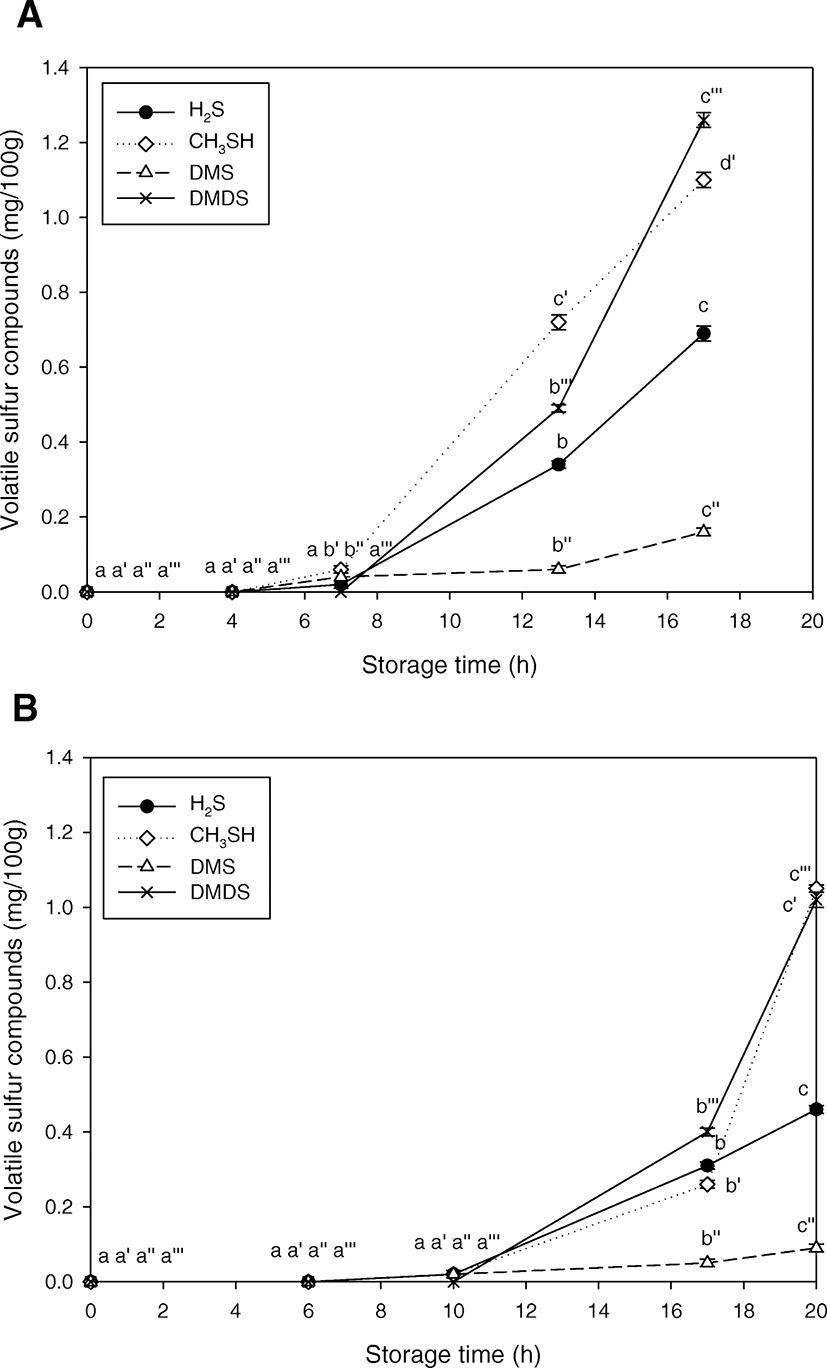
The degradation of sulfur-containing amino acids such as cysteine and methionine as a result of decrease in freshness can produce hydrogen sulfide and other volatile sulfur compounds (Higgins et al. 2003, Kadota et al. 1972). Figure 5a shows changes in volatile sulfur compounds by storage time of the whole body of whiteleg shrimp. The volatile sulfur compounds were not detected in the fresh shrimp (5–4 points). For normal fresh (3 points, storage for 7 h), minimal amounts of hydrogen sulfide, methyl mercaptan, and dimethyl sulfide, but not dimethyl disulfide, were detected. At poor quality (2 points, storage for 13 h), hydrogen sulfide (0.34 mg/100 g), methyl mercaptan (0.72 mg/100 g), and dimethyl disulfide (0.49 mg/100 g) were increased, including dimethyl sulfide (0.06 mg/100 g). Methyl mercaptan (1.10 mg/100 g) and dimethyl disulfide (1.26 mg/100 g) increased significantly in the unfit sample (1 point, storage for 17 h). Figure 5b shows changes in volatile sulfur compounds during storage of shrimp meat at 25 °C. At this level, no volatile sulfur compounds were detected in the fresh meat of shrimp, and the content of all the volatile sulfur compounds increased as the freshness decreased. Moreover, the increase rate and amount of volatile sulfur compounds in meat were slightly lower than those in the whole body. Hydrogen sulfide is often found to be produced by sulfate-reducing bacteria during spoilage of aquatic products. Methyl mercaptan is readily oxidized to disulfides in the air, which are less volatile than hydrogen sulfide, but produce a more “off-flavor” (Kadota et al. 1972). Dimethyl sulfide is produced by enzymatic cleavage of dimethylsulfoniopropionate during the spoilage of aquatic products (Leck et al. 1990; Reisch et al. 2011). Dimethyl disulfide was reported to arise from bacterial degradation of methionine or oxidation of methanethiol (Alasalvar et al. 2005; Kadota et al. 1972). As described above, methyl mercaptan and dimethyl disulfide were increased with a decrease in freshness of whiteleg shrimp. The formation of these volatile sulfur compounds is thought to have a significant influence on freshness determination in aquatic products, along with the volatile nitrogen compounds. The reason is thought to be that these volatile sulfur compounds have low threshold values, even if they are produced in low amounts.
Conclusion
This study investigated sensory and chemical indicators to evaluate the freshness and quality changes of whiteleg shrimp with storage time. When sensory evaluation and chemical indicators were compared, all changes showed significant correlations. Among them, the most sensitive chemical changes with time were methyl mercaptan and dimethyl sulfide among the volatile sulfur compounds. This result demonstrates that DMA, volatile sulfur compounds, TVB-N, K-value, and TMA are useful for quality and quality change evaluation for not only crustaceans but also all aquatic products, based on this freshness assessment for whiteleg shrimp.