Introduction
Gamak Bay, an embayment surrounded by Yeosu City and Dolsan Island, is located in the central region of southern Korean waters. Since the 1990s, human activities have exposed the bay to environmental pollution with an increase in nearby urban areas, as well as the by-products of diverse forms of fishery farming that have been developed in recent decades, including oyster and mussel farming. These activities have caused an increase in anthropogenic pollutant flux, particularly organic matter (Lee & Kim, 2008). These pollutants have led to several environmental problems, such as hypoxia and/or anoxia, which continuously occur during the summer when the water column is stratified and bottom waters are isolated from oxygen input in the northern region of Gamak Bay (Kim et al., 2006; Lee & Moon, 2006; Moon et al., 2006a).
Copepod organisms are the most abundant zooplankton taxa (Kiørboe, 1997; Mauchline, 1998). They are the main secondary producers in pelagic ecosystems, comprising 70% to 80% of total zooplankton density and biomass (Kiørboe, 1997; Raymont, 1983), and play a pivotal role in the exchange of energy and organic matter from primary producers to subsequent trophic levels (Mauchline, 1998; Turner, 2004; Uye et al., 2000) by grazing on small phytoplankton and, in turn, being preyed upon by planktivores (e.g., fish and jellyfish) (Uye et al., 2000). Marine copepod reproduction is constantly confronted with variations in biotic and abiotic factors that can affect their growth and/or progress in their life cycle and, thus, reproduction (Dias et al., 2015; Islam et al., 2006; Kayfetz & Kimmerer, 2017; Lin et al., 2011).
The study of copepods is crucial to better understand the functioning of coastal ecosystems (Chisholm & Roff, 1990; Leandro et al., 2007). Ecological studies of copepods in Gamak Bay have primarily investigated aspects of their seasonal variations in density (Moon et al., 2006b, 2020). Such studies have shown that the copepods in Gamak Bay are strongly influenced by temperature, salinity, dissolved oxygen, and phytoplankton standing stocks of different water masses (Moon et al., 2006b, 2020; Soh et al., 2002). However, estimates of seasonal changes in the biomass and production in copepods have not been reported for Gamak Bay. The objective of this study was to provide insight into the seasonal changes in copepod biomass and secondary production in Gamak Bay.
Materials and Methods
Environmental factors and estimates of copepod production were investigated at seven sites in Gamak Bay from January to December 2006 (Fig. 1). Each month, water samples were collected from the sample locations near the surface at 0.3 m depth and at near-bottom depths of 6 to 25 m. Temperature and salinity were measured using a YSI 6600 V2 model (YSI, Yellow Springs, OH, USA). The sample collection approach used in this study relied on returning to the same sites to collect water samples with a 5-L Niskin bottle from 1 m below the surface and 1 m above the bottom. To determine total chlorophyll a (Chl-a) concentrations, a 500 mL sub-sample was filtered (vacuum < 5 cm Hg) through a GF/F filter (Whatman, Maidstone, UK) from each water samples, and Chl-a was extracted with 90% acetone for 24 h in the dark. Chl-a concentrations were established fluorometrically using a Cary 300 spectrophotometer (Varian, Palo Alto, CA, USA) (Parsons et al., 1984).

Zooplankton samples were collected in vertical hauls using a standard Norpac net (200 μm mesh size and 45 cm diameter) from the bottom to the surface of the sampling sites in Gamak Bay. The nets were equipped with a flow meter (Model 438115; Hydro-bios, Altenholz, Germany) to determine the quantity of water filtered during each tow. Copepod samples were immediately preserved in seawater-buffered formaldehyde (5% final concentration) for enumeration and identification. In the laboratory, the copepod samples were subsampled using a Folsom plankton splitter and dispensed onto Bogorov-Rass counting chambers. The taxonomic composition within each copepod group was then identified to species or often genus level. Subsamples for identification and enumeration contributed at least 10% of the total samples. The copepod species were identified to the lowest feasible taxon, and counts were made using an Olympus SZ-40 stereomicroscope (Olympus, Tokyo, Japan). Copepod density was expressed as the number of individuals per cubic meter (ind · m−3), and subsamples were verified by species, life stage (copepodid stage I to VI), and sex under stereomicroscopy. Body length was measured for 20 randomly selected copepodite and adult individuals of each species; prosome and total body length were measured using Image-Pro Plus (DXM1200F; Nikon, Tokyo, Japan). Biomass was estimated for each individual based on applied length–weight regression (Uye, 1982; Uye & Shimazu, 1997).
Copepod biomass was calculated for each individual and distinguished by prosome length using the following length–weight regression equation (Uye, 1982), expressed as:
where Wc is the individual weight (μg C) and PL is the prosome length (μm).
In cases where the biomass of the copepod prosome and abdomen could not be distinguished, such as in Harpacticus sp. and other Harpacticoida, biomass was calculated using a regression equation (Hirota, 1981), expressed as:
where Wd is the dry weight (μg) and BL is the total body length (μm). Carbon content was assumed to be 47% of the dry weight (Hirota, 1981).
Daily secondary production was evaluated using the product of copepod biomass and growth rate:
where Pc is daily secondary production (mg C m−3 d−1), N is density (ind · m−3), Wc is copepod biomass (mg C m−3), and g is the individual weight-specific growth rate (d−1). Here, g was determined for copepodites and adults of the total number of copepods using the standard growth models of Huntley & Lopez (1992):
and of Hirst & Bunker (2003):
where g is the individual weight-specific growth rate (d−1), T is the ambient temperature (°C), Wc is the individual body weight (μg C ind−1), and Ca is the Chl-a concentration (μg L−1). The Hirst and Bunker model describes the growth rate of nauplii, copepodites, and adult copepods of both egg spawning strategies broadcasters or sac-spawners).
Results
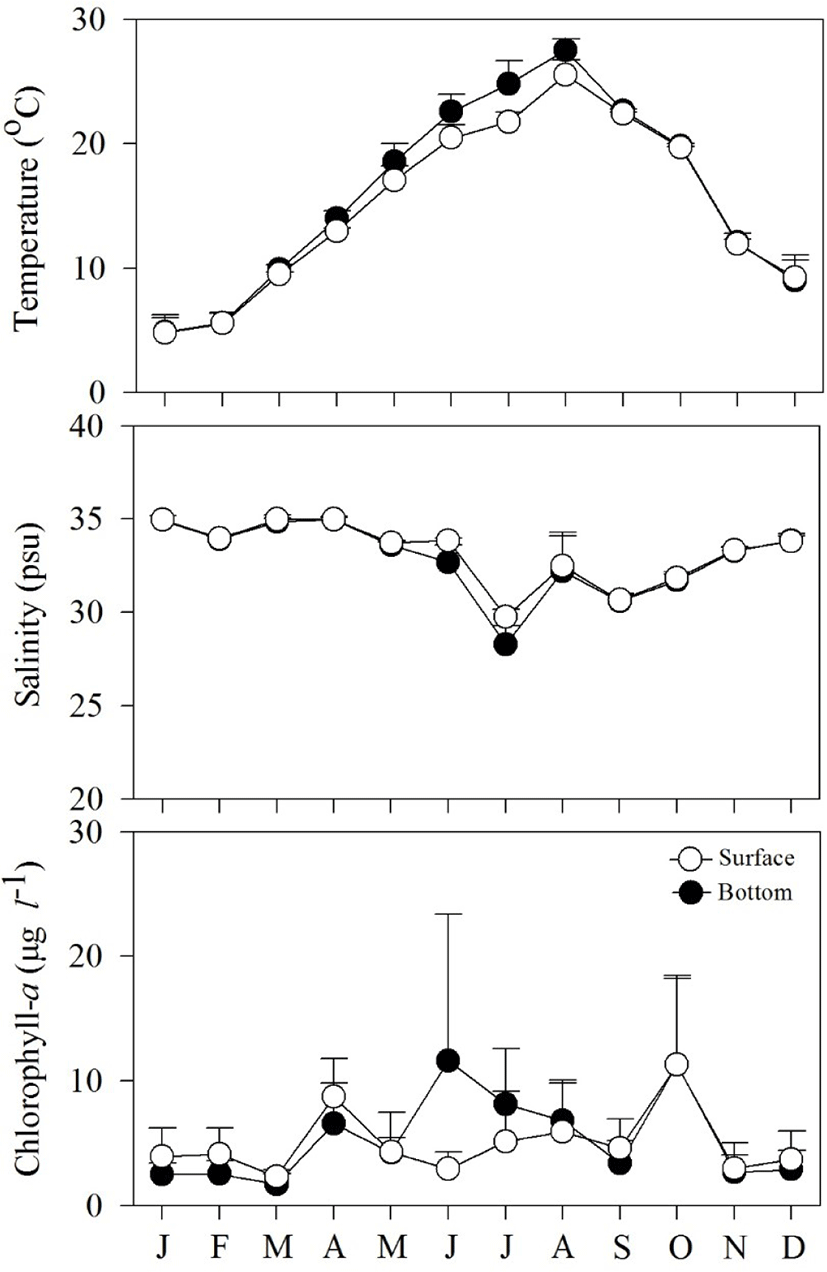
Fig. 2 shows spatial and temporal variations in environmental factors. Mean temperature showed seasonal variation, ranging from 4.8°C to 27.5°C at the surface, and from 4.8°C to 25.5°C near the bottom. The lowest mean temperature was recorded in January and the highest in August. Mean salinity varied from 28.3 to 34.9 psu at the surface and from 19.8 to 34.9 psu near the bottom. The lowest mean salinity value was observed in July, while the highest values were observed in January. Variation in salinity was associated with precipitation. Mean Chl-a concentration fluctuated from 1.7 to 11.6 μg L−1 at the surface, and from 2.3 to 11.3 μg L−1 near the bottom.

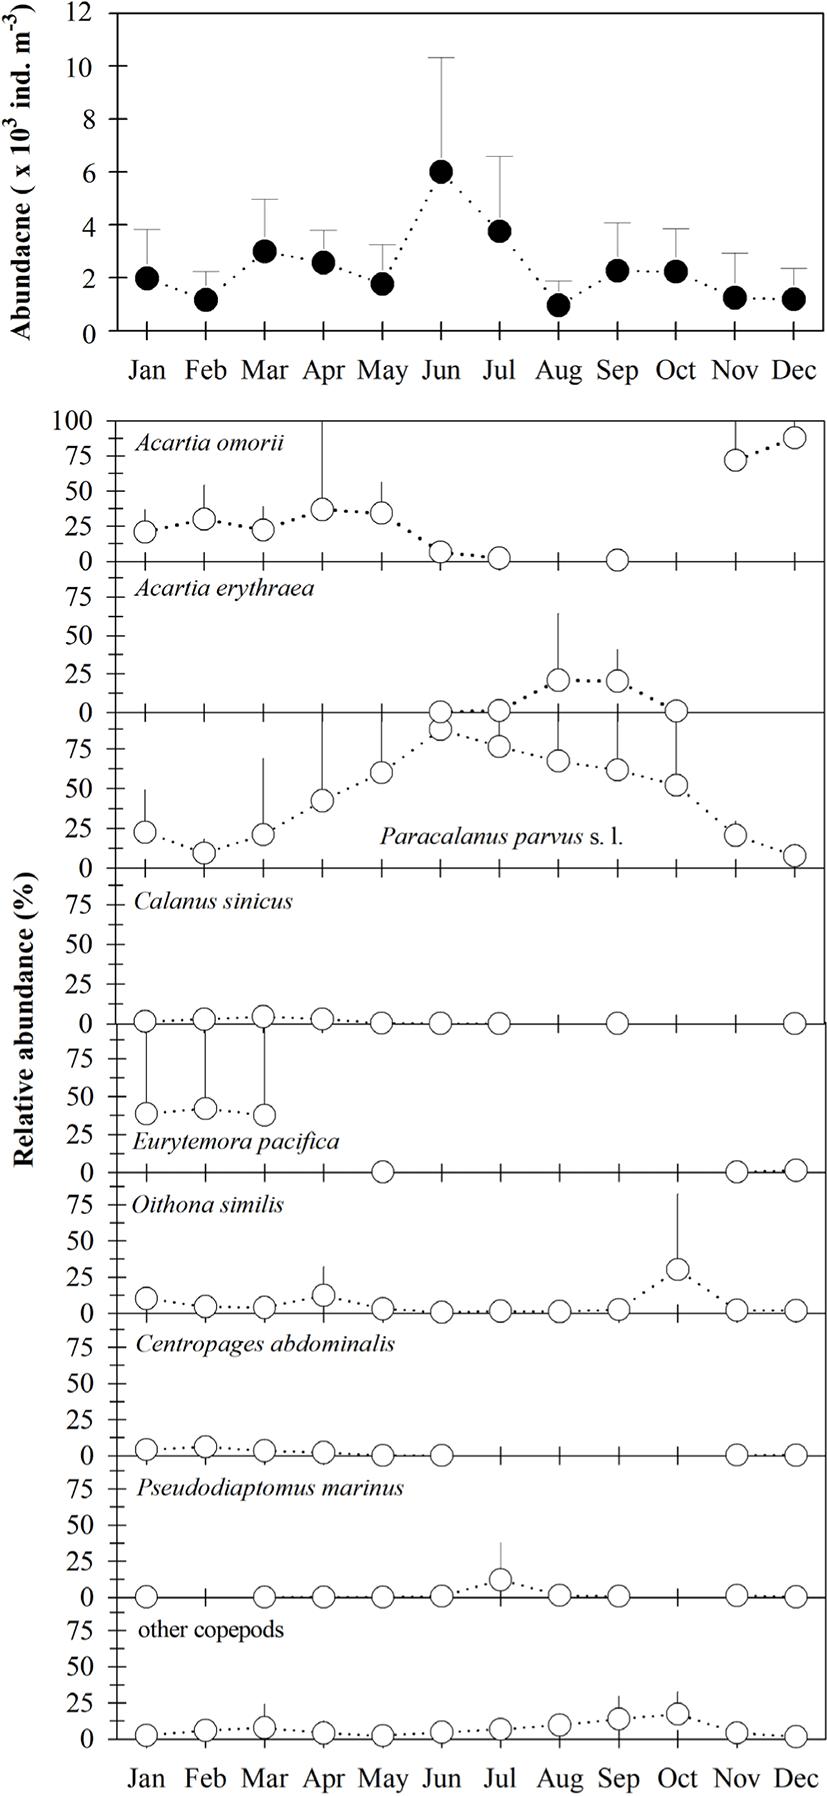
Mean copepod density (copepodites + adults) varied from 949 to 5,999 ind · m−3 (Fig. 3), and was generally higher from March to July than in other months. All 32 taxa occurring in Gamak Bay showed significant seasonal variation, with the predominant species being Paracalanus parvus s. l., Acartia omorii, Eurytemora pacifica, Oithona similis, Acartia erythraea, Centropages abdominalis, Pseudodiaptomus marinus, and Calanus sinicus. Paracalanus parvus s.. l. were predominant during the study period, accounting for 7.5% to 87.2% of total copepod density, with a mean of 44.0%. Acartia omorii was more dominant from January to May, November, and December, where it comprised 2.2% to 87.7% of total copepod density. Furthermore, P. parvus s. l. and O. similis occurred throughout the year; however, two other dominant species, E. pacifica and C. abdominalis, occurred only during periods of low temperatures. The high numerical density of A. erythraea was attributed to environmental parameters present during the summer.

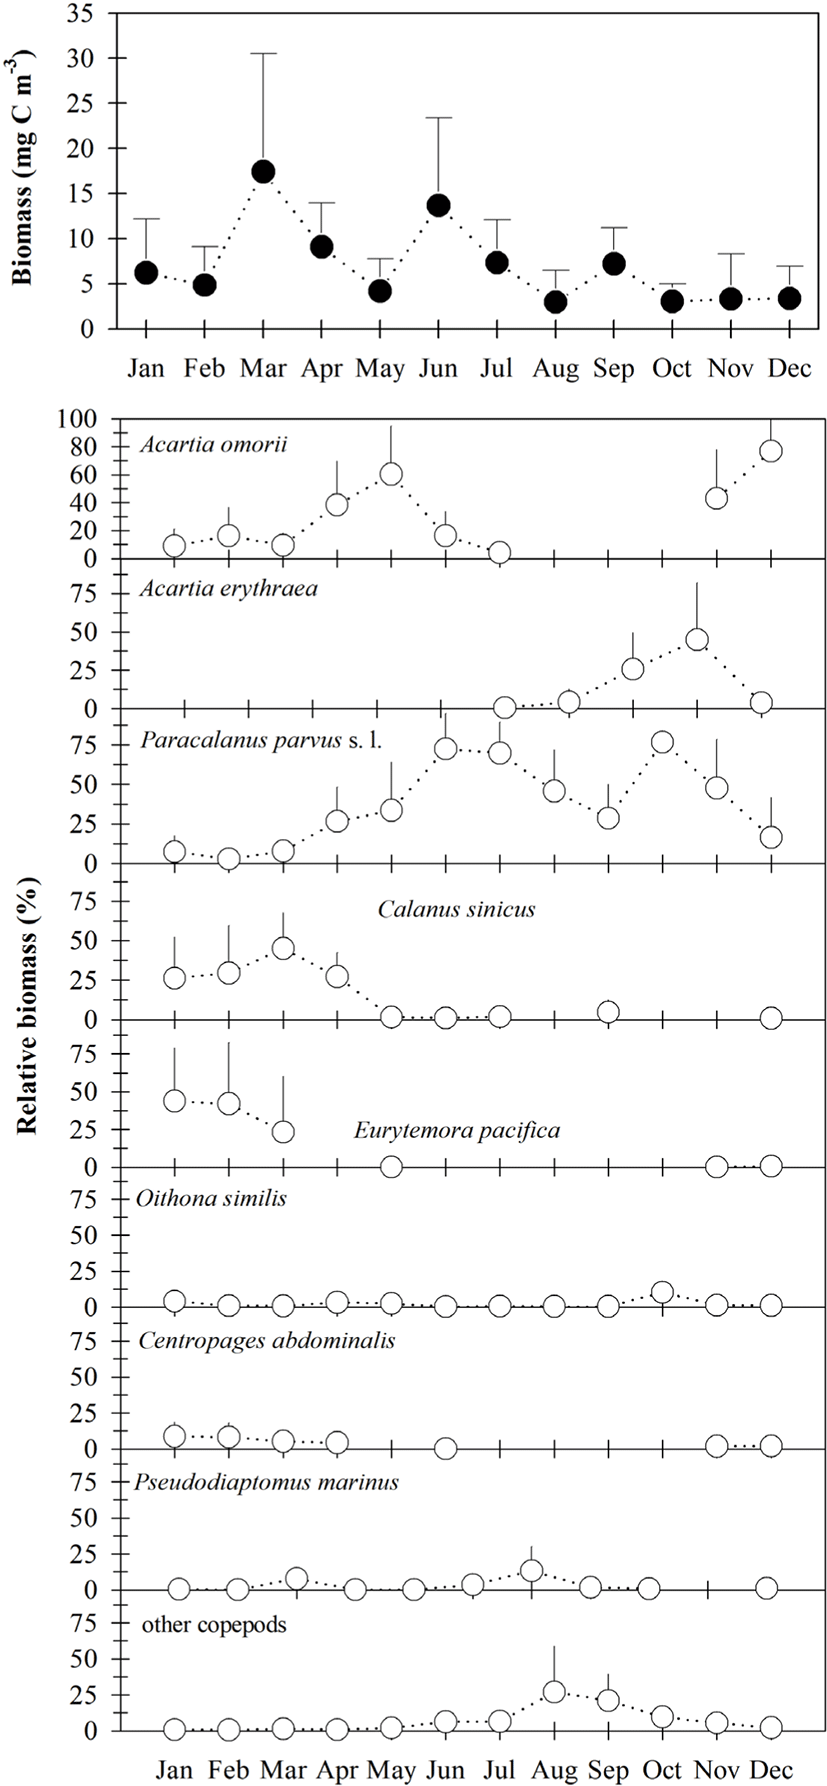
Total copepod biomass ranged from 0.33–43.10 mg C m−3 (Fig. 4), with a higher density occurring at sampling site 2 in March. Total copepod biomass was higher from June to September and lower from October to December (Fig. 4). Seasonal changes in total copepod biomass were nearly similar to that of density, although the contributions of P. parvus s. l. (mean of 34.9%), A. omorii (mean of 26.0%), A. erythraea (mean of 9.9%), E. pacifica (mean of 9.9%), and C. sinicus (mean of 8.3%) to total copepod biomass were higher than those of the copepod density.

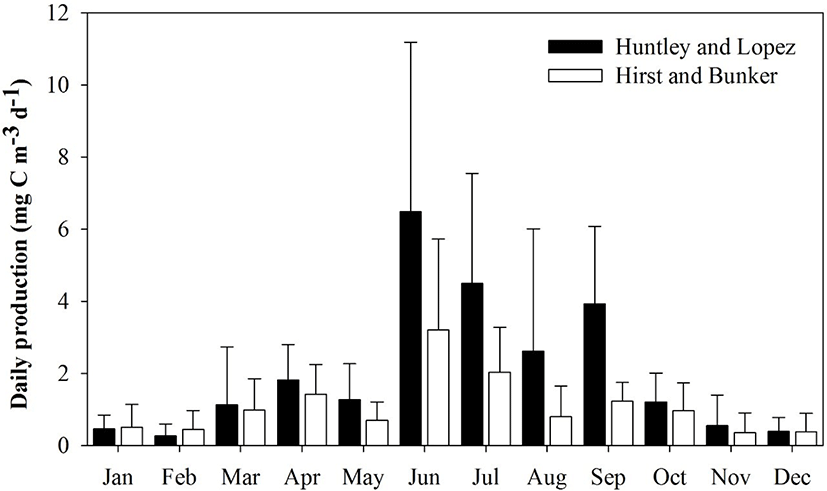
The Huntley and Lopez and Hirst and Bunker growth models were used to calculate secondary production. Each model indicated that high daily secondary production occurred from June to September. Mean secondary production and species composition differed depending on the model applied to evaluate growth rate. Mean secondary production was generally higher with the Huntley and Lopez model than with the Hirst and Bunker model. As expected, the secondary production of copepods was highest during summer (July to August) and early autumn (September), and lowest in winter (December to February).
Mean secondary production (mean ± SD) ranged from 0.46 ± 0.39 to 6.49 ± 4.69 mg C m−3 d−1 (Huntley and Lopez model) and 0.39 ± 0.32 to 3.93 ± 2.16 mg C m−3 d−1 (Hirst and Bunker model) (Fig. 5). Mean secondary production was approximately 1.8 times higher using the Huntley and Lopez model (2.05 ± 1.63 mg C m−3 d−1) compared to that obtained from the Hirst and Bunker model (1.09 ± 0.85 mg C m−3 d−1). Growth rate predictions from both the Huntley and Lopez and the Hirst and Bunker models were significantly different from the measured values (Student’s t = 5.936, p < 0.001). The ratio of production rate to biomass (P/B) varied from 0.08 to 0.86 d−1 in January to August, with a mean of 0.33 d−1 using the Huntley and Lopez model, and 0.03 to 0.33 d−1 in March to October, with mean of 0.18 d−1 by the Hirst and Bunker model.

Discussion
This study was based on the annual variation in the 2006 estimates of copepod density, biomass, and secondary production in Gamak Bay off the southern coast of Korea. Our results show considerable seasonal changes in environmental factors and copepod density and biomass trends during the study period. Copepods showed higher densities in the summer (June and July) compared to that in the winter. Seasonal changes in dominant copepod species can occur in Gamak Bay under unstable environmental conditions (Moon et al., 2006b; Soh et al., 2002). A similar copepod density composition as found in this study has commonly been observed in several other locations in Gwangyang Bay (Soh & Suh, 1993), Deukryang Bay (Han et al., 1995), and Jinhae Bay (Soh & Choi, 2004). Acartia, Paracalanus, Eurytemora, and Oithona are the predominant genera in terms of density, biomass, and daily copepod production in coastal areas (Miyashita et al., 2009); these genera can exploit other patterns of food in addition to phytoplankton and, thus, affect microbial food webs (Leandro et al., 2007; Uye & Shimazu, 1997; Uye at al., 2000).
In this study, copepod biomass and secondary production were calculated as carbon content for better comparison with the secondary production data estimated in different areas (Table 1). Owing to the lack of a relationship observed between dry weight and the carbon content for the different copepod species that comprise the Gamak Bay, it was estimated that 40% of the dry weight of all species as equivalent to carbon. We compared the products of secondary production between the Huntley and Lopez and Hirst and Bunker models, which resulted in different findings from the data values compiled from the present study. Further, applying the Huntley and Lopez model often leads to higher values than does the Hirst and Bunker model. Huntley and Lopez developed a temperature-dependent model; however, this model does not assume that food is limited during the year (Ara & Hiromi, 2007; Kimmerer & McKinnon, 1987; Peterson et al., 1991). Copepod growth rates can be related to somatic growth and reproductive rates, which are inferred from models based on physical rates and temperature (Huntley & Boyd, 1984; Huntley & Lopez, 1992), as well as temperature, body weight, and Chl-a concentrations (Hirst & Bunker, 2003). Different aspects affect the estimation of secondary reproduction; the Hirst and Bunker model incorporates a food descriptor (Chl-a concentration), while the Huntley and Lopez model tends to over evaluate growth rates (Kleppel et al., 1996). As stated by Hirst & Sheader (1997), such overvaluation can be explained by the fact that growth rates are obtained from in situ generation times, which may be biased since cohorts may grow non-standardly, and slowly growing individuals may exhibit higher mortality rates (Lopez, 1991).
| Location | Sampling gear | Biomass (mg C m−3) | Production rate (mg C m−3 d−1) | Production measured from | P/B ratio (d−1) | Source | |
|---|---|---|---|---|---|---|---|
| Mouth diameter (m) | Mesh opening size (µm) | ||||||
| Inland Sea, Japan | 0.45 | 94 | 12.9–20.2 | 2.83 | EM* by Ikeda & Motoda (1978) | 0.234 | Uye et al. (1986) |
| Fukuyama Harbor, Japan | 0.45 | 62 | 39.1 | 6.85 | EM by Liang et al. (1996a, 1996b) | 0.160 | Uye & Liang (1998) |
| Cananéia Lagoon estuarine system, Brazil | 0.5 | 150 | 19.76 | 5.28 | EM by Hirst & Lampitt (1998) | 0.267 | Ara (2004) |
| Sagami Bay, Japan | 0.45 | 200 | 8.85 | 0.94 | EM by Hirst & Lampitt (1998) | 0.106 | Ara & Hiromi (2007) |
| Mondego estuary, Portugal | 0.5 | 335 | 0.364 | 0.13 | EM by Huntley & Lopez (1992) | 0.359 | Gonçalves et al. (2015) |
| Gamak Bay, Korea | 0.45 | 200 | 6.86 ± 5.38 | 1.09 ± 0.85 | EM by Hirst & Bunker (2003) | 0.170 ± 0.05 | This study |
| 2.05 ± 1.63 | EM by Huntley & Lopez (1992) | 0.156 ± 0.03 | |||||
Coastal ecosystems are often characterized by a high copepod secondary production rate (Lugomela et al., 2001; Uye & Liang, 1998; Uye et al., 1986). The results obtained from this study for the copepod community Gamak Bay were lower than those encountered in other coastal regions, such as the Inland Sea, Japan (Uye et al., 1986), Fukuyama Harbor, Japan (Uye & Liang, 1998), Cananéia Lagoon estuarine system, Brazil (Ara, 2004), and Sagami Bay, Japan (Ara & Hiromi, 2007). The secondary production of copepods in the Seto Inland Sea, Japan was approximated as 2.83 mg C m−3 d−1 (Uye et al., 1986), those of Sagami Bay, Japan as 0.94 mg C m−3 d−1 (Ara & Hiromi, 2007), and secondary production values of 6.85 mg C m−3 d−1 were obtained for Fukuyama Harbor, Japan (Uye & Liang, 1998). Methods for copepod biomass estimation have been reported in different areas worldwide (Ara, 2004; Ara & Hiromi, 2007; Gonçalves et al., 2015; Uye & Liang, 1998; Uye et al., 1986). Copepod biomass in the present study was obtained from samples collected using plankton nets with a mesh diameters ranging from 62 to 335 µm (Table 1). The mesh size of the net could have had a significant effect on the proportion of developmental-stage copepods observed (Table 1). Using of a 200 μm plankton net for copepod sampling, as recommended by UNESCO (1968), unfortunately still biases of copepod biomass and diversity. Recently, methods for examining copepod biomass and production from several studies using small mesh nets (i.e., 50 μm) have documented the significance of small copepods in the coastal temperate region (Nielsen & Sabatini, 1996; Uye & Liang, 1998). This study focused on zooplanktic copepods (copepodid stage I to V, adult) (> 200 μm), excluding copepod eggs and nauplii. The life stages of small copepods (e.g., cyclopoida) were rare in the present samples. We suggest that this rarity was due to the deficient collection of smaller copepods, which would have passed through the 200 μm mesh size plankton net. Nevertheless, the annual mean biomass and secondary production data obtained in this study were comparable to those for other temperate regions, although the annual mean secondary production values in this study were relatively higher than those in Sagami Bay, Japan (Ara & Horimi, 2007). Further, we found a high instance of copepod production in Gamak Bay, despite the exclusion of small secondary producers (e.g., copepod nauplii, cyclopoids, and small harpacticoids), and copepods of smaller sizes (50–153 μm). It is important to note that net selectivity could have a significant effect on the calculated proportion of developing copepods in the environment. In Gamak Bay, temperature, salinity, and Chl-a concentrations typically exert important effects on copepod biomass and secondary production. Copepods are the dominant organisms in mesozooplankton communities, especially in coastal waters, which support the high production of calanoid copepods (Ara & Hiromi, 2007; Chisholm & Roff, 1990; David et al., 2006; Dias et al., 2015; Mauchline, 1998). Moreover, phytoplankton represent the main food source for most copepod species (Hirst & Bunker, 2003; Mauchline, 1998). Accordingly, these factors were considered in this study to establish their possible effects on the copepod secondary production in Gamak Bay. The results of this study indicate that a 200 μm net is sufficient to estimate the concentration and production of coastal copepods.
The biomass and secondary production of copepods calculated using both the Huntley and Lopez and the Hirst and Bunker models were lower than predicted, most likely owing to the large mesh size used (200 μm). Gamak Bay exhibited normal seasonal patterns of high copepod biomass during the summer and low copepod biomass during the winter. The production rate revealed the influence of seasonal variation, with higher values being observed in June and July. Seasonal changes in copepod biomass and secondary production in Gamak Bay were significantly influenced by variations in temperature, salinity, and Chl-a concentration. Further, it is possible to assume that regional factors, such as freshwater input, predation, and food limitation also had an effect on copepod biomass and secondary production. This study is the first attempt to estimate the biomass and secondary production of copepod communities in Gamak Bay. Further studies should be directed at individual species and to the definition of copepod production estimated by combining in situ data and specific environmental-dependent somatic growth models.
