Introduction
Groupers are schooling fish that inhabit both tropical and subtropical waters. They can be commonly found in coral reefs, near hard (rocky) bottoms, within seagrass beds, and on sandy areas. Grouper belongs to the Serranidae family and Epinephelinae subfamily. The Epinephelinae consists of 159 species of marine fishes that spread over 15 genera. According to Heemstra & Randall (1993), 110 species live in Indo-Pacific waters; meanwhile, Habibi (2011) states that 39 species of groupers can be found in Indonesian waters among 49 species in East Asia. Moreover, there are eight species of grouper found in Raja Ampat (Ariyanti & Farajallah, 2019). Grouper could be described as a fish that features a high variety of shapes and colours. This makes accurate identification of grouper challenging.
The morphological identification of grouper is usually based on colour, variations in morphology, and body patterns. Furthermore, overlapping meristic counts and significant changes throughout life stages cause misidentification in grouper species (Alcantara & Yambot, 2014;Craig et al., 2001; Ding et al., 2006; Heemstra & Randall, 1993). Morphological similarities indicate that certain distinct grouper species may be included in the same species description (Zhu & Yue, 2008). Grouper has many taxa and the massive circumtropical distribution that caused their initial identification is still unclear.
Nowadays, the DNA barcoding technique is used to overcome the issue in morphological identification and more limited misidentification for larval or adult stages (Waugh, 2007; Sachithanandam et al., 2012). However, genetic tools, especially molecular identification for various fish species, have been further developed throughout the past decade (Craig et al., 2009; De-Franco et al., 2012; Rodrigues et al., 2011; Ulrich et al., 2013; Veneza et al., 2014). The molecular method’s accuracy is almost 100%, which indicates that this technique will prove a specimens’ identification underneath entirely different environments (Meyer & Paulay, 2005). Thus, molecular information will assist in data information and breakdown group and evolution disagreements among the species. Phylogenetic identification can reconstruct relationships among each species that have a close relationship.
Phylogenetic identification is a method applied to view and model the proximity between species to accurately construct the relationships between organisms and estimate the differences between one ancestor and the offspring (Makarenkov et al., 2006). Jordan & Eigenmann (1890) constructed the relationships among the Serranidae by dividing individuals into six separate subfamilies: Serranidae, Epinephelinae, Latinae, Grammistinae, Anthiinae, and Percichthyinae. Furthermore, Katayama (1959) provided an intensive review of the Japanese serranids, recognizing fifteen subfamilies and reorganizing the family, setting the stage for nearly all subsequent revisions. The limitations of the study of phylogenetic relationships between serranids are still significant, given the complexity of this family’s groups.
Craig & Hastings (2007) mentioned that the molecular taxonomy and phylogenetic characteristics of groupers exhibited in the classification of Epinephelinae in the Indo-Pacific needs to be revised using the molecular approach, especially for several new genera. Currently, several studies related to the molecular taxonomy and phylogenetics of groupers have been conducted in Eastern Indonesia by Jefri (2015) and in Raja Ampat by Ariyanti & Farajallah (2019). Whereas in the Bird’s Head Seascape (BHS) of West Papua, the related data has not yet been catalogued, so that this research is required, especially as a fish database for a species that has an essential economic value in West Papua (Papua Barat). This study is expected to be able to contribute to fisheries management and conservation in West Papua, and broader Indonesia.
Methods
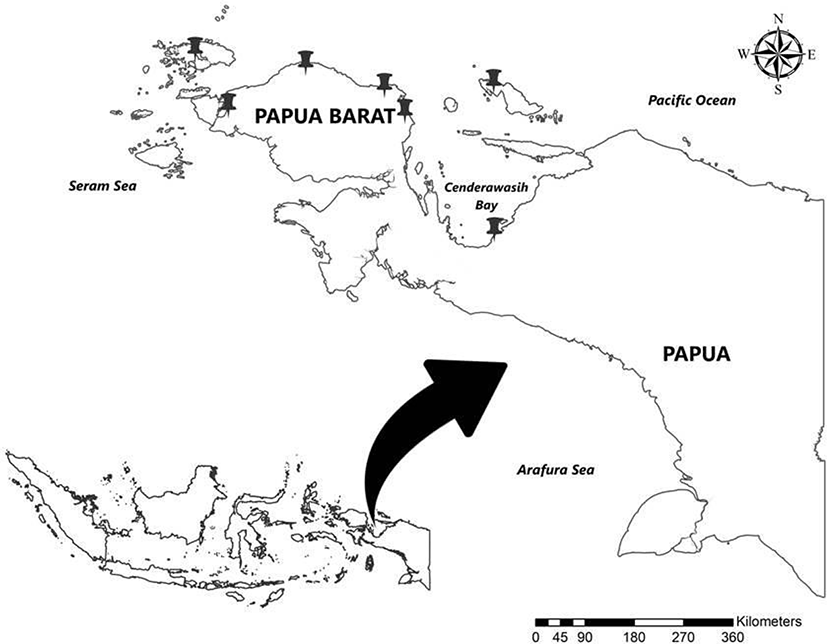
In total, 47 grouper samples were collected from a traditional market and the fish auction in the ports of Nabire, Supiori, Manokwari Selatan, Manokwari, Tambrauw, Sorong, and Raja Ampat (Fig. 1). Groupers were documented using a camera for initial identification purposes. 1–2 cm of dorsal or caudal fin was cut and placed in tubes. The tissue obtained was washed using sterile water and preserved in 96% ethanol.

The molecular character analysis procedure was done in several stages, including extraction, amplification, electrophoresis, and sequencing. Following the steps carried out in molecular character analysis, DNA extraction was performed using an extraction kit (Geneaid: gSYNC DNA Extraction Kit). The grouper tissue was then added to the reagent and incubated at 56°C until the tissue lysed, and separated using a centrifuge at 14,000×g to extract DNA from mitochondria. After a DNA template was generated from the extraction process, the sample was amplified at a denaturation temperature of 98°C, an annealing temperature of 57°C, and an extension temperature of 72°C in 35 cycles. The gene segment targeted COI with an amplified polymerase chain reaction (PCR) process by using a primer as follows: Fish R1-5’TAGACTTCTGGGT GGCCAAAGAATCA3’ and Fish F1-5TCAACCAACCACAAAGACATTGGCAC3’ (Sachithanandam et al., 2012). One μL DNA template was reacted to 12.5 μL My Taq HS Red Mix 2x, 10.5 μL ddH2O, primer forward and reverse, each 0.5 μL in DNA amplified process. This reaction follows the protocol from My Taq HS Red Mix. Furthermore, electrophoresis was carried out with 1.5% agarose gel, ethidium bromide dye (4 μL), and 1X 100 mL TAE solution at 100 V for 25 minutes. The electrophoretic band results can be seen using ultraviolet light on the UV transilluminator.
The sequencing results obtained were sorted by using the MEGA 7.0 program. All data was edited for alignment using a Clustal W program (Tamura et al., 2004). The prime DNA sequence analysis is then compared with the DNA in the database (gene bank) to confirm the species name obtained. Phylogenetic analysis was then performed by using neighbour-joining method, or Kimura 2-parameter evolution model and 1,000 times bootstrap replications. Bootstrap analysis was applied to test the stability of the phylogeny position of a particular clade in the phylogeny tree. The Kimura 2-parameter was used to analyse genetic distance with 1,000 bootstrap replications. The outgroup that was used in this study is Pseudochromis jamesi.
Results
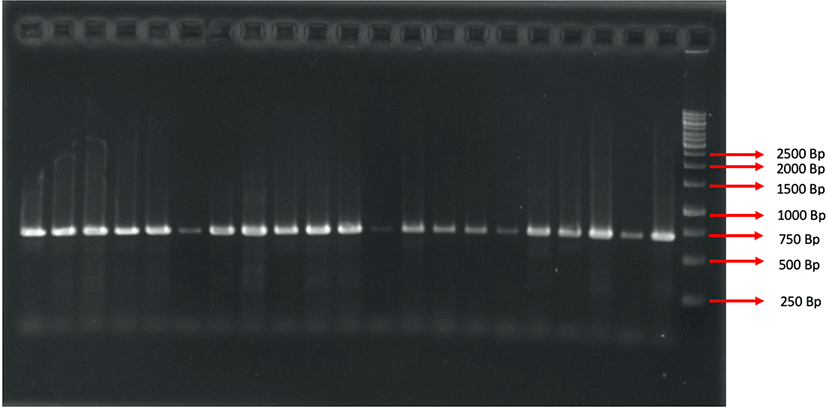
COI gene amplification resulted in a fragment of 623 base pairs (bp) (Fig. 2) in 47 Epinephelinae, consisting of five genera and 16 species. Basic Local Alignment Search Tool (BLAST) analysis from National Centre for Biotechnology Information (NCBI) showed a 98–99% similarity with Cephalopholis urodeta, Cephalopholis sexmaculata, Cephalopholis sonnerati, Cephalopholis miniata, Cephalopholis spiloparaea, Epinephelus morrhua, Epinephelus fuscoguttatus, Epinephelus merra, Epinephelus ongus, Epinephelus areolatus, Epinephelus fasciatus, Plectropomus laevis, Plectropomus areolatus, Plectropomus leopardus, Variola albimarginata, and Saloptia powelli. There were 37 DNA sequences of Epinephelinae added in the present study that originated from the NCBI (National Centre for Biotechnology Information) gene bank of several countries (Table 1).

Genetic distance is the ratio of genetic difference among species or population (Dogan, 2016). Genetic distance among the observed 16 species varied from 0.036 to 0.247 (Table 2). The closest genetic distance was found between Cephalopholis miniata and Cephalopholis sexmaculata (0.036), while the farthest observed was between Plectropomus laevis and Cephalopholis spiloparaea (0.247). Each genetic distance had a unique evolutionary relationship meaning it can show the similarities of each species. The shorter the genetic distance among species, the higher the similarity of these species (Nei, 1972).
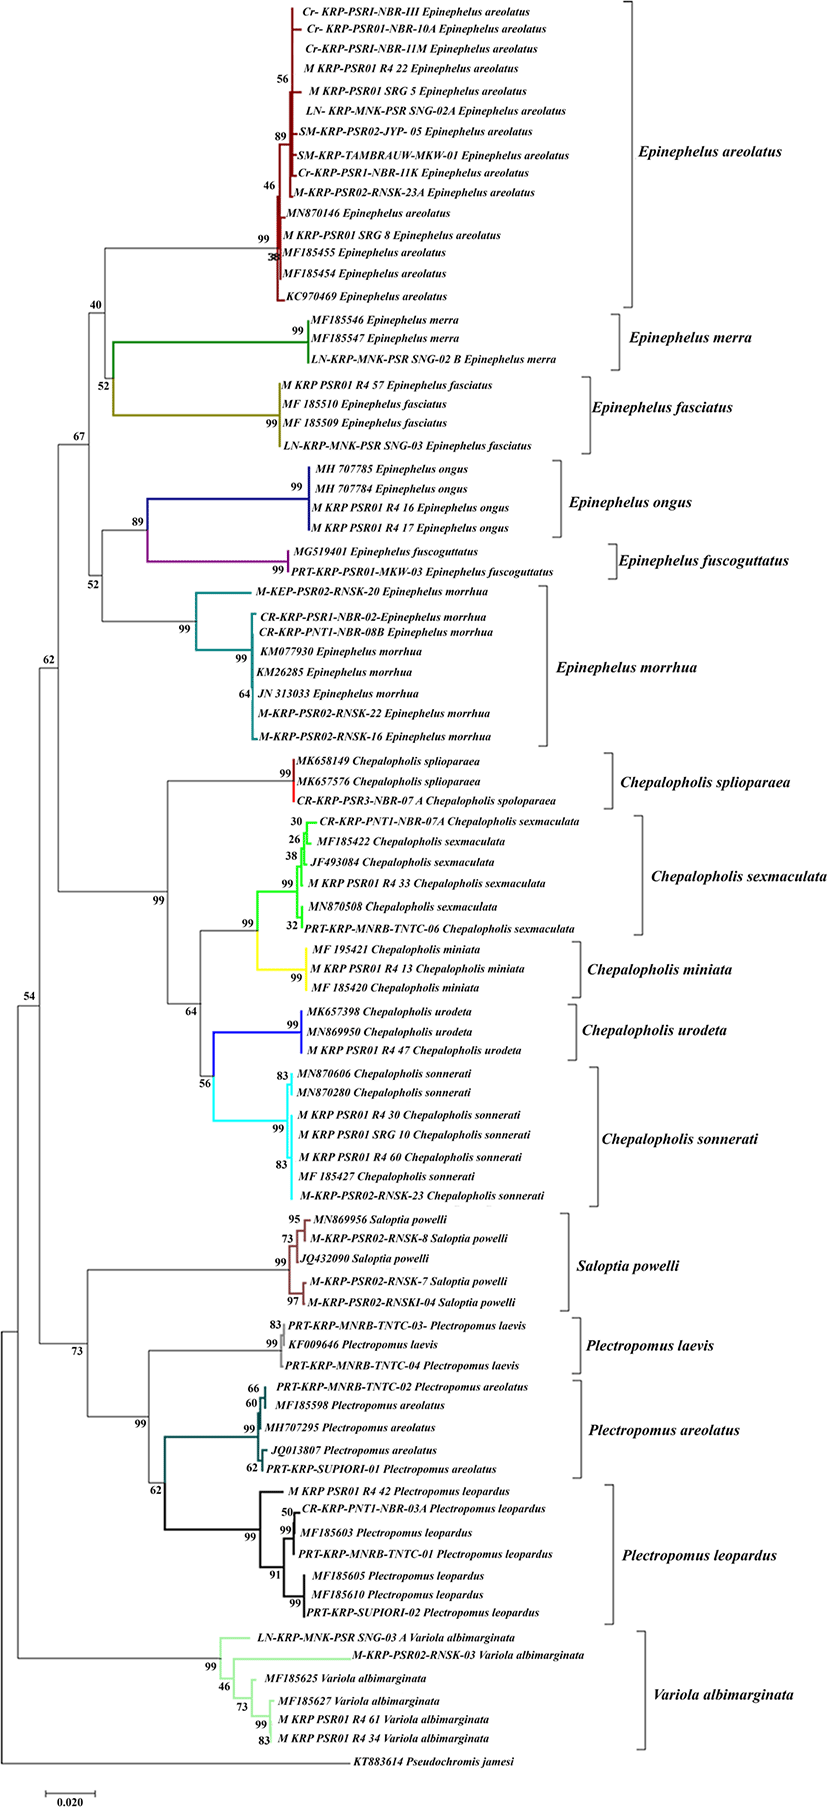
The present study built up a phylogenetic tree from a total of 47 groupers and 36 added DNA sequences obtained from the NCBI gene bank. The phylogenetic tree was reconstructed using the neighbour joining method and it showed an excellent phylogenetic tree that formed a clade with sequences from the gene bank. In addition, this was also indicated by the high bootstrap for each clade that reached 99% (Fig. 3). The phylogenetic tree analysis showed that there were 17 monophyletic clades consisting of Cephalopholis urodeta, Cephalopholis sexmaculata, Cephalopholis sonnerati, Cephalopholis miniata, Cephalopholis spiloparaea, Epinephelus morrhua, Epinephelus fuscoguttatus, Epinephelus merra, Epinephelus ongus, Epinephelus areolatus, Epinephelus fasciatus, Plectropomus laevis, Plectropomus areolatus, Plectropomus leopardus, Variola albimarginata, Saloptia powelli, and Pogonoperca punctata. The Cephalopholis genus formed two distinct monophyletic groups, namely the clade of Cephalopholis spiloparaea consisting of Cephalopholis sexmaculata, Cephalopholis miniata, Cephalopholis urodata and Cephalopholis sonnerati. The Saloptia genus formed monophyletic relationships with Plectropomus. While the Epinephelus genus formed 2 monophyletic clades.

Discussion
The short genetic distance in between Cephalopholis miniata and Cephalopholis sexmaculata showed that both species had a close genetic background. The close genetic background likely caused a high morphological similarity. This argument is in line with previous studies by Tallei & Kolondam (2015) and Mayr (1970) who reported that the closer genetic relationship in certain populations, the higher the frequency of morphological similarities observed. Cephalopholis miniata and Cephalopholis sexmaculata shared several morphological similarities, i.e., a rounded tail shape and the number of fin rays (III spines and 9 rays), and an orange-red body colour. Meanwhile, the farthest genetic distance was found between Plectropomus laevis and Cephalopholis spiloparaea. In terms of morphological characters, these two species had different tail shapes. Plectropomus laevis had an emarginate tail while Cephalopholis spiloparaea had a rounded tail. In addition, the body colour also differed both in Plectropomus laevis and Cephalopholis spiloparaea, i.e., pale black and pale reddish orange and mottled, respectively.
Although there was a colour difference, the colour characters could not fully be used as a main identifier because colour characters could be influenced by the area and habitat. This argument is in accordance with previous studies by Crandall et al. (2008), Hyde et al. (2008) and Mathews (2006) who reported that a widely distributed marine biota could have a high genetic variation. Groupers have an extensive distribution from tropical to subtropical areas and inhabit depths from 1 to 300 metres (Heemstra & Randall, 1993). The close genetic relationship between Cephalopholis miniata and Cephalopholis sexmaculata was also shown in the phylogenetic tree at Fig. 3 since both species formed a monophyletic clade with a bootstrap value of 99%. Meanwhile, the Plectropomus laevis and Cephalopholis spiloparaea formed a polyphyletic clade.
Molecular phylogenetic analysis could be used to support the results of morphological character analysis in certain species that were difficult to accurately identify using a morphological approach. The molecular approach was very important to perform in order to clarify the evolutionary relationship of species that were previously blurred due to morphological variations (Avise, 1994). Mitochondrial DNA (MtDNA) sequences could show a variation of DNA in a population, the changes of an individual during the breeding process and also the isolation of the population (Jarczak et al., 2019; Djong et al., 2007). The topological reconstruction of the phylogenetic tree was achieved using the neighbour joining method, or Kimura 2-parameter evolution model, due to its effectiveness for DNA barcoding analysis. This model also showed node stability and was able to represent topological relationships between taxa (Prasetya et al., 2011).
The results of the phylogenetic tree reconstruction showed 16 monophyletic clades consisting of certain species found in Raja Ampat, Sorong, Manokwari, South Manokwari, Supiori and Nabire. The Epinephelus genus formed two monophyletic clades consisting of clade Epinephelus morrhua, Epinephelus fuscoguttatus, Epinephelus ongus and clade Epinephelus merra, Epinephelus areolatus, Epinephelus fasciatus. Certain species such as Epinephelus fuscoguttatus, Epinephelus merra, Epinephelus ongus and Epinephelus fasciatus formed a monophyletic clade with sequences that have been added from the gene bank with a bootstrap value for about 99%. This finding confirmed that the Epinephelinae subfamily had a monophyletic clade. It also indicates that the species samples collected from the field were similar to the samples added from the gene bank.
Epinephelus morrhua originated from South Manokwari and it formed a paraphyletic clade with grouper samples from Nabire. It might be caused by the high genetic variation among the Epinephelus morrhua population. Akbar et al. (2018) reported that the furthest genetic distance of a species could be caused by a distribution pattern that allowed only a slight opportunity to encounter it, causing very limited to no gene flow between populations. Epinephelus morrhua was one certain species of grouper that commonly inhabited 80-370m sea depth (Heemstra & Randall 1993).
The Cephalopholis genus formed two distinct monophyletic groups, namely the Cephalopholis spiloparaea clade that consisted of Cephalopholis sexmaculata, Cephalopholis miniata, Cephalopholis urodata and Cephalopholis sonnerati. The Saloptia genus formed a monophyletic relationship to Plectropomus. The position of the grouping in our study was in accordance with the results of previous studies by Craig & Hasting (2007) and Schoelinck (2014) who showed that Saloptia had a monophyletic relationship with Plectropomus. In the present experiment, the COI gene provided a little support for deeper nodes in a phylogenetic analysis and it was excellent for reconstructing interspecific relationships.
The effort to reconstruct the phylogenetic tree of groupers (Epinephelinae) obtained from several sampling sites in the BHS of Papua succeeded in identifying the type of groupers that were caught and traded by fishermen in the fish market or at the ports. Also, the DNA barcoding was a very useful tool to identify certain species that were difficult to recognize morphologically. This tool could help the government to identify the fishery resources in certain areas. In addition, DNA barcoding was also very helpful in the quality monitoring process of economically important fish such as groupers (Schoelinck, 2014). Furthermore, this research is expected to be useful for policy making in managing sustainable capture fisheries in both Papua and West Papua.
Conclusion
Present phylogenetic studies using the mitochondrial cytochrome oxidase I (mtCOI) gene have succeeded to provide useful answers about phylogenetic relationships and morphological misidentification of grouper (Epinephelinae) species from the northern part of BHS of Papua. The results showed that there were 16 species inhabiting the BHS of Papua. The grouper molecular analysis showed a small difference in the position of the phylogenetic tree reconstruction and genetic distance values for several species. The closest genetic distance was observed between Cephalopholis miniata and Cephalopholis sexmaculata, while the farthest was between Plectropomus laevis and Cephalopholis spiloparaea. Morphological characters and genetic variation mostly influenced the genetic distance of grouper fish. There were five genera that represented a clade (monophyletic group), namely Epinephelus, Cephalopholis, Plectropomus, Saloptia and Variola.
