Introduction
The spotted scat (Scatophagus argus), also known as spotted spade fish, spotted butterfish, tiger scat, or argus fish, is one of the most commercially valuable fishes and most consumed in Asia (Barry & Fast, 1988). This brackish water aquarium fish is famous for its excellent nutrition value with high-quality protein and a significant amount of essential amino acids and non-essential amino acids (Anney & Antony, 1988; Sivan & Radhakrishnan, 2011; Vijayan et al., 2016). This species is mainly distributed throughout the Indo-Pacific range (Froese & Pauly, 2019). Carl Linnaeus (1766) described S. argus as the only species of Scatophagus group found in various parts of Vietnam, from north to south (Yen, 1992; Orsi, 1974).
DNA barcoding effectively identifies species and clarifies taxonomy by using short, standardized gene regions as internal species tags (Hebert & Gregory, 2005). Moreover, mitochondrial DNA (mtDNA) has been widely used in phylogenetic studies of animals because of the rapid and high rate of evolution compared to nuclear DNA, which has been reported to be more effective when it comes to understanding evolution (Brown et al., 1979; Mindell, 1997; Moore, 1995). mtDNA sequencing was first used for fish identification in 1991 to discriminate four species of tuna (Thunnus spp.) (Bartlett & Davidson, 1991). In 2003, Hebert et al. (2003) proposed that the mtDNA marker cytochrome c oxidase subunit I (COI) be used to identify animals, including fish (Frézal & Leblois, 2008; Hebert et al., 2003). The use of COI gene for discriminating many fish species in numerous higher taxa has been carried out by researchers around the world, showing the effectiveness for species-level identifications and indicating phylogenetic relationships (Ahmed et al., 2019; Ahmed et al., 2021; Chakraborty & Ghosh, 2014; Hubert et al., 2008; Lakra et al., 2009; Lakra et al., 2011; Zemlak et al., 2009; Zhang & Hanner, 2011; Zhang & Hanner, 2012). The COI barcode region was used to identify Diplostomum spp. in a sample of 497 metacercariae collected from various fishes across Canada. The COI sequences were superior to more commonly used internal transcribed spacer markers for identifying species (Locke et al., 2010). Hubert et al. (2008) showed the efficacy of COI barcodes for classifying nearly 200 species in North American freshwater fishes.
Although S. argus is considered to have high economic value in Vietnam, the studies on morphological, physiological, and reproductive characteristics of S. argus are quite limited. Dong (2012) observed weight and length, age, male to female ratio, reproductive characteristics, and food composition in the intestine of these fishes to identify some biological characteristics of S. argus (Linaeus, 1776) collected in Can Gio district, Ho Chi Minh city. The characteristics of the reproductive biology of S. argus collected from Thua Thien Hue, Quang Tri, Quang Nam province, and from the Mekong Delta, Vietnam, were also illustrated by Khanh et al. (2010) and Thuy et al. (2015), respectively.
Considering the lack of genetic diversity studies on S. argus in Vietnam and the competence of DNA barcode for species identification, this research was conducted to evaluate genetic diversity, determine molecular marker of spotted scat S. argus distributed in Thua Thien Hue province, and distinguish this species found in Thua Thien Hue from other locations.
Materials and Methods
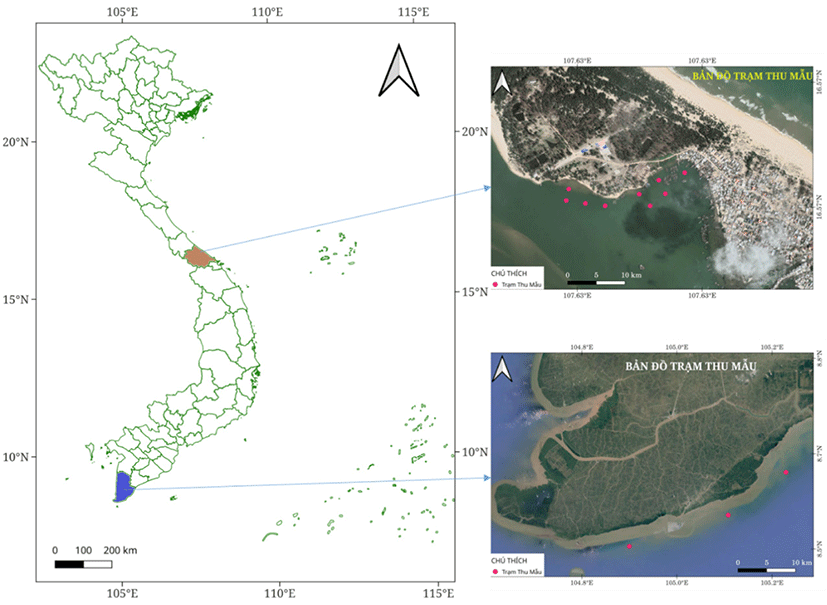
This study was conducted to sample in two locations in Thua Thien Hue province, central area, and Ca Mau province, Southern part, for genetic diversity comparison of spotted scat.
All samples were collected in April 2020. The samples in the central area were collected in the estuary area, adjacent to Thuan An sea inlet, located in the Tam Giang Lagoon ecosystem. This is the intersection between fresh water from the Huong River and saltwater from the sea. The water environment parameters change according to the rainy and sunny seasons. Around this area, agricultural production activities above the estuary area are mainly intensified rice production and freshwater fish cage farming. In the area near Thuan An sea inlet, fishing, brackish fish cage farming, and shrimp aquaculture farming are also developed. Environmental factors measured at the sampling point include temperature ranging from 28°C–30°C, Salinity: 19–24 ppt; water transparency 40–50 cm; pH: 7.8–8.5; alkaline 71.4–89.5 mg/L. While Ca Mau samples were collected around the mangrove forest in Ngoc Hien district, Ca Mau province. This area is typically characterized by ecological aquaculture in mangrove forests. This is a preserved mangrove ecosystem, so it is less affected by human activities. Environmental parameters were monitored in this area during sampling such temperature 27°C–29°C; pH 7.2–8.5; dissolved oxygen (DO) 3.5–5 mg/L; Salinity 8‰–29‰, water transparency 20–40 cm, alkaline 90–161 mg/L.
A total of thirty-one (n = 31) individually spotted scats S. argus were collected from Tam Giang Lagoon, Thua Thien Hue province (Central Vietnam) for this study. The samples had different origins and represented diverse types of fishes. Three samples were randomly collected from each type (Table 1). Fourteen adults spotted scats from Ca Mau province (Southern Vietnam) (CM_01–CM14) were used to determine molecular marker of distinguishing spotted scat from the Thua Thien Hue to the scats grown in other regions (Fig. 1). All fish sample age was less than 1+.
A 1 cm2 of caudal fin area of adult was sampled and stored in 96% alcohol at –30°C until further utilized at the Laboratory of Molecular Biology, Faculty of Fisheries, University of Agriculture and Forestry, Hue University, Vietnam.
Genomic DNA was extracted according to the procedure described by Adamkewicz & Harasewych (1996). Genomic DNA was stored in TE Buffer (10 mM pH 7.2 of Tris-HCl; 1 mM pH 8.0 of EDTA) at –20°C until analysis. The quantity and quality of extracted DNA were estimated by electrophoresis on 1.5% agarose gel and measured on spectrometers.
The fragments of COI gene of approximately 704 bp length located in the mitochondrial genome was amplified using the primer pair designed by Ward et al. (2005). The sequences of the primers are as follows: FishF1 (5’TCAACC AACCACAAAGACATTGGCAC3’) and FishR2 (5’ACTTCAGG GTGACCGAAGAATCAGAA3’).
The polymerase chain reaction (PCR) was performed in a total volume of 50 μL, including 10 µL TBE 1X buffer, 0.2 µL MyTaq HS Polymerase (Bioline), 0.4 µM forward primer and reverse primer, 5 ng DNA. PCR amplification was performed with denaturation for 1 min at 95°C; 27 cycles of 95°C for 15 seconds, annealing temperature 45°C for 15 seconds, 72°C for 15 seconds, and a final extension at 72°C for 10 min. PCR products were visualized on 1.0% agarose gels. The resulting mitochondrial COI gene fragments were purified using Wizard®SV Gel and PCR CleanUp System (Promega), according to the manufacturer’s recommendations. COI gene fragment sequencing was performed by First BASE Laboratories Sdn Bhd (Selangor, Malaysia).
Basic Local Alignment Search Tool software was used for similarity searching of the COI sequences in GenBank (http://blast.stva.ncbi.nlm.nih.gov/). For phylogenetic analyses, a total of 31 sequences were obtained from GenBank. The sequences generated in the forward and reverse directions were edited and aligned in BioEdit version 7.0 (Hall, 1999). The haplotype number (Nh), haplotype diversity (Hd), nucleotide diversity (π), number of polymorphic sites (S), number of mutations (η), and average number nucleotides differences (k) were calculated using DnaSP v6.12 (Rozas et al., 2017) with three replications for each test. In addition, Geneious Prime 2020 software was used to calculate genetic distances and to construct a maximum likelihood phylogenetic tree. The confidence level of the phylogenetic trees was evaluated with 1,000 replications.
Results
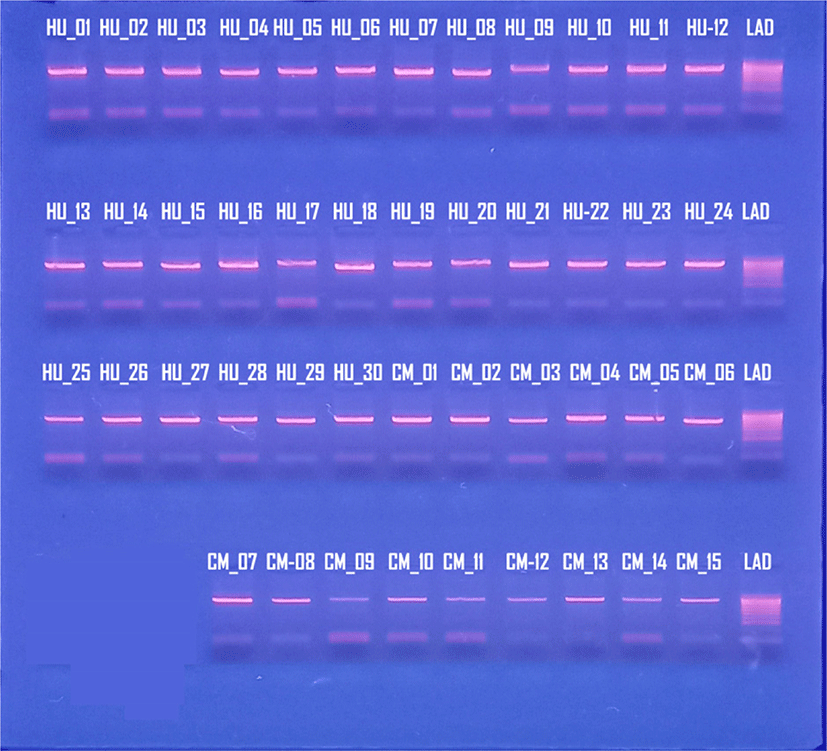
The products of PCR amplification were tested by electrophoresis on agarose gel (Fig. 2). Only one amplicon of each sample was produced within the theoretical range (700–1,000 bp).
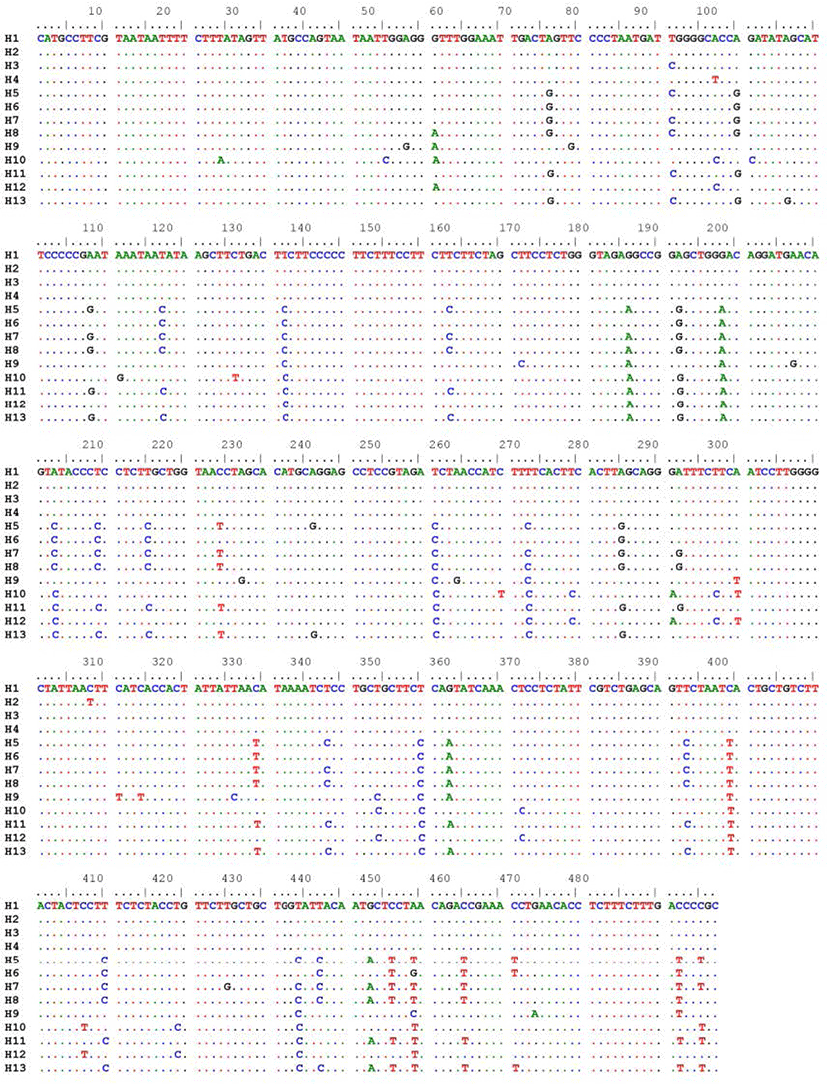
The 437 bp partial COI length fragment of mtDNA COI gene was obtained from 45 individuals of spotted scat S. argus. Sequencing of COI fragments revealed the presence of 13 haplotypes among 45 individuals. Spotted scat population of Thua Thien Hue exhibited four haplotypes (H1, H2, H3, H4), while spotted scat population of Ca Mau displayed nine haplotypes (H5, H6, H7, H8, H9, H10, H11, H12, H13) (Table 2).
The result of alignment on 45 sequences COI gene fragment showed 64 substitutions of nucleotide bases including transitions and transversions. No insertion and deletion were found (Fig. 3). The present sequencing result showed the significant genetic differences of S. argus between Thua Thien Hue and Ca Mau regions. This difference might be attributed to the genomic features of spotted scat populations in these two locations. Moreover, five single nucleotide polymorphisms (SNPs) that were sufficient to distinguish Hue spotted scat population were identified (Table 3).
| Nucleotide substitution position | SNP of Hue population | SNP of Ca Mau population |
|---|---|---|
| 132 | T | C |
| 188 | G | A |
| 251 | T | C |
| 350 | T | C |
| 389 | C | T |
The analytical result in Table 4 shows that haplotype diversity (Hd) and SD of 45 sequences of COI gene fragment at Hue and Ca Mau were 0.187 ± 0.093 and 0.879 ± 0.079, respectively. The mean nucleotide diversity (π) and SD were 0.00040 ± 0.00020 for Thua Thien Hue population and 0.03292 ± 0.00915 for Ca Mau population. Genetic variability of S. argus in Ca Mau compared to Hue was higher as revealed by haplotypes and nucleotide diversity values. Specifically, the haplotype diversity of Ca Mau population was five times higher than Thua Thien Hue population. Furthermore, the nucleotide diversity of Ca Mau population was 82 times higher than Hue population.
The COI gene fragment analysis showed that 45 specimens of S. argus were approximately 92.2%–100% homologous, and the genetic distances were reported between 0%–8.47%. Analysis of COI sequences of 14 specimens from Ca Mau province showed identity of 92.2%–100% and the average genetic distance was 3.5%. Similarly, 31 specimens from Hue demonstrated identity of 99.79%–100% and average genetic distance was 0.04%. The results showed that the value of genetic identity between two populations was relatively high (92.2%–100%), while the value of genetic distance was only 3.27% on average. Within the populations, genetic distances ranged from 0%–4%, while the genetic distance between the two populations was 6.67% (Table 5).
| Population | Hue | Ca Mau |
|---|---|---|
| Hue | *** | |
| Ca Mau | 0.0667 | *** |
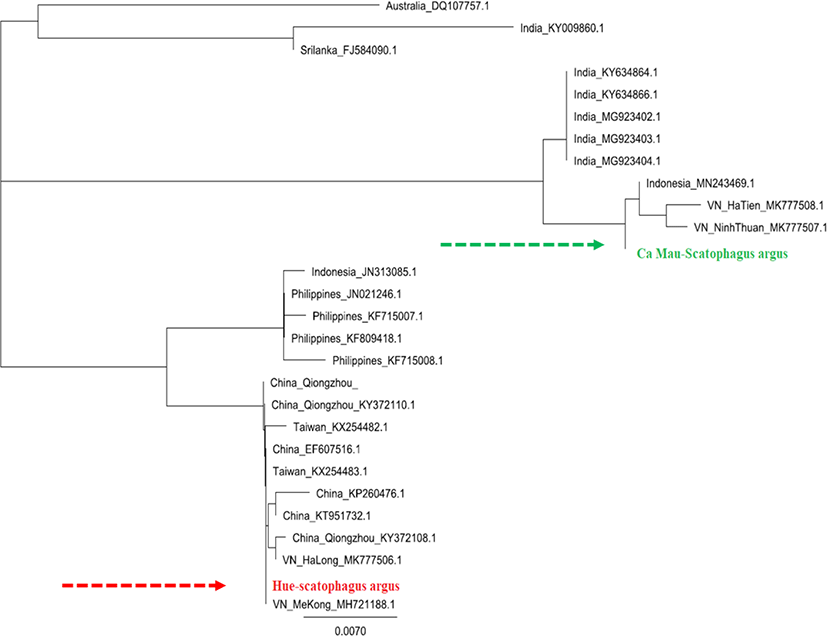
Based on the sequence of COI gene segments of S. argus individuals in Hue, Ca Mau, and the reference sequences taken from GenBank, phylogenetic tree was built using Geneious Prime 2020 software (Fig. 4). The observations generated using COI gene fragments revealed the high polymorphic levels and the genetic relationship of two populations of S. argus collected in Hue and Ca Mau, Vietnam.
The results obtained from local people revealed that the S. argus in Hue displays different colors and traits from the S. argus in the south (Ca Mau) in terms of morphology, biology, and culture. A spotted scat from Hue has a light silver skin with large and sparse polka dots, while a spotted scat from Ca Mau has a dark skin with thin dots (Fig. 5).
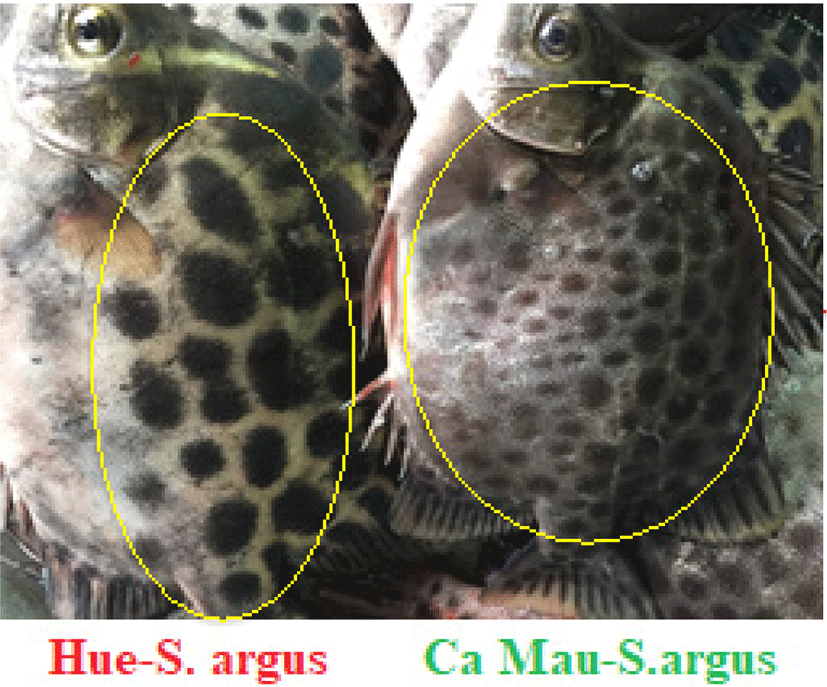
When the growth rates of both populations in the same pond were compared at the same age, Hue’ spotted scat grew faster. S. argus from Ca Mau grew slowly after reaching size of 100–150 g. In this size stage, the growth performance of Hue’ spotted scat was 1.35 times higher than Ca Mau’ spotted scat. On the other hand, the spotted scat of Ca Mau matured earlier, but its size was smaller than that of Hue. In the same pond of brood stock management, Ca Mau’ spotted scat was able to reach maturity in April, while Hue’ spotted scat matured during June and July. Compared to S. argus of Hue, the spotted scat of Ca Mau was abundant. This may be due to the difference in the climate conditions between the Central and Southern Vietnam.
Discussion
S. argus is a new potential candidate for aquaculture in Vietnam because of its high nutritional value and protein content. The number of haplotypes of this brackish water aquarium fish in our study was higher than the haplotypes of Nile Tilapia, Oreochromis niloticus, from Egypt (Mohammed-Geba et al., 2017) but lower than the haplotypes of spotted scat S. argus from the South China Sea (Yan et al., 2020). However, the difference between haplotype numbers from different regions could be due to the differences in sample sources, numbers and the length of COI gene sequences (Ma et al., 2011). All haplotypes appeared in a single population, indicated both studied populations diverged from each other (Table 2). High haplotype diversity and low nucleotide diversity were illustrated in both populations, which was consistent with some previous reports, such as those from Cyprinidae fish from Yangtze River, China (Shen et al., 2016), some freshwater fish species in Turkey (Keskin et al., 2013), and Lateolabrax maculatus from southeast coastal regions of China (Wang et al., 2017). The association between high haplotype diversity and low nucleotide diversity is common in marine and freshwater fishes (Liu et al., 2015; McCusker & Bentzen, 2010). Haplotype and nucleotide diversity threshold values in marine fish can be divided into low and high, with a haplotype diversity of 0.5 and a threshold nucleotide diversity of 0.005 (Chandran et al., 2020). Accordingly, the haplotype diversity and nucleotide diversity of S. argus were 0.879 and 0.0329 in Ca Mau province and 0.187 and 0.0004 in Thua Thien Hue province. Therefore, the S. argus population in the South of Vietnam is considered to have a high haplotype and nucleotide diversity, but the S. argus population in Central Vietnam has lower genetic diversity. In addition, these S. argus populations in the present study have a lower genetic diversity than seven S. argus populations from the northern coast of the South China Sea (Peng et al., 2021). The higher genetic diversity of samples in the Ca Mau area than the Hue group is attributable to the impact of human activities (see sample collection area section). Aquaculture, rice production, and fishing activities in and around the sample area in Thua Thien Hue have led to a decline in biodiversity (Gregory & Witt, 2008). Life‐history characteristics, habitat, and environmental factors are also essential distributors in shaping fishes’ genetic diversity patterns (Martinez et al., 2018). Recently, the use of SNPs for ecology and conservation biology studies is increasing (Morin et al., 2004; Seeb et al., 2011). Therefore, finding SNPs of spotted scats among two populations (Table 3) could contribute to developing genetic markers for further studies in population genetics.
The phylogenetic tree showed that S. argus from Hue and Ca Mau samples were clustered into two distinct groups. While the Hue-S. argus was clustered in one group with S. argus from China, Taiwan, Ha Long, and Me Kong, Vietnam from the GenBank, the CaMau-S. argus was grouped with S. argus from Indonesia, Ha Tien, and Ninh Thuan, Vietnam from the GenBank. This result demonstrated that the samples from Hue have unique genomic features separating this subpopulation from Ca Mau populations.
Conclusion
The sequencing results from 45 sequences of two population samples in Vietnam indicated 13 distinct haplotypes. Five SNPs were observed to distinguish Hue spotted scat population. The S. argus population in Ca Mau province was higher haplotype diversity (Hd) and nucleotide diversity (π) than those of Thua Thien Hue province. Genetic distances ranged from 0%–4% within the populations and 6.67% between the two populations. In addition to the sequencing, the comparison of morphology, biology, culture, and the growth rate was sufficient to distinguish the spotted scat S. argus in Thua Thien Hue from Ca Mau. Accordingly, the lower genetic diversity of S. argus in Thua Thien Hue province than in Ca Mau province is related to human activities and different habitats.
