
Introduction
Coral reef fisheries are a significant economic asset of the coastal community. In large archipelagic countries, such as Indonesia and the Philippines, coastal communities’ food and livelihood security depend on coral reef fisheries and tourism (Cabral & Geronimo, 2018). However, many of these resource exploitations are unsustainable due to poor management implementation or even a lack of management plan (Teh et al., 2015). This anthropogenic disturbance is usually unavoidable owing to the high population density with low income in the coastal community. Increasing frequency of coral bleaching occurrence (Bachtiar & Hadi, 2019; Stuart-Smith et al., 2018), unsustainable fisheries, and habitat degradation escalate the vulnerability of the coastal community to climate change (Hoegh-Guldberg et al., 2018).
Coral reefs provide a wide range of ecological niches to many functional groups of coral reef fishes (Gilmour et al., 2013; Russ et al., 2021). Reef structures provide food and shelter for herbivore and invertivore fishes and hide them from predatory fish (Foo et al., 2021). Fleshy algae provide food for herbivores at various scales (review in Williams et al., 2019). Herbivore and planktivore fishes provide resources for carnivore fish (piscivores). Loss of coral covers may harm corallivore fish but on the other hand, may have a positive impact on herbivore fishes (Gilmour et al., 2013). It is therefore essential to understand which altered coral reef substrate may impact which fish.
It has been widely accepted that coral reef fishes are to some degree dependent on their habitat, the coral reef. Therefore, some properties in coral reefs should show a causal relationship with fish diversity, abundance, or biomass. Among many biophysical reef substrates, the importance of coral cover has drawn public attention for a long time (Russ et al., 2021). Coral cover and habitat complexity are directly correlated to fish biomass, abundance, and diversity in Venezuela reefs (Agudo-Adriani et al., 2019). Russ et al. (2021) provided strong evidence that hard coral cover is a strong predictor for total coral reef fish biomass in the Philippines reefs. Among the trophic levels, hard corals significantly affect the biomass of corallivores, planktivores, piscivores, omnivores, and small benthic foragers. In the Great Barrier Reefs, coral bleaching in 2016 changed the coral-algal composition and invertebrate communities resulting in changes in coral reef fishes (Stuart-Smith et al., 2018). Besides coral cover, biophysical substrates of coral reefs consist of many biological components (hard coral, soft coral, algae, sponge, and other invertebrate fauna) and physical sediments (sand, silt, rock).
The present study aimed to understand which biophysical substrate variables in coral reefs serve as good predictors for fish diversity, abundance, and biomass. Coral reef fish communities show a complex interaction among trophic or functional groups and scales in the same guild. Many coral reef fish communities are not directly dependent on coral covers. Herbivore fish may temporarily increase or remain the same when coral bleaching caused a large reduction in coral cover (Huntington et al., 2011). Coral bleaching did not affect planktivore fish and therefore they still could provide food to piscivore fish (Morais & Bellwood, 2019). Coral reef fishes also have various modes of living. It is necessary to elaborate on our understanding of the role of the substrate on coral reef fish communities. There have been several studies to link fish diversity and abundance with environmental factors using multivariate variables (Mellin et al., 2010; Sartori et al., 2021; Sequeira et al., 2016), but the present study may be the first to link fish diversity, abundance, and biomass with biophysical variables. The fish variables were also divided into three trophic levels, i.e., corallivores, herbivores, and carnivores (invertivores + piscivores). Targeted fish (herbivores + carnivores) was also checked as this group is the most related reef inhabitant to coastal fisheries.
Materials and Methods
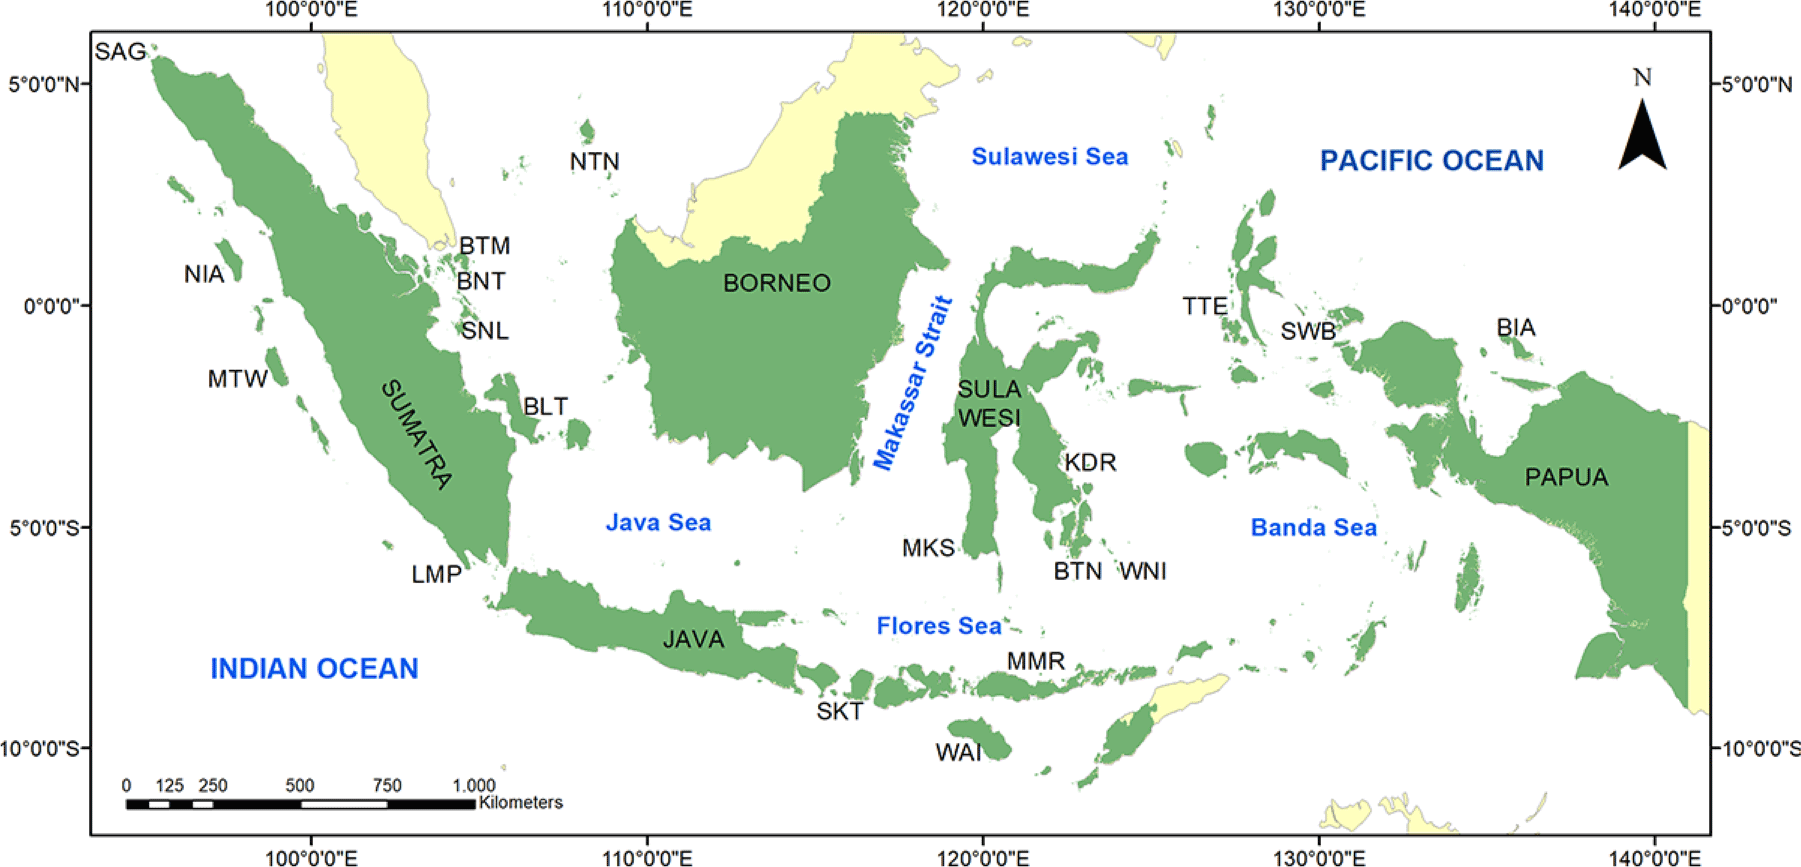
The study used the monitoring data collected in 2018 by the Research Center for Oceanography (RCO), National Board for Research and Innovation (BRIN, formerly LIPI). The coral reef data were collected in 19 locations (Fig. 1) span across the archipelago of Indonesia representing the eastern Indian Ocean (Sabang, Mentawai, Nias Utara, Lampung, Lombok, Sumba), the western Pacific Ocean (Biak, Salawati or Raja Ampat, Ternate), the Karimata Sea (Natuna, Batam, Bintan, Lingga, Belitung), and the Flores Sea (Makasar, Maumere, Buton, Wakatobi, Kendari). Data collection was carried out by different research teams, that involved six state universities and research institutes. All data collectors are certified by the National Board for Professional Certification (BNSP) and were supervised by researchers of the RCO-BRIN during field trips.
Underwater photo quadrate was used to collect coral reef biophysical data. Data were collected from 245 transects laid down 6–8 m depth of the reef slope. Coral reef substrate and fish data were taken from the same transect with different lengths, 50 m for biophysical substrates and 70 m for fish data. Each 50 m transect contained 50 pictures in the metal frame quadrate with 44 × 55 cm2 size. The pictures were analyzed using the CPCe 4.1 software (Kohler & Gill, 2006) to estimate the percent covers of 13 biophysical variables (Table 1). Percentage covers of biophysical variables were estimated using 30 randomly selected points in the software.
Underwater visual census was performed on the same transect to collect data on fish diversity, abundance, and biomass. The size of the belt transect was 70 × 5 m2. Fish data collection included corallivore, herbivore, and carnivore fishes (Table 1). The corallivore fish comprised the Chaetodontidae family members. The herbivore fish consisted of three families, i.e., Siganidae, Scaridae, and Acanthuridae. The carnivore fish included four families, i.e., Haemulidae, Lutjanidae, Lethrinidae, and Serranidae. Both herbivore and carnivore fishes were also grouped altogether as the targeted fish variable since both fishes are the main target of local fishermen. Fish biomass was appraised using the total length estimated in situ by a diver during the underwater survey (Yulianto et al., 2015). The distance between the diver and size-estimated fish was about 2–3 m. Fish total length is defined as the hiatus between the tip of the snout and the tip of the tail. The total length was converted into biomass using the allometric length-weight equation:
W is the weight (grams) and L is the total length (cm). The values of constants a and b were obtained from Froese & Pauly (2000).
Data analysis was carried out using principal component analysis (PCA) and multiple regression analysis (MRA). PCA was performed to look at the relationship vectors among 13 substrate metrics and 11 fish variables. All data were normalized before the application of PCA. MRA was applied to determine the best predictors for each 11 fish variables. Data transformation using log-10 was performed to homogenize the variances before the application of MRA, as collected data has different scales, from the percentage of coverage to tens of thousands of fish biomass (gram). PCA was carried out using Primer 6.2, Primer-E Ltd. (Plymouth, UK), while MRA was performed using JMP-Pro 13.0.0, SAS Institute (Cary, NC, USA).
Results
In the Indonesian Archipelago, reef fish predominance and prevalence did not show a specific pattern. Corallivore fish was predominated by Chaetodon octofasciatus. Coral reefs with a high abundance of C. octofasciatus were found at Batam, Bintan, Belitung, and Lingga. All four locations are situated in the Sunda Shelf. The most prevalent corallivore fish was Chaetodon vagabundus. In contrast, C. vagabundus was absent in the four locations with a high abundance of C. octofasciatus. There were two herbivore fishes that showed the highest abundance in the archipelago, Ctenochaetus striatus and Naso hexacanthus. Coral reefs hosted a high abundance of C. striatus were found at Wakatobi, Biak, and Buton. The fish N. hexacanthus, however, was very unevenly distributed. Two locations, Biak and Wakatobi, showed their predominant in the composition of total N. hexacanthus abundance, i.e., Biak (70%) and Wakatobi (26%). The most prevalent herbivore fish were Chlorurus sordidus and Scarus ghobban. Both fish were present nearly in all locations. Carnivore fish were predominated by Lutjanus biguttatus, which was found mostly at Ternate reefs. The most prevalent carnivore fish was Lutjanus decussatus. The prevalent carnivore fish was not found on coral reefs of Batam, Lingga, and Belitung. The absence in the distribution of the carnivore L. decussatus was quite similar to the corallivore C. vagabundus.
The biophysical substrate of the Indonesian coral reefs was mainly predominated by two groups, dead-coral-algae (DCA) and hard coral (HC). The mean (± SE) of DCA and HC covers were 38.68 ± 1.10% and 27.12 ± 0.99%, respectively (Fig. 2A). HC consists of acroporid coral (AC) and non-AC (NAC). The coverage of AC was much lower than the NAC, 3.46 ± 0.42% and 23.67 ± 0.93%, respectively. Rock (R) and sand (S) covers were about the same, i.e., 9.53 ± 0.58% and 10.17 ± 0.69%, respectively. Other biophysical substrates had less than 5% covers, including soft coral (SC), sponge (SP), fleshy algae (FS), and other-fauna (OT). Bare coral reef substrate (RK) cover was only 0.62 ± 0.23%. Coral reefs at 11 out of 19 locations had an average coral cover of > 25% (Appendix Table A1). The highest coral cover was found in Batam with an average of 37.87 ± 2.59%.
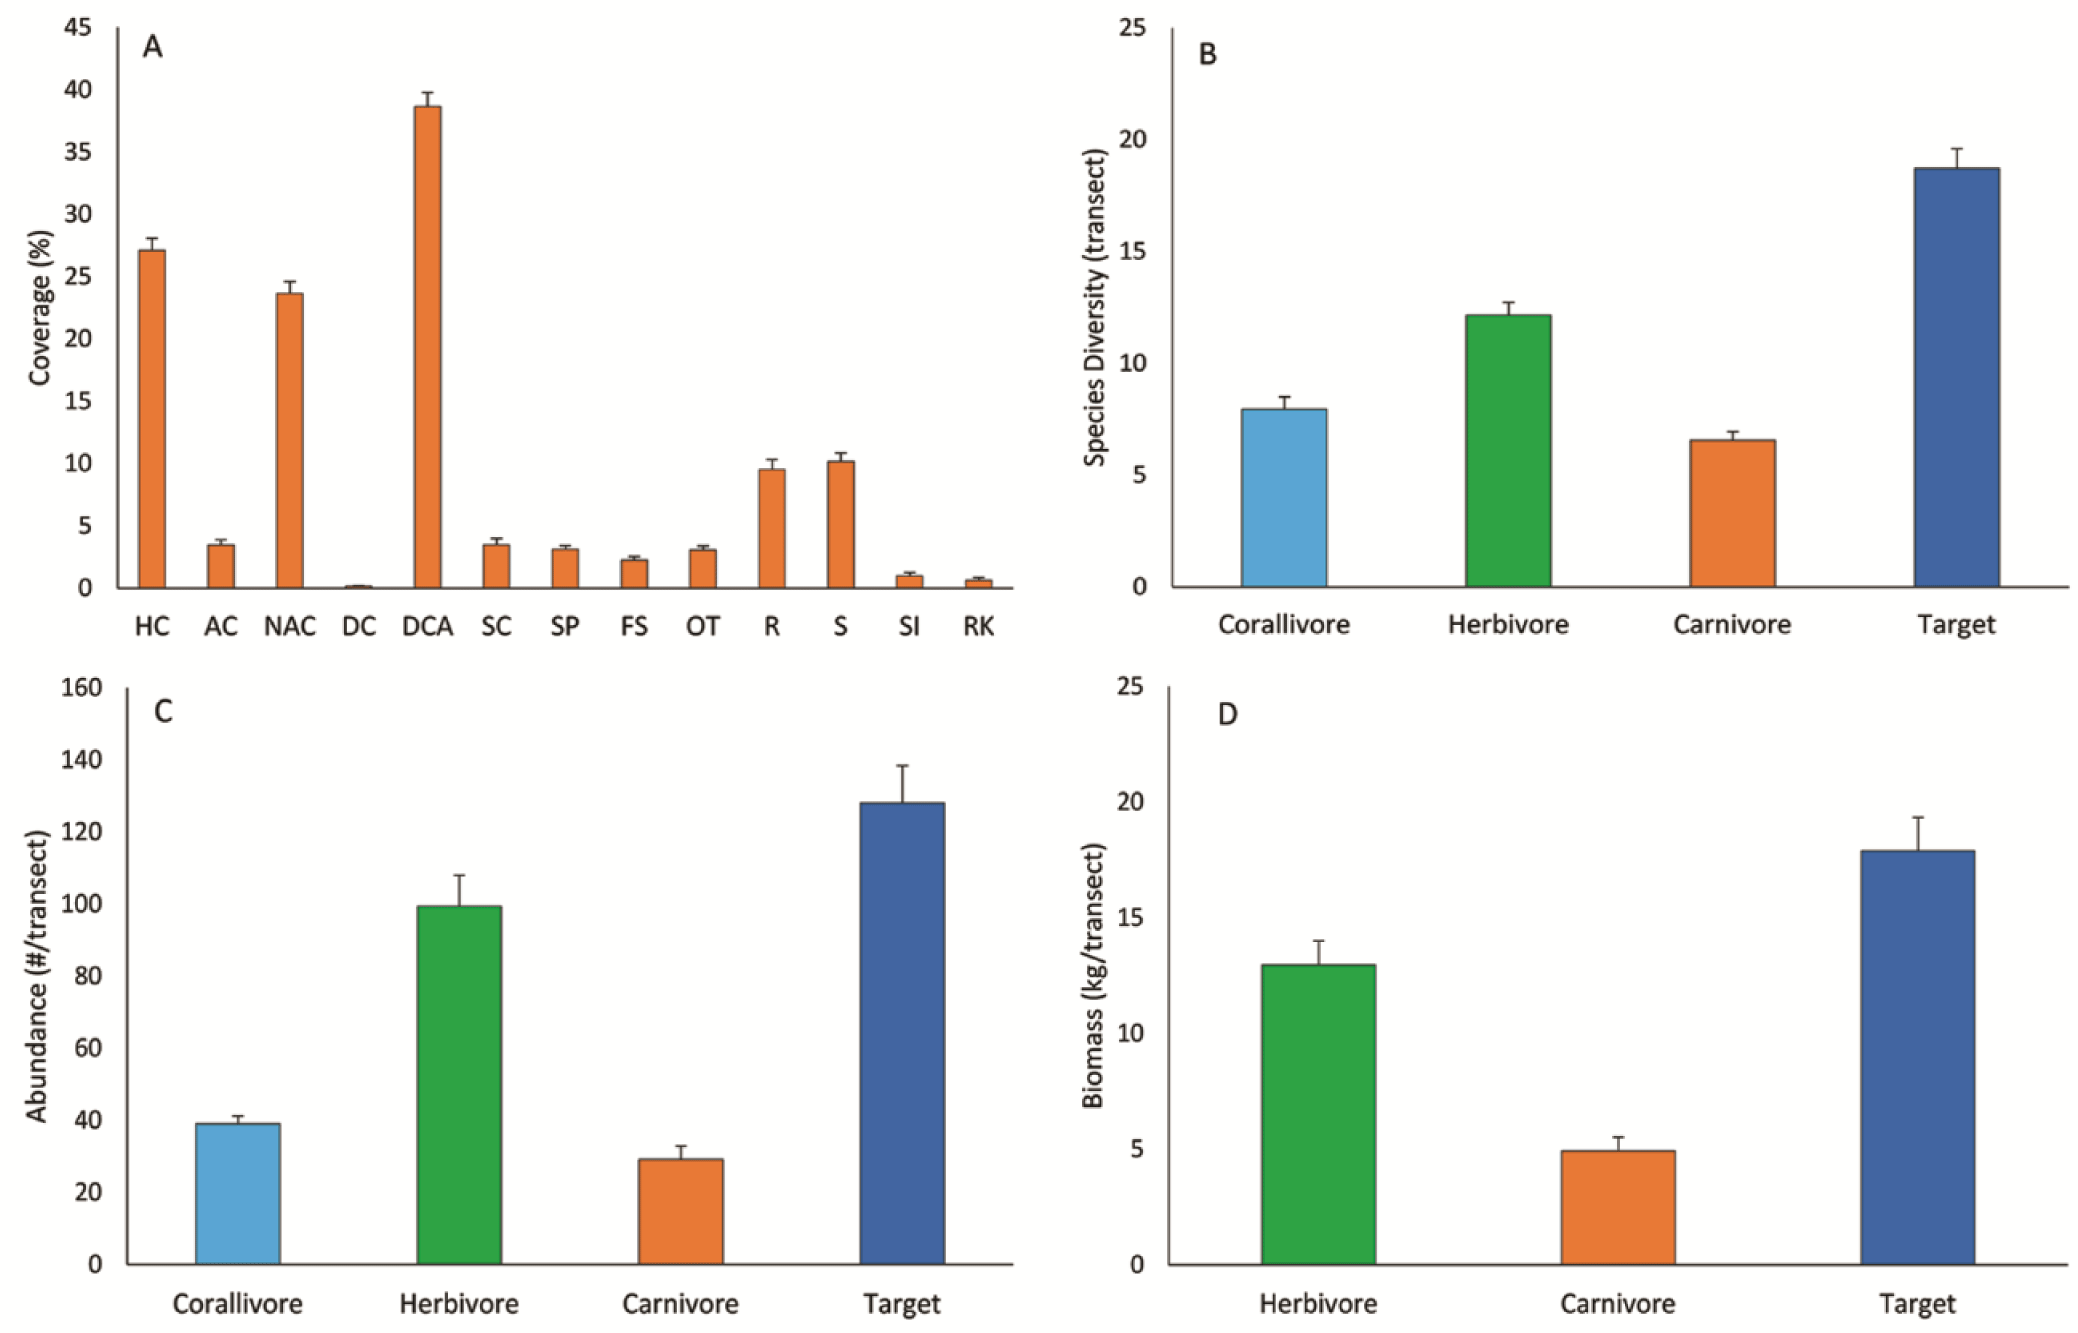
Herbivore fish was predominant among the three trophic levels, having the highest diversity, abundance, and biomass. The diversity of the herbivore fish was twice as the carnivore fish, i.e., 12.16 ± 0.56 and 5.56 ± 0.38 species/transect respectively (Fig. 2B). The abundance of the herbivore fish (99.41 ± 8.54 individuals/transect) was three times higher than the carnivore (29.19 ± 3.74 individuals/transect) (Fig. 2C). This abundance marked herbivore fish had biomass 2.62 times higher than the carnivores (Fig. 2D), 12.96 ± 1.04 and 4.93 ± 0.59 kg/transect respectively. The diversity and abundance of the corallivore fish were between the herbivores and carnivores. Among the 19 locations studied, Biak showed its predominance in the herbivore fish abundance, while Wakatobi was predominant in the corallivore and carnivore fish (Appendix Table A2).
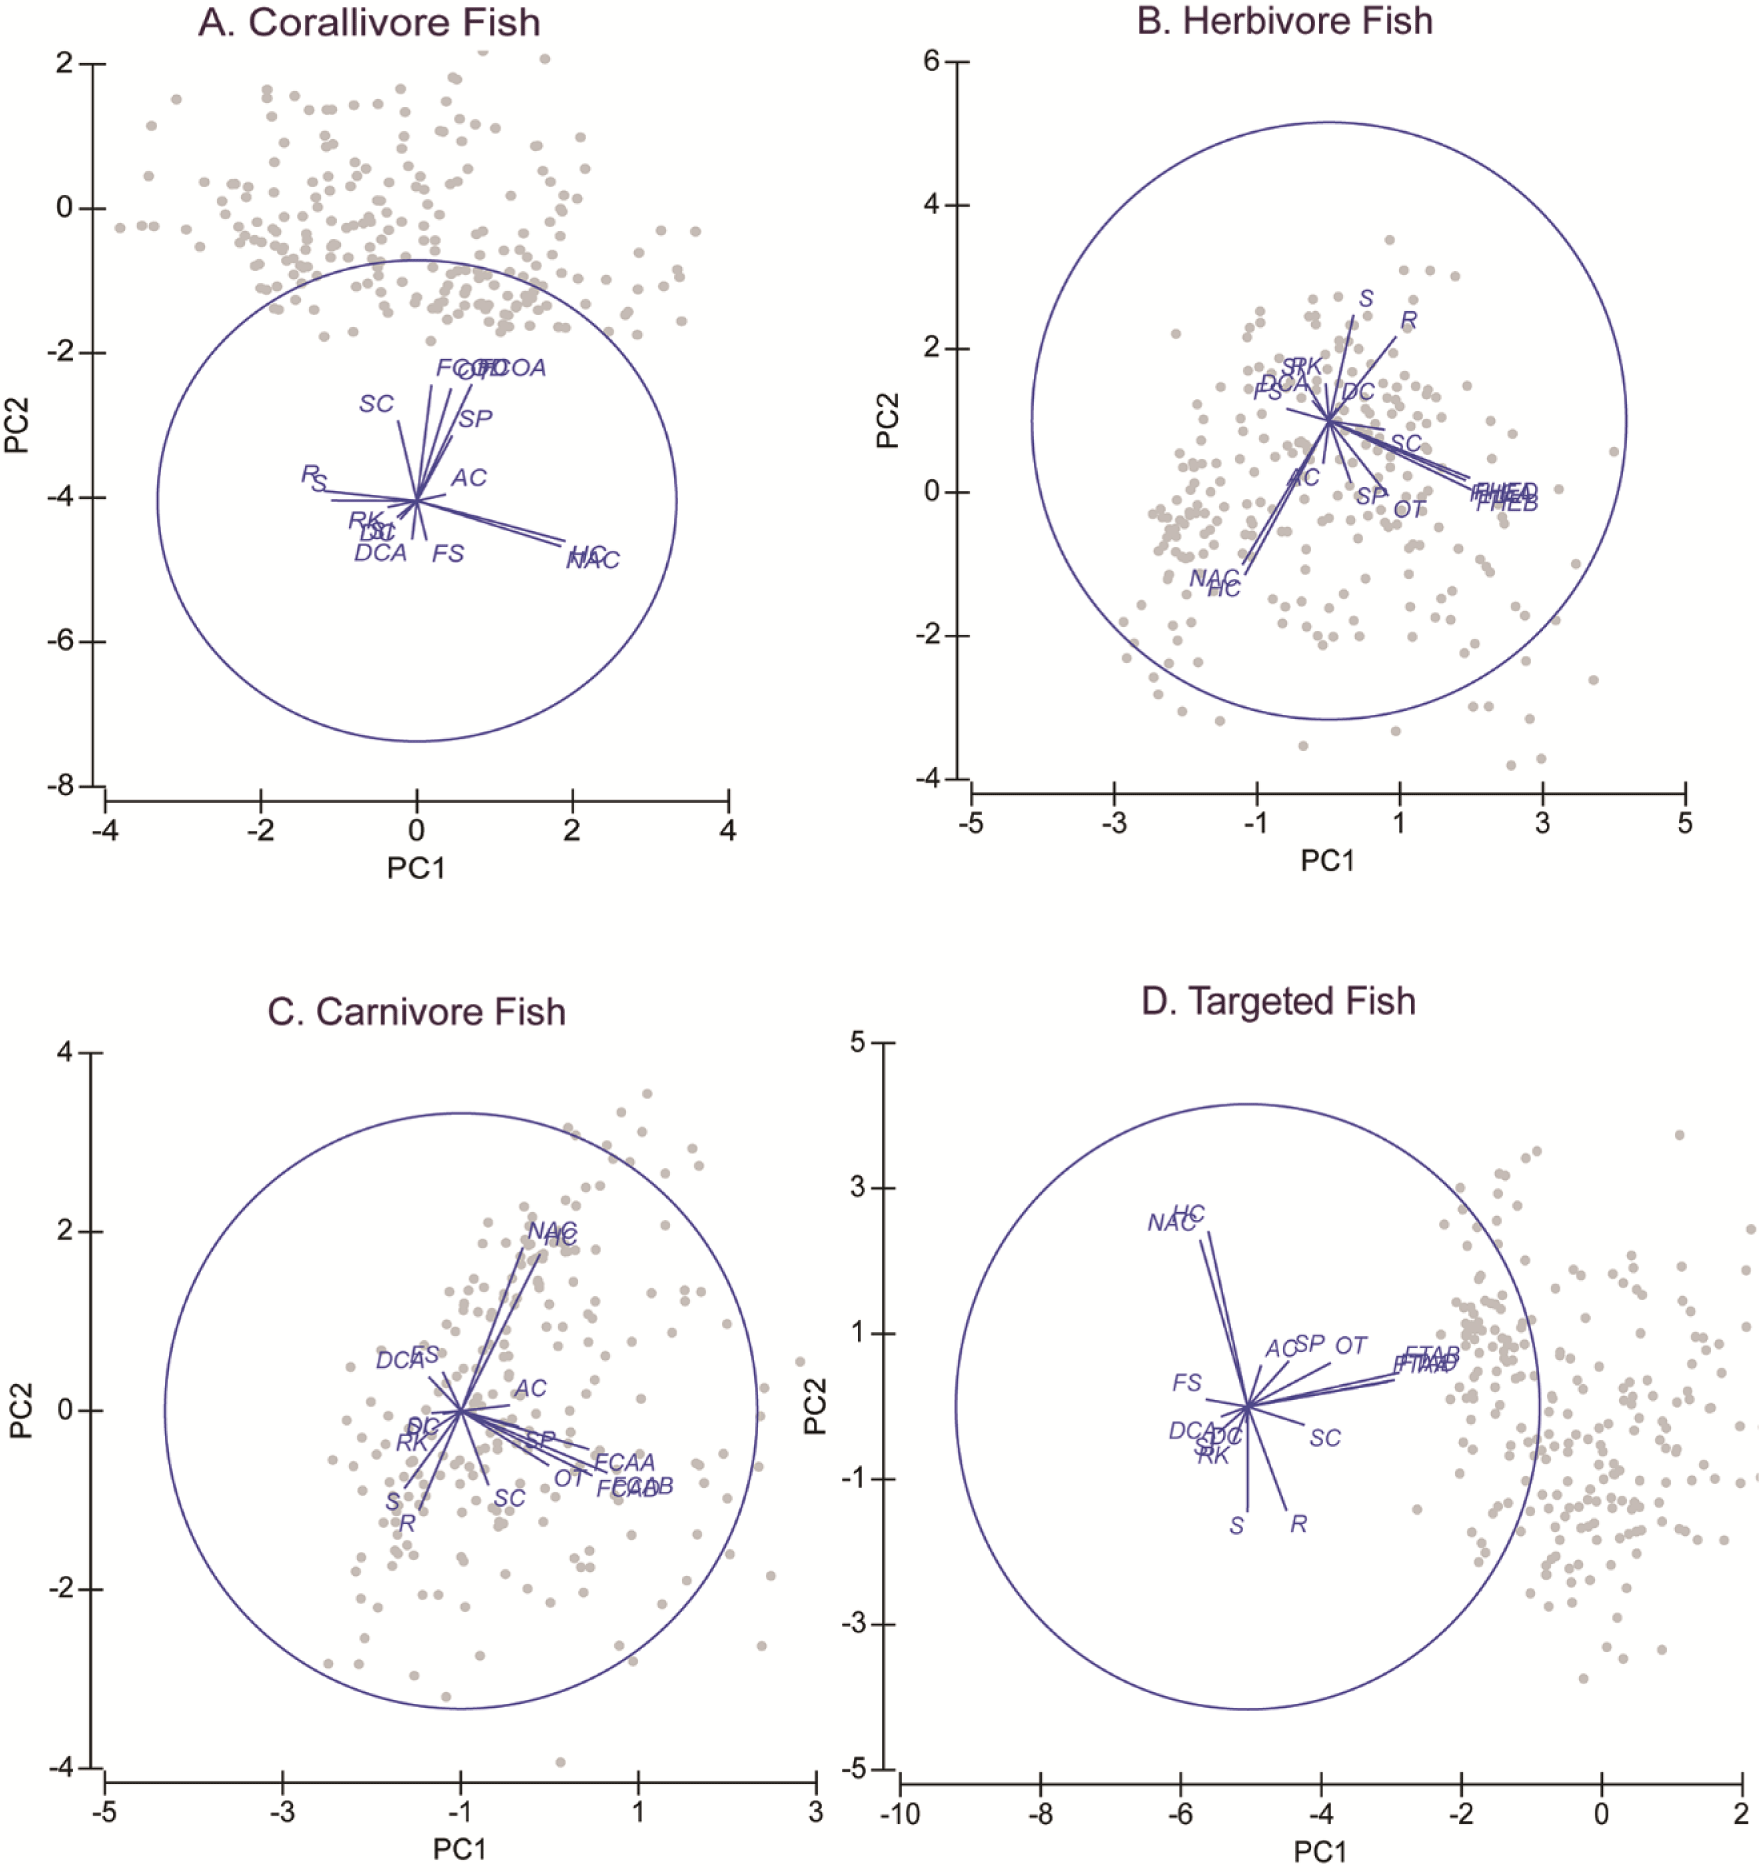
PCA shows that all fish variables were strongly correlated (Fig. 3 and Table 2). Variables of fish diversity, fish abundance, and fish biomass are all about in the same vector. This was shown in all four fish groups, i.e., corallivore, herbivore, carnivore, and targeted fishes. All the fish variable vectors were opposed to vectors of the FS, DCA, RK, and silt (SI). These four substrate variables, however, were in small quantities that their effects on the fish variables may be questionable. HC and NAC were in the vectors perpendicular to the fish variables. This showed that both variables had a strong correlation with the fish variables. The vectors of HC and NAC were also the largest vectors among biophysical substrates. HC data is the sum of AC and NAC. The proportion of NAC was about seven times larger than the proportion of AC.
| Fish trophic group | PC1 | PC2 |
|---|---|---|
| Corallivore | 16.1 | 13.5 |
| Herbivore | 19.6 | 13.7 |
| Carnivore | 18.7 | 14.1 |
| Target | 19.1 | 14.7 |
The present study reveals that there was no single predictor of biophysical substrates for any fish variables. The number of predictor variables for the 11 fish variables varied between 5–8 variables (Table 3). All the regression models had a coefficient of determination (R2) between 0.273–0.413. In other words, variances explained by the models range between 27% and 41%. These values are reasonably acceptable in the multiple regression models. Several predictor variables (OT, R, SC, HC, DCA, and RK) consistently showed an identified pattern, while some other variables did not show any pattern (FS, SP, SI, and S) (Table 4).
FCOD, fish corallivore diversity; FCOA, fish corallivore abundance; FHED, fish herbivore diversity; FHEA, fish herbivore abundance; FHEB, fish herbivore biomass; FCAD, fish carnivore diversity; FCAA, fish carnivore abundance; FCAB, fish carnivore biomass; FTAD, fish targeted diversity; FTAA, fish targeted abundance; FTAB, fish targeted biomass; DCA, dead-coral-algae; FS, fleshy algae; HC, hard coral; OT, other-fauna; R, coral rubble; RK, rock; S, sand; SC, soft coral; SI, silt; SP, sponge.
FCAA, fish carnivore abundance; FCAB, fish carnivore biomass; FCAD, fish carnivore diversity; FCOA, fish corallivore abundance; FCOD, fish corallivore diversity; FHEA, fish herbivore abundance; FHEB, fish herbivore biomass; FHED, fish herbivore diversity; FTAA, fish target abundance; FTAB, fish target biomass; FTAD, fish target diversity.
The biophysical substrates OT, R, and SC were present as the top three most important predictor variables. OT occurs in all multiple regression models indicating its very importance in fish habitats. R is the second most important to estimate 10 fish variables, but fish carnivore abundance (FCAA). SC and HC are both important predictor variables, with interchange roles. HC is a good predictor for 8 (eight) fish variables, except 3 (three) variables of herbivore fish. In contrast, SC is a good predictor for 9 (nine) variables, but not for two variables of carnivore fish (FCAA and fish carnivore biomass). SC is a predictor for fish carnivore diversity with a low coefficient (0.10). DCA was found an important predictor for herbivore and targeted fishes (6 fish variables), while RK is an important predictor for carnivore fish (3 variables).
Discussion
This large-scale study showed that the Indonesian Archipelago coral reefs are mostly covered by DCA. High coverage of DCA may indicate the occurrence of disturbances that cause coral mortality in the past, and recovery is yet to happen. Dead corals are easily colonized by microalgae in the first week. Later, turf algae grow on the dead corals. Sometimes, turf algae still grow on dead corals one year after the bleaching. Severe coral bleaching in 2016 was reported in North Sulawesi and Lombok (Bachtiar & Hadi, 2019). There is no report of coral bleaching from the western Pacific reefs, in 2016. Low fleshy algae cover may indicate that eutrophication is not the main issue in the coral reef ecosystem, and or their high abundance of herbivore fish (Newman et al., 2006). Herbivore fish was nearly two times more abundant than carnivore fish.
The high diversity and abundance of herbivores may uncover that coral reef fish in the Indonesian Archipelago is more similar to the Pacific Ocean than the Indian Ocean. Ruppert et al. (2018) reported that herbivore has higher biomass than carnivore fishes in the central Indo-Pacific, south-west Pacific, central Pacific, and Polynesia. A similar pattern was also previously reported in the south Pacific (Jennings & Polunin, 1997). In the Caribbean coral reefs, however, Newman et al. (2006) found carnivore fish predominated community. The biomass of herbivore fish is much less than that of the carnivore. In the western Indian Ocean, Sancelme et al. (2020) also revealed higher carnivore fish abundance than herbivores in Mozambique waters. Most Indonesian waters are likely more affected by the Pacific Ocean than the Indian Ocean. The Indonesian Through Flow, from the Pacific to the Indian Oceans, may continually bring marine larvae through Makassar and Lombok Straits, Flores Sea, Maluku (Molucca) Sea, Halmahera Sea, and the Banda Sea, in the central and eastern Indonesian Archipelago (Thompson et al., 2018). Bachtiar et al. (2022) reported that herbivore fish predominant did not happen in all of the Indonesian Archipelago. Biak was the most predominant in herbivore fish, while Wakatobi was prevalent in carnivore fish. Further study is required to explain the pattern of biomass ratio of herbivore/carnivore fish across the archipelago.
This study provides evidence that fish diversity, abundance, and biomass cannot be predicted from any single metric. Previous studies mostly used multi predictors for coral reef fish but tested one at a time against a fish variable. Foo et al. (2021) tested two fishing variables, two nutrient variables, and reef rugosity to fish variables. Russ et al. (2021) also tested hard coral cover to the biomass of 13 trophic groups of coral reef fish. The present study shows that there is no single predictor that could explain any fish variable. This may indicate that relationships between biophysical substrates and fish variables are very complex. At present, no other studies are using biophysical substrates as the predictor for coral reef fish variables. Mellin et al. (2010) and Sequeira et al. (2016) used multiple predictors from environmental variables to develop a predictive model for coral reef fish for species richness and abundance. They both used the same environmental factors (sediment, nutrients, oxygen, temperature, salinity, bathymetry, nitrate, phosphate, silicate) as the predictor variables. Parravicini et al. (2013) developed a predictive model for coral reef species richness at a global scale, with a resolution of 200 × 200 km2. All the last three published studies applied multiple predictors for coral reef fish variables but used different scales and different variable predictors. A pretty similar study was reported by Sartori et al. (2021). They used multiple regression to search for predictors of carnivore fish biomass from oceanographic and reef complexity variables. They found 2–5 predictor variables for the carnivore fish biomass, but with a generally lower coefficient of determination (0.036–0.319) than this study (0.273–0.413).
The present study also revealed for the first time, that other-fauna cover is an important predictor variable for coral reef fish. The other fauna variable was present in all 11 predictor models of fish variables. Such a finding has never been reported in previous studies. The components of the other fauna mostly consisted of megabenthic animals from the groups of Tunicata, Asteroidea, Echinoidea, Crinoidea, Holothuroidea, Bivalvia, and Gastropoda. It is not very clear yet, how these megabenthic have positive contributions to the predictive model for coral reef fishes. Beaman & Harris (2007) showed that the presence and abundance of the benthic communities are related to the combination of substrate type, sedimentary dynamics, and local currents. Therefore, it is believed that both megabenthic and fish abundances are related to a combination of the three factors, so megabenthic communities are indirectly related to fish communities.
The finding that coral rubbles as the predictor for 10 out of 11 coral reef fish variables were more surprising. It has been thought that coral rubble has a negative effect on coral reef fish. Coral reef predominated with coral rubbles generally has a low level of habitat complexity or rugosity, while rugosity is strongly correlated with some selected fish species (Harborne et al., 2012). Besides its low reef rugosity, however, coral rubbles are rich with microbial biofilm, cryptic flora, and fauna (review in Wolfe et al., 2021). In moderately clear water habitats, coral rubbles are colonized by turf algae, coralline algae, sponges, crustaceans, or other fauna. These cryptobenthic organisms could support small cryptic invertivore fishes. As, the invertivore fish is the largest proportion of the reef fishes (Parravicini et al., 2013), the importance of the coral rubbles may be explained by the invertivore pathway to the reef fish food web. In addition, Agudo-Adriani et al. (2019) reported that the size of holes may explain the biomass of invertivore fishes. When acroporid corals become thick rubbles, the coral rubble may increase the number of downward holes on the reef, although this assumption still needs further study.
The present study revealed that soft coral is the third significant predictor for coral reef fishes. The interactions between soft corals and coral reef fishes are undermined and less studied so far (Epstein & Kingsford, 2019), although all coral reefs divers can see that reef fishes spend some time swimming over the soft corals. Syms & Jones (2001) provided experimental evidence that soft coral removal from soft coral-dominated reefs did not affect species diversity of fish assemblages. The fish assemblages in the study were pomacentrids, labrids, and gobies. Epstein & Kingsford (2019) provided a list of diverse fish families that interact with soft corals, including herbivore (Acanthuridae, Scaridae, Labridae), and carnivore (Lutjanidae, Serranidae, Mullidae), corallivore, and planktivore fishes. They found a correlation between soft coral cover and fish species diversity, but no correlation with the abundance of fish. Fishes that were associated with soft corals were corallivores, planktivores, and micro-carnivores.
The importance of soft corals for coral reef fishes shows that soft corals provide not only structural complexity equal to the coral Pocillopora (Richardson et al., 2017) but also other environmental services for fishes. Some known corallivore fish use soft corals for their facultative foods (Nanami, 2020). The interaction between herbivore fish and soft corals is still unknown. Soft corals grow on a hard substrate as macroalgae. Herbivores may therefore graze macroalgae growth in spaces among the soft coral colonies. Although both groups have a chemical defense that may harm hard corals (Malik et al., 2020), there are no reports on competition between soft corals and macroalgae (Chadwick & Morrow, 2011). The absence of soft corals as a predictor for the carnivore fish abundance and biomass may indicate that soft corals are not the hunting fields for invertivore and piscivore fishes.
It has been widely accepted that hard coral cover is a very important variable for coral reef fish. Russ et al. (2021) reported that hard coral cover showed a significant positive relationship with corallivore, planktivore, piscivore, predator, and omnivore fishes. In the present study, hard coral cover is one of the important predictors of the diversity and abundance of the corallivore and carnivore fishes, but herbivores. The importance of live coral cover for the corallivore Chaetodontidae is limited to obligate coral feeders. Not all Chaetodontidae fishes are obligate coral polyp feeders. Some Chaetodontidae fishes are facultative coral polyp feeders, non-coralline invertebrate feeders, and zooplankton feeders (Nanami, 2020). In Seychelles, obligate coral feeders declined in response to hard coral cover loss, while the facultative coral feeders remain stable (Graham et al., 2009). The relationship between hard corals and carnivore fish has been reported in previous studies. The abundance of some carnivore fishes is strongly related to living coral cover, especially when they are juvenile (Wen et al., 2013). Sartori et al. (2021) found that the importance of hard coral cover to carnivore fish varied among fish families. Serranids and Lutjanids fishes are more dependent on the coral cover than Lethrinidae, Carangidae, and Scombridae. However, Agudo-Adriani et al. (2019) claimed that instead of hard coral cover, the number of holes on the reef may explain in part the biomass of piscivore fishes. The study showed that live hard coral cover may be substituted with abiotic reef structure in the coral reef ecosystem. The substitutable coral cover may explain the importance of the rocks variable in predicting the diversity, abundance, and biomass of carnivore fishes.
On the contrary, coral cover is not one of the predictors of herbivore fish. This study provided more evidence that herbivore fish is not affected by the coral cover. Huntington et al. (2011) have reported that ten years after reserve establishment, corals never recover in the Glover’s Reef, Belize, but herbivore fish abundance and macroalgal covers also remained the same. Furthermore, Arias-González et al. (2017) also reported that decreasing hard corals cover and increasing macroalgae cover did not change the biomass of herbivore fish in mesoamerican reefs. Some other studies showed that coral cover has a negative relationship with herbivore fish. In the Scott reef, Australia, declining coral cover from bleaching also coincided with the increase in algal cover and herbivore fish density (Gilmour et al., 2013). Tootell & Steele (2016) found a negative relationship between herbivore fish biomass and coral covers and suggested that the fish did not need living corals as refugia from its predator. Fish refugia may be found in any three-dimensional reef structures, such as dead corals or dead coral with algae. In the Philippines, the coral cover does not show a positive relationship with scrapers, excavators, large benthic foragers, detritivores, and sand feeders (Russ et al., 2021). The first three fish functional groups are grouped as herbivores in the present study.
The present study provides more evidence that not all coral reef fish are dependent on live corals. Obligatory butterflyfish are coral polyp feeders that are dependent on the live coral cover. Many other planktivore, herbivore, and carnivore fishes do not rely on live corals. Many studies, therefore, revealed conflicting results on the importance of hard coral cover as a predictor of coral reef fishes. Coral colonies are not obligatory required by coral reef fishes. Despite a decrease in the coral acroporid cover, obligate coral dweller fish abundance remains the same (Wismer et al., 2019). Although there are mountainous shreds of evidence that the loss of coral cover has an impact on the reduction of coral reef fishes (Gilmour et al., 2013; Russ et al., 2021), this particularly happens when dead corals become rubbles and the reef loses its structural complexity (Foo et al., 2021). This usually occurs two years after mass coral mortality (Gilmour et al., 2013). Therefore, the coral cover alone is not sufficient to predict coral reef fish abundance and diversity. The diversity of the coral functional groups, i.e., the number of coral life forms in the transect, should be more important than the coral cover. Bachtiar et al. (2019) found that the coral functional group was an important indicator of coral reef resilience. Coral composition in functional groups should be included as one of the reef fish predictors in future studies.
The importance of DCA cover in predicting herbivore fish diversity, abundance, and biomass is more easily recognized. In the present study, DCA consisted of turf algae and dead coral covered by microalgae. Herbivore fish biomass was tightly related to turf algal production (Tootell & Steele, 2016) in Moorea, French Polynesia. Since herbivore fish is food limited, its dependency is high on algae growing on dead corals. Agudo-Adriani et al. (2019) revealed that turf-algae is a very important predictor for the biomass of piscivore fishes, but not for herbivore fishes. Herbivore fishes must link the relation between piscivores and turf algae. The difference between the two studies may be due to differences in reef regions and statistical analysis. In the present study, diversity, abundance, and biomass of targeted fish were also found related to the DCA cover. This is likely a result of the large proportion of herbivore composition in the targeted fishes. Targeted fishes are the aggregate of herbivore and carnivore fishes, with a ratio of about 4:1 in the present study.
The other four predictor variables, fleshy algae, sponges, silts, and sand, do not have a visible pattern in the multi-regression models. Even fleshy algae cover is not the predictor for herbivore fish variables. These variables are considered to have no significant important effect on the ecology of coral reef fishes. Silts and sands both have negative values indicating the negative relationship with diversity, abundance, and biomass of fishes. As the Indonesian Archipelago is a very large marine area with very diverse habitats, it is important to study the predictor variables of each region, in future studies. SP and FS may have particular roles in more specific and homogenous regions.
The Indonesian Archipelago has a very high type variation of coral reef habitats. It may represent coral reefs in both the tropical northern hemisphere and the tropical southern hemisphere, and the western Pacific and the eastern Indian Oceans. The results of the present study may be applicable to many coral reefs in both oceans when local data are not yet available. The links found between biophysical substrates and fish variables should be taken into account in coral reef management. Coral reef managers should not undermine the roles of other fauna, coral rubbles, and soft corals in maintaining the diversity, abundance, and biomass of coral reef fishes. The apparently miss-link between coral cover and herbivore fish needs to be interpreted carefully. Many studies reported that herbivore fish is very important to facilitate coral recruitment and to control spatial competition between fast-growing macroalgae and slow-growing corals (review in Williams et al., 2019). Therefore, it is likely that the diversity and abundance of herbivore fish are predictors of coral cover. On the contrary, the coral cover is not the predictor for herbivore fish variables as it is found in the present study.
In conclusion, biophysical data on coral reef substrate show various relationships with fish assemblages. There is no single predictor for any coral reef fish variable. A combination of several biophysical data may serve as a good predictor for a particular coral reef fish variable. The present study shows that other faunas and coral rubble are important predictors for coral reef fish diversity, abundance, and biomass, regardless of their trophic levels. Soft corals, hard corals, and dead-coral-algae covers are also important predictors of many fish variables. Rock cover is an important predictor for only carnivore fish variables.