Fisheries and Aquatic Sciences
The Korean Society of Fisheries and Aquatic Science
RESEARCH ARTICLE

Effect of supplementary lighting on nutrient recovery of Ocimum basilicum and fishes in a polyculture aquaponic system

Azeezat Adenike Junaid1,2,*https://orcid.org/0000-0002-7449-992X, Mohd Salleh Kamarudin1https://orcid.org/0000-0003-1698-7463, Wahab Puteri Edaroyati3https://orcid.org/0000-0002-1087-4225, Quazim Olawale Junaid4https://orcid.org/0000-0002-1212-6706, Victor Tosin Okomoda5https://orcid.org/0000-0002-6911-583X, Mohammed Sani Isyaka2,4https://orcid.org/0000-0001-5088-8974, Yusuf Adewale Adejola6, Danladi Mohammed Umar7, Sarker Mohd Nurul Amin1,8,*https://orcid.org/0000-0003-1489-4191
1Department of Aquaculture, Faculty of Agriculture, Universiti Putra Malaysia, Serdang 43400, Malaysia
2Department of Biological Sciences, Faculty of Science & Computing, Pen Resource University, Gombe, Nigeria
3Department of Crop Science, Faculty of Agriculture, Universiti Putra Malaysia, Serdang 43400, Malaysia
4Department of Biological Sciences, Faculty of Science, University of Kashere, Gombe 0182, Nigeria
5Department of Fisheries and Aquaculture, College of Forestry and Fisheries, University of Agriculture, Makurdi 2373, Nigeria
6Department of Animal Science, Federal College of Agriculture, Moor Plantation, Ibadan, Nigeria
7Department of Biological Sciences, Faculty of Science, Gombe State University, Gombe 127, Nigeria
8World Fisheries University, Pukyong National University, Busan 48513, Korea
*Corresponding author: Azeezat Adenike Junaid, Department of Aquaculture, Faculty of Agriculture, Universiti Putra Malaysia, Serdang 43400, Malaysia, Tel: +60-2349137492851, E-mail:junaidazeezat@gmail.com
*Corresponding author: Sarker Mohd Nurul Amin, Department of Aquaculture, Faculty of Agriculture, Universiti Putra Malaysia, Serdang 43400, Malaysia, Tel: +60-435487846, E-mail:smnabd@gmail.com

Copyright © 2023 The Korean Society of Fisheries and Aquatic Science. This is an Open Access article distributed under the terms of the Creative Commons Attribution Non-Commercial License (http://creativecommons.org/licenses/by-nc/4.0/) which permits unrestricted non-commercial use, distribution, and reproduction in any medium, provided the original work is properly cited.

Received: Mar 30, 2023; Revised: Jun 05, 2023; Accepted: Jun 08, 2023

Published Online: Aug 31, 2023

Abstract

The effects of prolonged photoperiod (additional night lighting) were investigated on the production of Ocimum basilicum (lemon basil) and fish/crayfish raised in a nutrient film technique aquaponic system. Hybrid lemon fin barb and red claw crayfish juveniles were co-cultured with O. basilicum and subjected to 12 h of ambient natural daylight and additional 0, 4, 8, and 12 h of night lighting for 14 weeks (two batches of 7 weeks each). The water quality parameters and the performance characteristics of the fish/crayfish/plant were evaluated, and the nutrient uptake (nitrogen, phosphorus, and potassium) in the system by the three organisms was also measured. The fish growth performance showed no significant differences (p > 0.05) in all the growth parameters measured across the treatments. The body proximate and nitrogen, phosphate, and potassium (NPK) composition of the fish and crayfish were not significantly (p > 0.05) different across the treatments. Similarly, there was no significant difference (p > 0.05) in the NPK uptake by the fish and crayfish across the treatments. The plant growth performance showed that there were no significant (p > 0.05) differences in the plant growth parameters measured, except for % plant height gained in the 12 h-light treatment (403.2 ± 26.0%) which was significantly (p < 0.05) higher than other treatments and cycles. Hence, this study demonstrated that varying supplementary night lighting has no significant effect on the growth performance of O. basilicum, hybrid lemon fin barb, and red claw crayfish. This study, therefore, suggests that supplementary night lighting should not be considered for O. basilicum production as it does not significantly improve the performance characteristics of the plant nor the fish co-cultured with it in a polyculture aquaponic system.

Keywords: Polyculture; Aquaponics; Ocimum basilicum; Nutrient recovery; Supplementary light

Introduction

Plants generally require an adequate amount of light, temperature, water, nutrients, and gases for optimal growth and development. Light is one of the most important abiotic factors and form of energy (radiant energy), can therefore regulate plant behaviour. Depending on the direction, quality, quantity, and duration of photoperiod, the development of plants can be greatly influenced (Dou et al., 2018). In many studies, the quality, and mass increase of plants have been linked to extended photoperiod regimes (Fernández-Cabanás et al., 2020; Liang & Chien, 2013, 2015). Photosynthesis and photomorphogenesis are examples of the primary and secondary metabolic responses that would be affected by the manipulation of photoperiod regimes (Ouzounis et al., 2015). Hence, photoperiod manipulation is key to producing consistent and predictable biomass in plant production systems (Fernández-Cabanás et al., 2020).

The quest for a more sustainable environment, efficient food production system, and food security are some of the reasons for the widespread interest in polyculture aquaponic systems (Hasan et al., 2017; Nuwansi et al., 2017). In contrast with conventional aquaponic systems which are mostly carried out with total manipulation of light under a controlled environment, the plants in a polyculture aquaponic system under a semi-controlled environment may require supplementary night lighting because of their saturated nutrients. Although a minimum of 8 to 10 h of lighting has been suggested for the optimal growth of plants in conventional systems (Malayeri et al., 2011), there seems to be a paucity of information on the response of different plants to different supplementary night lighting in a polyculture aquaponic system. However, the reason for the scarcity could be that aquaponics, or polyculture aquaponic systems, is a relatively recent technology that is only now starting to gain traction globally.

The main role of the plants in the aquaponic system is to significantly reduce the nutrient loading of the water as occasioned by the decomposing uneaten feeds and byproducts excreted by the fish (Love et al., 2015; Rakocy, 2012). The nutrients accumulated by plants in the system are mainly nitrogen and phosphorus, which are the principal compounds responsible for eutrophication in many aquatic environments (Liang & Chien, 2015; Petrucio & Esteves, 2000). Since the availability of light affects the photosynthetic activities of plants, it could be hypothesized that the manipulation of the photoperiod regime may also affect the nutrient removal capacity of the plants connected to the system (Liang & Chien, 2013). Ocimum basilicum is a plant that can be used as an herb as well as an essential oil in cosmetics or pharmaceuticals (Ahmed et al., 2019). Thus, the current study is aimed at improving the performance of this important herb by increasing the lighting hours at night. This study is, therefore, designed to investigate the effects of supplementary night lighting on the growth and nutrient uptake by fish/crayfish and O. basilicum grown in a polyculture aquaponic system.

Materials and Methods

Experimental setup, fish, crayfish, and Ocimum basilicum

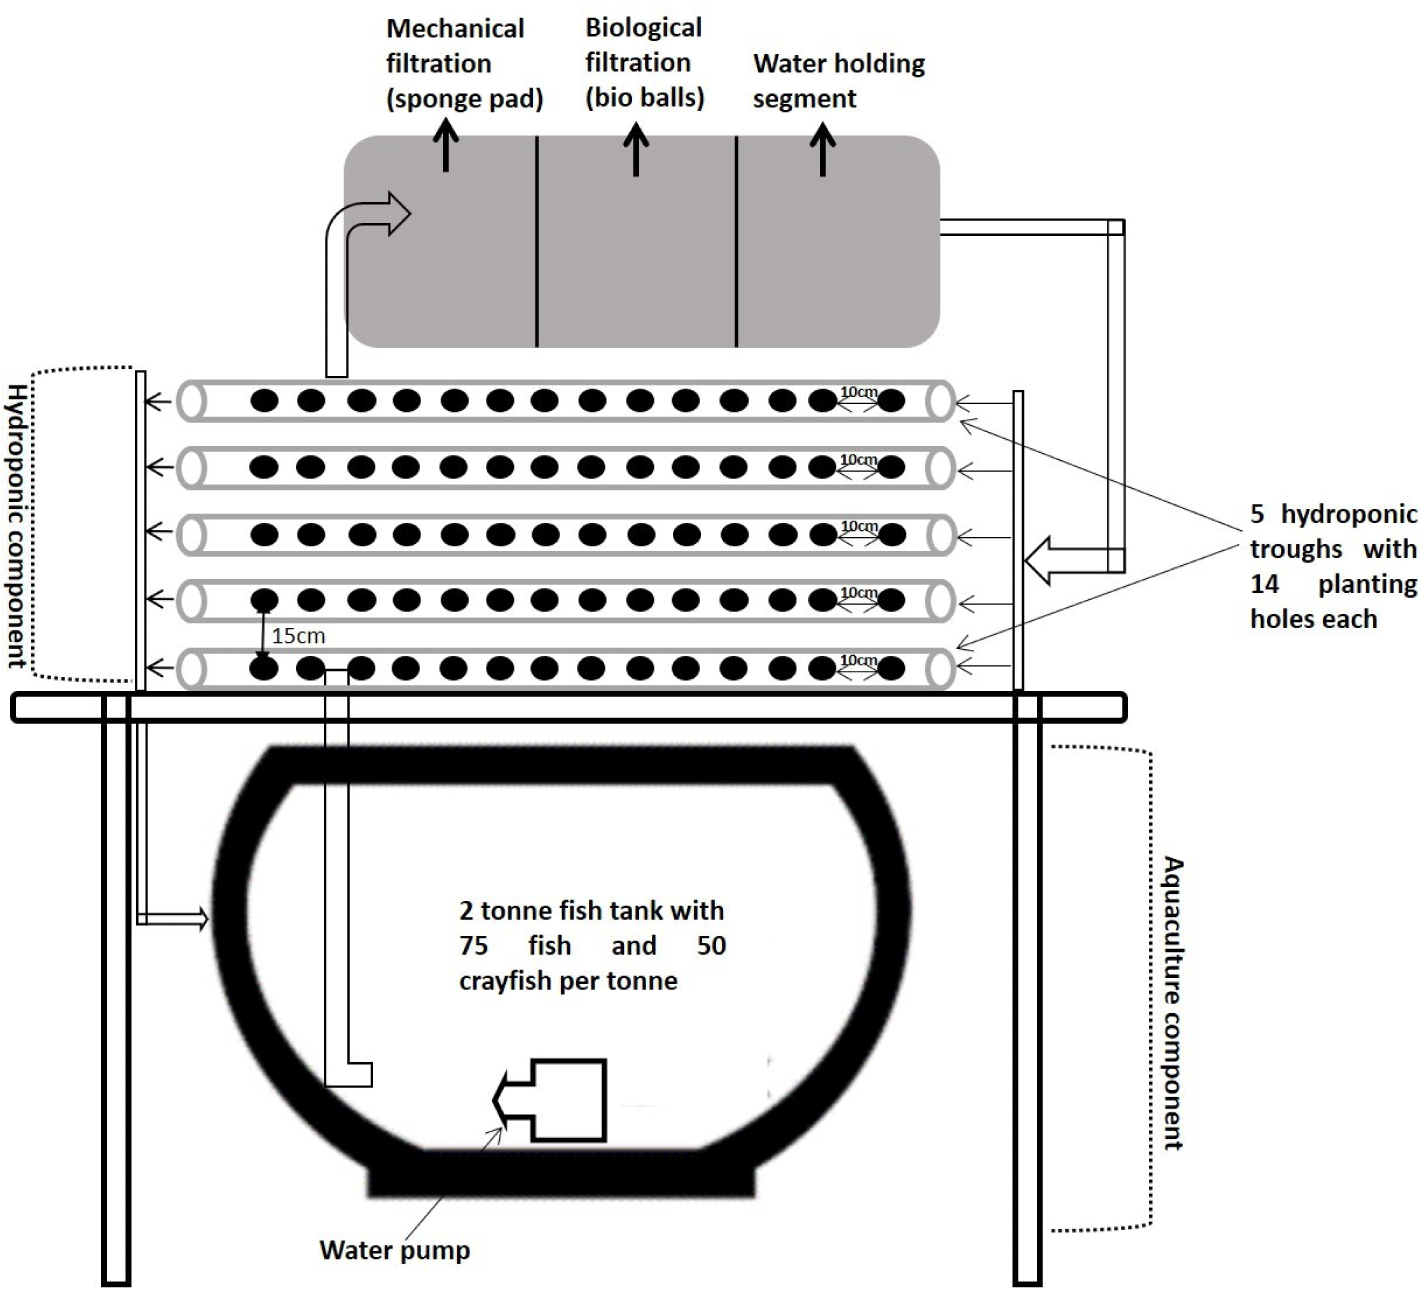
The experiment was conducted at the Aquaculture Experimental Station, Universiti Putra Malaysia, Malaysia. The experimental setup consisted of 12-individual polyculture aquaponic units situated under a large open-shed aquaculture facility with natural light interception but enough for plant growth (57.74 ± 1.43 µmol m–2s–1). Each polyculture aquaponic unit consisted of a nutrient film technique vegetable trough unit made of 5 unplasticized polyvinyl chloride rectangular down-pipe rain gutters (5.95 × 0.15 × 0.07 m), a filtration box, and a 2-tonne fibre glass fish tank. Each row held 14 pots, that is, 70 plant pots per culture unit. A portable (135-watt, 4,000 L/h) aquarium pump was used to pump water for recirculation in the system (Fig. 1). Each tank was filled with 1 tonne of dechlorinated state tap water.

fas-26-8-500-g1
Fig. 1. Schematic representation of the aquaponic setup.
Download Original Figure

The red claw crayfish was procured from Greeny Aquaculture, Johor, and the hybrid lemon fin barb fingerlings were from Jerantut Aquaculture Extension Centre in Perlok Pahang, Malaysia. The fish and crayfish were randomly stocked at 75 fish/50 crayfish/tonne and acclimatized to the polyculture aquaponic system for 4 weeks before O. basilicum seedlings were introduced into the system. Two 3-day-old seedlings of O. basilicum were (germinated on Petri dishes) transferred individually to each pot of the vegetable trough. During the study period of 14 weeks, the red claw crayfish and hybrid lemon fin barb fish were fed (5% body weight) commercial pellets (Blanca shrimp feeds, 36% crude protein, and Cargill starter, 34% crude protein, respectively).

Supplementary lighting

Only the plants were subjected to supplementary lighting using the following four treatments: 12 h daylight and 0 h supplementary night light (control); 12 h daylight and 4 h supplementary night light; 12 h daylight and 8 h supplementary night light; and 12 h natural daylight and 12 h supplementary night light. LED plant grow lights (Philips T8 tube, Philips Lighting, Bridgewater, NJ, USA) were used to provide artificial lighting in the range of 650 ± 50 µmol m–2s–1. Automatic timers were used to ensure strict adherence to the light regimes intended for each treatment. The plants were grown for 2 cycles, with each lasting for 7 weeks.

Water quality analysis

Water quality parameters were taken every week from the effluent (water from the fish tank) and influent (water returning to the fish tank after going through the plant trough and filter box). Parameters such as dissolved oxygen (DO), temperature, electrical conductivity (EC), and pH were recorded in situ using a multi-parameter water probe (YSI 556 MPS, YSI, Yellow Springs, OH, USA). Thereafter, water samples were collected and used for the analysis of ammonia, nitrate, nitrite, phosphate, and potassium ions. The process involved filtration of the water samples in Whatman® filter paper (pore size 0.45 μm and 47 mm diameter) before use. The ammonia and ammonium levels were then read using ammonia low range portable photometer (HI 96700, Hanna Instruments, Smithfield, RI, USA). However, the phosphate and potassium ion concentrations were analyzed using atomic absorption spectroscopy (TruMac Series, Leco, St. Joseph, MO, USA) as described by Ogah et al. (2020a).

Evaluation of fish, crayfish, and plant performance

The fish and crayfish in this study were sampled weekly until the 14th week of culture (which was equivalent to the two cycles of the vegetables) to determine their performance. Hence, the fish and crayfish from each tank were individually batched and weighed to get the bulk weight and survival rate weekly. The information was also used to adjust the feed ration according to the new mean body weight obtained weekly. Thereafter, the weight gain, specific growth rate, average daily feed intake, feed conversion ratio (FCR), protein efficiency ratio (PER), and percentage survival were evaluated according to the equations described below.

Growth rate ( g/d ) = W 2 W 1 t 2 t 1
Where W 1 = initial weight  ( g ) ,  W 2 = final weight  ( g ) ,             t 2 t 1 = duration between W 2 and W 1 ( days ) .
Specific growth rate  ( % / day ) = log e ( W 2 ) log e ( W 1 ) t 2 t 1 × 100
FCR = d r y f e e d c o n s u m e d W 2 W 1
Feed conversion efficiency  ( % FER ) = ( W 2 W 1 ) × 100 d r y f e e d c o n s u m e d
PER = Fish weight gain  ( g ) Total protein intake  ( g )
Protein gained = ( Weight final × % Protein final ) ( Weight initial × % Protein initial )
Lipid gained = ( Weight final × % Lipid final ) ( Weight initial × % Lipid initial )
%  Survival = f i s h s t o c k e d M o r t a l i t y f i s h s t o c k e d × 100

In this study, the evaluation of plant performance was based on the parameters such as leaf number (the number of true leaves in each pot), leaf area (area of 50 true leaves sampled from 25 plants) using a leaf area meter (LI-COR LI-3100C, Lincoln, NE, USA), plant height (i.e., using a meter rule), and chlorophyll content (Konica Minolta SPAD 502 Plus, Tokyo, Japan). These parameters were measured at the beginning (during transplanting) and at the end of the experiment.

Fish, crayfish, and plant tissue analysis

The proximate composition of the fish and crayfish in the polyculture aquaponics system was done according to the method specified by AOAC (1997). Also, the plant leaf and the fish/crayfish tissues were analyzed for nitrogen (N), phosphate (P), and potassium (K) to estimate the initial and final values before and after the study. This was done using the Perkin Elmer Analyst 400 spectrophotometer flame method (Bader, 2011). The nutrient retention in the plants was evaluated using the following equations:

Nutrient retention = 100 × N u t r i e n t g a i n e d i n p l a n t o r f i s h T o t a l n u t r i e n t i n f e e d g i v e n
Nutrient uptake = ( F i n a l w e i g h t × F i n a l N P K c o n t e n t ) ( I n i t i a l w e i g h t × I n i t i a l N P K c o n t e n t )
Statistical analysis

Descriptive statistics of the collected data were done using Minitab 14 to obtain the means and standard errors for the different data sets in this study. The data were tested for normality and homogeneity of variance before they were subjected to an analysis of variance (ANOVA). In particular, the water quality parameter data were analyzed using a 2-way ANOVA and the results were presented in graphs. The fish, crayfish, and plant growth performances and body/nutrient compositions were analyzed using one-way ANOVA. Also, it should be noted that the percentage data for nutrient recovery were arcsine transformed.

Results

Water quality

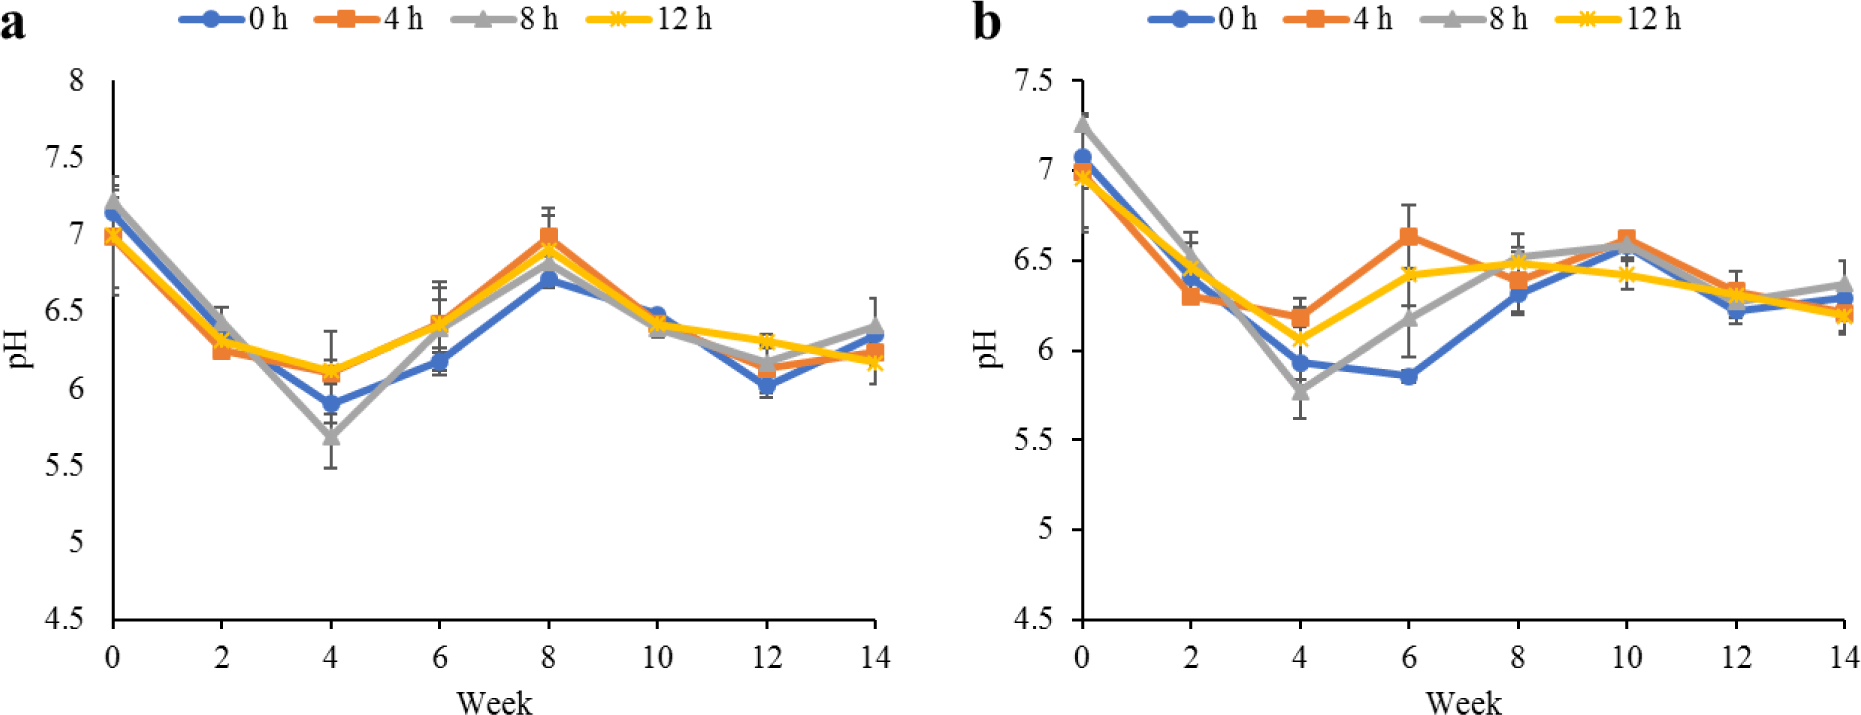
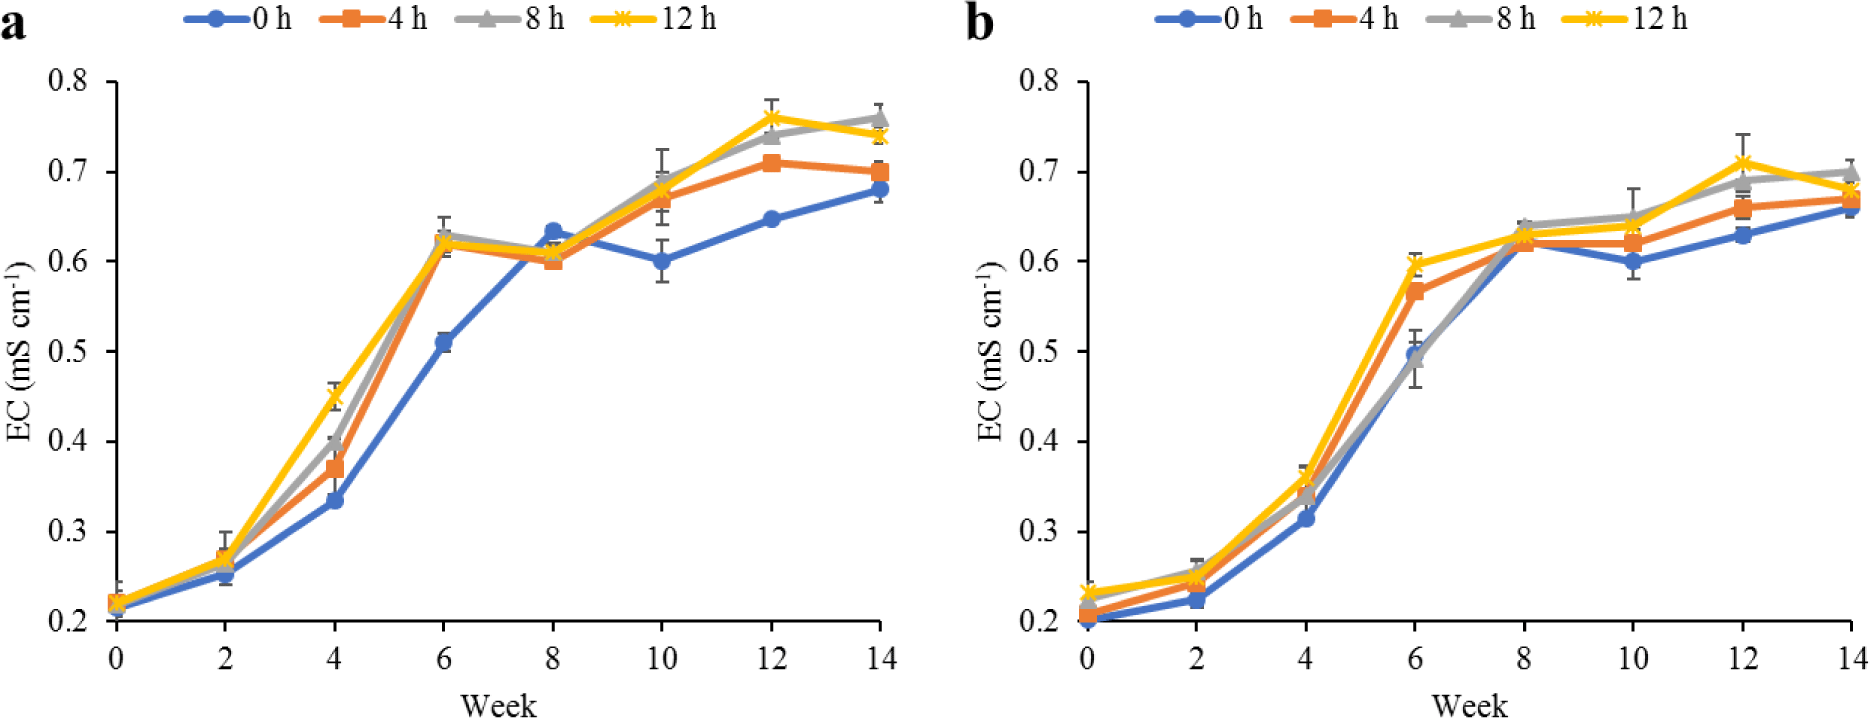
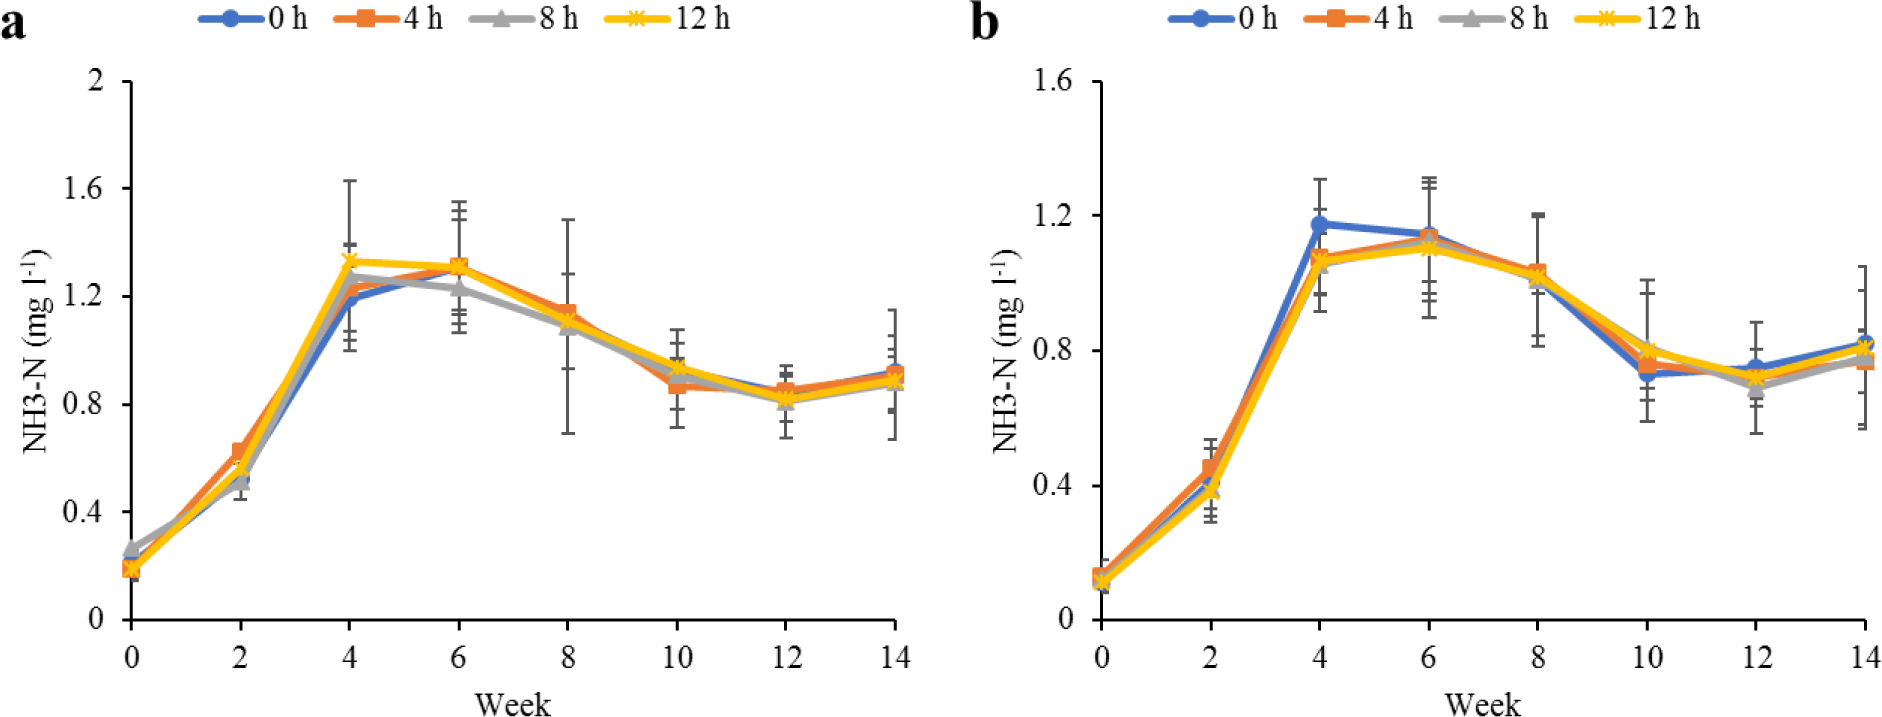
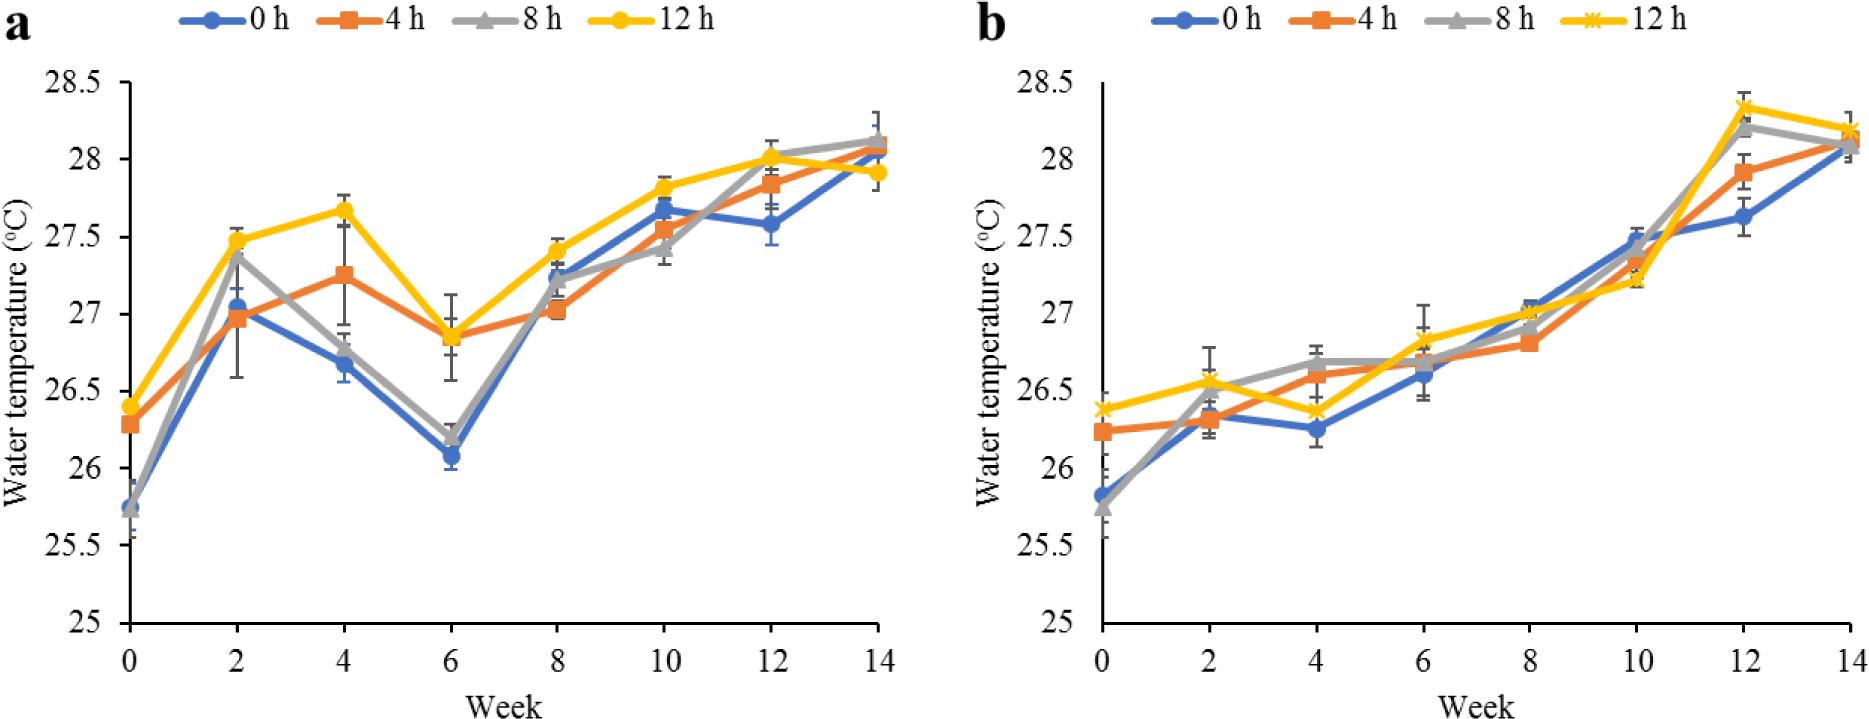
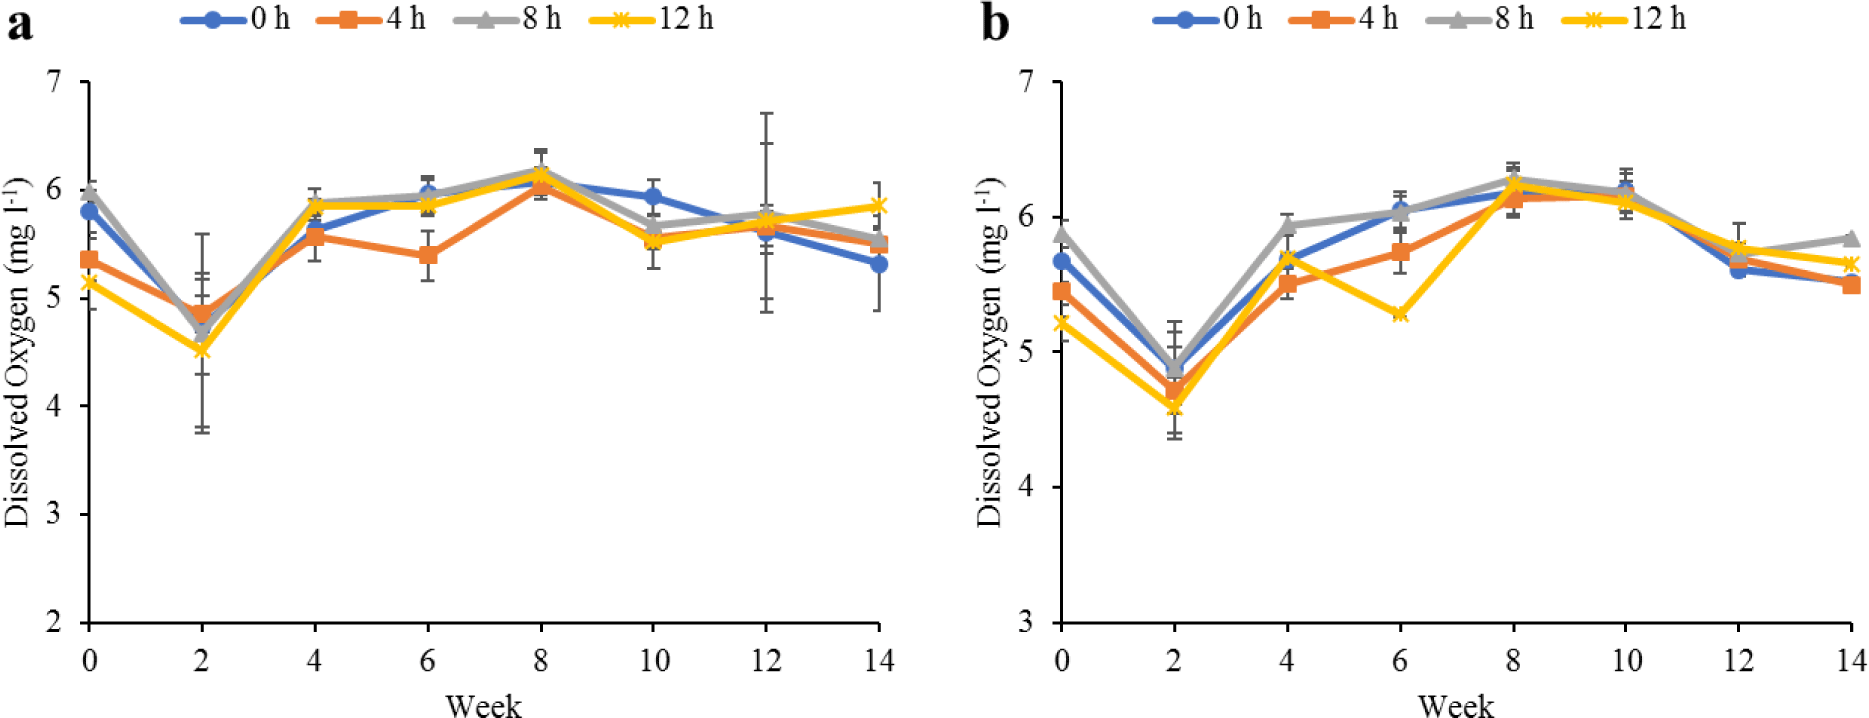
Water quality parameters in the culture tanks and plant trough outlets throughout the experiment are shown in Figs. 26. Generally, there were no significant differences (p > 0.05) in the water parameters observed between the culture tanks and plant troughs. The water temperature in the culture tanks and trough increased steadily while it ranged from 25.7°C–28.1°C. However, the DO, pH, and EC ranges obtained in this study were 4.5–6.3 mg/L, 5.8–7.2 and 0.2–0.75 mS/cm respectively. In both culture tanks and plant troughs, the ammonia-nitrogen was within the safe limit (0.2–1.4 mg/L) for the culture of fish and crayfish, while there were no significant differences (p > 0.05) in the ammonia concentration across the different treatments.
fas-26-8-500-g2
Fig. 2. Water temperature in (A) culture tanks and (B) plant trough outlet where hybrid lemon fin barb and red claw crayfish were cultured with basil and jute mallow herbs exposed to supplementary night lighting in a polyculture aquaponic system.
Download Original Figure
fas-26-8-500-g3
Fig. 3. Dissolved oxygen in (A) culture tanks and (B) plant trough outlet where hybrid lemon fin barb and red claw crayfish were cultured with basil and jute mallow herbs exposed to supplementary night lighting in a polyculture aquaponic system.
Download Original Figure
fas-26-8-500-g4
Fig. 4. pH in (A) culture tanks and (B) plant trough outlet where hybrid lemon fin barb and red claw crayfish were cultured with basil and jute mallow herbs exposed to supplementary night lighting in a polyculture aquaponic system.
Download Original Figure
fas-26-8-500-g5
Fig. 5. Electrical conductivity in (A) culture tanks and (B) plant trough outlet where hybrid lemon fin barb and red claw crayfish were cultured with basil and jute mallow herbs exposed to supplementary night lighting in a polyculture aquaponic system.
Download Original Figure
fas-26-8-500-g6
Fig. 6. Ammonia-nitrogen in (A) culture tanks and (B) plant trough outlet where hybrid lemon fin barb and red claw crayfish were cultured with basil and jute mallow herbs exposed to supplementary night lighting in a polyculture aquaponic system.
Download Original Figure
Fish/crayfish growth performance and body composition

The growth indices and survival of hybrid lemon fin barb and red claw crayfish cultured with O. basilicum under different night lighting regimes are shown in Table 1. The fish growth performance showed that there were no significant differences (p > 0.05) in all the growth parameters assessed across the treatments. In addition, the growth performance of the crayfish showed 20.17–22.57 g weight gain, 2.34–2.53 FCR, and 1.17–1.26 PER. However, no significant differences (p > 0.05) were observed in growth parameters measured across the treatments in either fish or crayfish.

Table 1. Growth performance of hybrid lemon fin barb and red claw crayfish in a polyculture aquaponic system with Ocimum basilicum exposed to different light regimen for 14 weeks
Performance Fish Crayfish
0 h 4 h 8 h 12 h 0 h 4 h 8 h 12 h
IBW (g) 12.3 ± 0.61 12.4 ± 0.17 12.2 ± 0.74 12.57 ± 1.13 4.1 ± 0.32 4.1 ± 0.15 4.23 ± 0.09 4.13 ± 0.32
FBW (g) 124.87 ± 4.39a 113.87 ± 7.91a 128.27 ± 7.24a 127.93 ± 3.68a 24.27 ± 3.26x 25.11 ± 3.26x 26.53 ± 3.14x 26.7 ± 1.79x
MWG (g) 112.57 ± 4.61a 113.87 ± 7.83a 116.07 ± 7.74a 115.37 ± 4.75a 20.17 ± 2.96x 21.01 ± 3.12x 22.3 ± 3.09x 22.57 ± 1.47x
SGR (%/d) 2.21 ± 0.07a 2.21 ± 0.05a 2.24 ± 0.1a 2.21 ± 0.12a 1.68 ± 0.06x 1.71 ± 0.1x 1.73 ± 0.11x 1.78 ± 0.01x
DFI (%/d) 3.05 ± 0.13a 2.99 ± 0.05a 3.02 ± 0.06a 3.07 ± 0.13a 3.64 ± 0.09x 3.56 ± 0.12x 3.52 ± 0.09x 3.50 ± 0.14x
FCR 1.82 ± 0.09a 1.79 ± 0.04a 1.80 ± 0.07a 1.84 ± 0.05a 2.53 ± 0.05x 2.45 ± 0.13x 2.42 ± 0.21x 2.34 ± 0.09x
PER 1.62 ± 0.08a 1.65 ± 0.04a 1.64 ± 0.06a 1.61 ± 0.04a 1.17 ± 0.02x 1.21 ± 0.06x 1.23 ± 0.10x 1.26 ± 0.05x
Survival (%) 97.33 ± 0.77a 97.78 ± 0.45a 96.44 ± 0.9a 95.56 ± 2.47a 84.67 ± 4.81x 84.67 ± 2.4x 86.67 ± 0.67x 85.33 ± 0.67x
Total P (kg/tonne) 9.11 ± 0.25a 9.26 ± 0.55a 9.28 ± 0.58a 9.18 ± 1.13a 1.04 ± 0.20x 1.07 ± 0.17x 1.15 ± 0.13x 1.14 ± 0.08x

Data are represented as mean ± SE.

Values within the same row and species with different superscript letters are significantly different (p < 0.05).

IBW, initial body weight; FBW, final body weight; MWG, mean weight gain; SGR, specific growth rate; DFI, daily feed intake; FCR, feed conversion ratio; PER, protein efficiency ratio; Total P: total production.

Download Excel Table

The body proximate composition of the fish and crayfish was not significantly (p > 0.05) different across the treatments (Table 2). However, the NPK composition of the fish and crayfish was not significantly (p > 0.05) different across the treatments (Table 3). In the fish carcass, NPK values obtained were 2.93–2.97 mg/g, 0.56–0.62 mg/g, and 0.26–0.28 mg/g, respectively, whereas N values of 2.60–2.65 mg/g, P values of 0.15–0.16 mg/g, and K values of 0.05–0.06 mg/g were obtained in the carcass of crayfish.

Table 2. Body composition of hybrid lemon fin barb and red claw crayfish (% wet weight) grown with Ocimum basilicum exposed to different night lighting
Treatments Nutrients (%)
Moisture Crude protein Crude lipid Ash Crude fibre NFE
Fish
 Initial 75.36 ± 0.56 12.6 ± 0.29 4.53 ± 0.38 2.05 ± 0.03 0.10 ± 0.0 5.38 ± 1.16
 0 h 67.9 ± 0.22a 18.41 ± 0.26a 4.10 ± 0.07a 2.25 ± 0.09a 0.16 ± 0.02a 7.19 ± 0.06a
 4 h 67.84 ± 0.84a 18.33 ± 0.41a 4.18 ± 0.22a 2.27 ± 0.11a 0.17 ± 0.02a 7.18 ± 0.56a
 8 h 67.59 ± 0.66a 18.58 ± 0.50a 4.05 ± 0.05a 2.36 ± 0.30a 0.21 ± 0.02a 7.21 ± 0.34a
 12 h 67.79 ± 0.69a 18.55 ± 0.32a 4.1 ± 0.06a 2.35 ± 0.23a 0.21 ± 0.03a 7.01 ± 0.52a
Crayfish
 Initial 78.88 ± 0.23 12.63 ± 0.28 1.04 ± 0.01 1.02 ± 0.05 0.26 ± 0.02 6.17 ± 0.10
 0 h 75.33 ± 0.60x 16.23 ± 0.28x 1.06 ± 0.02x 1.13 ± 0.01x 0.12 ± 0.01x 6.12 ± 0.33x
 4 h 75.34 ± 0.25x 16.29 ± 0.28x 1.07 ± 0.02x 1.2 ± 0.06x 0.11 ± 0.01x 5.99 ± 0.18x
 8 h 74.95 ± 0.44x 16.54 ± 0.44x 1.05 ± 0.04x 1.07 ± 0.02x 0.11 ± 0.06x 6.25 ± 0.78x
 12 h 75.02 ± 0.46x 16.52 ± 0.44x 1.03 ± 0.07x 1.08 ± 0.03x 0.12 ± 0.01x 6.23 ± 0.79x

Data are represented as mean ± SE.

Values within the same column and species with different superscript letters are significantly different (p < 0.05).

Download Excel Table
Table 3. Fish and crayfish NPK composition in a polyculture aquaponic system exposed to different light regimen (wet weight basis)
Parameter Fish Crayfish
0 h 4 h 8 h 12 h 0 h 4 h 8 h 12 h
Initial N (mg/g) 2.06 ± 0.05 2.02 ± 0.05 2.02 ± 0.05 2.03 ± 0.04 2.02 ± 0.01 2.02 ± 0.02 2.03 ± 0.01 2.04 ± 0.02
Final N (mg/g) 2.95 ± 0.04a 2.93 ± 0.07a 2.97 ± 0.08a 2.97 ± 0.05a 2.60 ± 0.05x 2.61 ± 0.03x 2.65 ± 0.07x 2.64 ± 0.07x
Initial P (mg/g) 0.53 ± 0.02 0.57 ± 0.01 0.58 ± 0.0 0.59 ± 0.01 0.11 ± 0.02 0.10 ± 0.02 0.11 ± 0.01 0.11 ± 0.02
Final P (mg/g) 0.56 ± 0.04a 0.60 ± 0.01a 0.60 ± 0.01a 0.62 ± 0.01a 0.16 ± 0.01x 0.16 ± 0.0x 0.15 ± 0.0x 0.16 ± 0.01x
Initial K (mg/g) 0.25 ± 0.0 0.25 ± 0.01 0.25 ± 0.02 0.26 ± 0.01 0.04 ± 0.01 0.04 ± 0.02 0.04 ± 0.0 0.04 ± 0.01
Final K (mg/g) 0.27 ± 0.01a 0.26 ± 0.01a 0.27 ± 0.01a 0.28 ± 0.0a 0.06 ± 0.0x 0.06 ± 0.01x 0.06 ± 0.0x 0.05 ± 0.01x

Data are represented as mean ± SE.

Values within the same row and species with different superscript letters are significantly different (p < 0.05).

N, nitrogen; P, phosphate; K, potassium.

Download Excel Table
Growth performance and composition of Ocimum basilicum

Table 4 shows the summary of plant performances in different extended night lighting regimes during two culture cycles. Overall, there were no significant (p > 0.05) differences in the plant growth parameters measured, except for % plant height gained in the 12 h-light treatment, which was significantly (p < 0.05) higher than other treatments and cycles.

Table 4. Ocimum basilicum characteristics exposed to 12 h daylight, followed by different lengths of night lighting
Parameter Cycle 1 Cycle 2
0 h 4 h 8 h 12 h 0 h 4 h 8 h 12 h
Initial LA (cm2/leaf) 2.4 ± 0.2 2.4 ± 0.1 2.4 ± 0.2 2.4 ± 0.2 2.4 ± 0.0 2.4 ± 0.0 2.4 ± 0.2 2.4 ± 0.2
Final LA (cm2/leaf) 15.5 ± 0.3a 15.7 ± 0.7a 15.7 ± 0.3a 15.8 ± 0.7a 16.2 ± 0.5a 16.3 ± 0.5a 16.3 ± 0.8a 16.2 ± 0.8a
LA gain (cm2/leaf) 13.1 ± 0.2a 13.3 ± 0.7a 13.3 ± 0.1a 13.4 ± 0.5a 13.8 ± 0.4a 13.9 ± 0.5a 13.9 ± 0.6a 13.9 ± 0.7a
LA gain (%/leaf) 549.8 ± 31.9a 550.7 ± 13.7a 526.9 ± 42.7a 555.6 ± 25.0a 587.1 ± 10.9a 588.5 ± 11.0a 589.5 ± 20.6a 586.3 ± 13.8a
Initial LN (leaves/pot) 6.0 ± 0.6 6.3 ± 0.7 6.0 ± 1.2 6.7 ± 0.7 6.7 ± 0.3 6.3 ± 0.7 6.7 ± 13 7.0 ± 0.6
Final LN (leaves/pot) 28.7 ± 0.9a 31.0 ± 3.1a 30.3 ± 4.4a 31.3 ± 2.8a 33.3 ± 2.4a 33.7 ± 3.0a 34.3 ± 4.7a 35.3 ± 3.4a
LN gain (leaves/pot) 22.7 ± 0.9a 24.7 ± 2.4a 24.3 ± 3.3a 24.7 ± 2.2a 26.7 ± 2.2a 27.3 ± 2.3a 27.7 ± 3.3a 28.3 ± 2.8a
LN gain (%) 386.2 ± 47.3a 420.8 ± 53.2a 420.8 ± 53.2a 370.8 ± 6.4a 400.0 ± 24.7a 434.3 ± 17.8a 433.3 ± 45.8a 404.4 ± 16.6a
Initial PH (cm/pot) 5.1 ± 0.4 5.7 ± 0.1 5.4 ± 0.4 5.5 ± 0.2 5.3 ± 0.4 5.3 ± 0.2 5.3 ± 0.3 5.4 ± 0.1
Final PH (cm/pot) 21.8 ± 1.4a 24.9 ± 1.6a 26.3 ± 2.1a 26.1 ± 1.8a 25.6 ± 1.7a 26.2 ± 2.2a 26.6 ± 1.8a 26.1 ± 1.8a
PH gain (cm/pot) 16.6 ± 1.4a 19.2 ± 1.6a 20.8 ± 1.8a 21.7 ± 0.8a 20.3 ± 1.3a 20.9 ± 2.0a 21.3 ± 1.6a 21.8 ± 0.8a
PH gain (%) 329.3 ± 40.9b 338.7 ± 26.0ab 382.7 ± 17.4ab 394.4 ± 27.4a 382.1 ± 13.1ab 393.3 ± 29.0a 397.9 ± 12.3a 403.2 ± 26.0a
Initial CC (mg cm–2) 9.3 ± 0.9 9.5 ± 0.1 9.5 ± 0.7 9.8 ± 0.7 9.8 ± 0.2 9.9 ± 0.3 9.8 ± 0.4 9.9 ± 0.3
Final CC (mg cm–2) 19.8 ± 1.4a 20.2 ± 0.4a 20.8 ± 1.3a 20.6 ± 1.5a 25.5 ± 1.8a 25.2 ± 1.5a 26.1 ± 2.9a 25.6 ± 2.5a
CC gain (mg cm–2) 10.5 ± 0.4a 10.7 ± 0.3a 11.3 ± 0.7a 11.8 ± 1.2a 15.6 ± 1.6a 15.3 ± 1.2a 16.3 ± 2.6a 17.3 ± 1.1a
CC gain (%) 115.4 ± 8.1a 112.2 ± 2.5a 119.8 ± 4.6a 123.9 ± 22.0a 158.5 ± 13.2a 154.5 ± 8.6 164.8 ± 21.1a 175.0 ± 15.8a
Initial FW (g/unit culture) 70.5 ± 3.4 74.4 ± 5.2 71.2 ± 2.0 72.4 ± 3.5 73.1 ± 1.6 73.0 ± 4.7 73.2 ± 1.9 73.8 ± 3.8
Final FW (g/unit culture) 429.0 ± 17.1a 444.2 ± 23.3a 444.3 ± 16.6a 442.2 ± 15.4a 464.3 ± 5.4a 465.5 ± 26.1a 468.9 ± 19.1a 466.5 ± 24.9a
FW gain (g/unit culture) 358.5 ± 13.8a 369.8 ± 19.7a 373.1 ± 15.1a 369.7 ± 12.1a 391.2 ± 4.1a 392.5 ± 21.5a 395.7 ± 17.2a 392.7 ± 21.1a
FW gain (%) 509.2 ± 5.5a 500.2 ± 28.6a 524.0 ± 15.9a 511.3 ± 10.4a 535.2 ± 7.8a 538.3 ± 9.0a 540.1 ± 10.2a 532.2 ± 1.6a
Yield (g m–2) 286.0 ± 11.4a 296.1 ± 15.1a 296.2 ± 11.0a 294.8 ± 10.3a 309.5 ± 3.6a 310.4 ± 17.4a 312.6 ± 12.7a 311.0 ± 16.6a

Mean ± SE within the same row and growth cycle with different superscripts are significantly different at p < 0.05.

LA, leaf area; LN, leaf number; PH, plant height; CC, chlorophyll content; FW, fresh weight.

Download Excel Table

Furthermore, O. basilicum nutrient compositions before and after being subjected to different lighting regimes are shown in Table 5. Similar trends in the composition of plants were observed in both plant cycles. There were no significant (p > 0.05) differences in the final NPK of O. basilicum in both cycles.

Table 5. NPK composition of Ocimum basilicum exposed to different night lighting regimen in a polyculture aquaponic system (wet weight basis)
Parameter 0 h 4 h 8 h 12 h
Cycle 1
 Initial N (mg/g) 20.38 ± 0.24 20.41 ± 0.11 20.40 ± 0.13 20.40 ± 0.21
 Final N (mg/g) 31.16 ± 0.15a 31.07 ± 0.32a 31.13 ± 0.03a 31.15 ± 0.48a
 Initial P (mg/g) 0.57 ± 0.01 0.58 ± 0.02 0.59 ± 0.02 0.58 ± 0.02
 Final P (mg/g) 1.12 ± 0.02a 1.13 ± 0.02a 1.13 ± 0.03a 1.13 ± 0.03a
 Initial K (mg/g) 1.10 ± 0.01 1.09 ± 0.01 1.10 ± 0.02 1.10 ± 0.03
 Final K (mg/g) 1.50 ± 0.01a 1.49 ± 0.02a 1.49 ± 0.03a 1.50 ± 0.06a
Cycle 2
 Initial N (mg/g) 20.85 ± 0.14 20.86 ± 0.18 20.83 ± 0.19 20.85 ± 0.14
 Final N (mg/g) 32.22 ± 0.25a 32.22 ± 0.11a 32.11 ± 0.25a 32.25 ± 0.06a
 Initial P (mg/g) 0.59 ± 0.02 0.58 ± 0.03 0.59 ± 0.02 0.59 ± 0.02
 Final P (mg/g) 1.21 ± 0.01a 1.21 ± 0.0a 1.21 ± 0.01a 1.23 ± 0.03a
 Initial K (mg/g) 1.09 ± 0.02 1.09 ± 0.03 1.09 ± 0.04 1.10 ± 0.03
 Final K (mg/g) 1.51 ± 0.06a 1.51 ± 0.08a 1.53 ± 0.07a 1.53 ± 0.01a

Data are represented as mean ± SE.

Values within the same row with different superscript letters are significantly different (p < 0.05).

N, nitrogen; P, phosphate; K, potassium.

Download Excel Table
Nutrient uptake and recovery

The nutrient uptake by the fish showed that N uptake ranges from 250.0–259.1 g/culture unit, P from 46.4–51.4 g/culture unit, and K from 22.0–22.6 g/culture unit. There was no significant difference (p > 0.05) in the NPK uptake by the fish across the treatments (Table 6). Similarly, there was no significant difference (p > 0.05) in the NPK uptake by the crayfish across the treatments. The nutrient uptake in relation to the total system showed that there were no significant differences (p > 0.05) across the treatments in the NPK uptake by O. basilicum and the total system.

Table 6. NPK total uptake (g/culture unit) in hybrid lemon fin barb, red claw crayfish, and Ocimum basilicum exposed to different night lighting regimen in a polyculture aquaponic system
Nutrient uptake (g/culture unit) 0 h 4 h 8 h 12 h
Fish
 N 250.34 ± 10.34a 253.36 ± 18.98a 259.09 ± 25.03a 254.14 ± 13.63a
 P 46.36 ± 0.65a 50.21 ± 2.76a 50.82 ± 3.73a 51.38 ± 4.20a
 K 22.49 ± 0.89a 22.02 ± 0.67a 22.64 ± 0.21a 22.45s ± 0.90a
Crayfish
 N 23.36 ± 4.27a 24.44 ± 4.27a 26.68 ± 3.55a 26.59 ± 2.30a
 P 1.45 ± 0.36a 1.47 ± 0.21a 1.56 ± 0.16a 1.61 ± 0.07a
 K 0.53 ± 0.11a 0.55 ± 0.12a 0.59 ± 0.1a 0.60 ± 0.11a
Total (fish and crayfish)
 N 273.71 ± 12.06a 277.8 ± 17.78a 285.76 ± 22.56a 280.73 ± 11.73a
 P 47.81 ± 0.80a 51.68 ± 2.65a 52.38 ± 3.57a 52.99 ± 4.13a
 K 23.01 ± 1.45a 22.57 ± 0.73a 23.24 ± 0.9a 23.05 ± 1.15a
O. basilicum (cycle 1)
 N 119.26 ± 4.07a 122.86 ± 7.15a 123.76 ± 4.51a 122.77 ± 1.97a
 P 4.38 ± 0.16a 4.56 ± 0.18a 4.60 ± 0.07a 4.58 ± 0.25a
 K 5.64 ± 0.21a 5.79 ± 0.31a 5.81 ± 0.11a 5.83 ± 0.24a
O. basilicum (cycle 2)
 N 134.36 ± 1.96a 134.75 ± 7.47a 135.31 ± 5.54a 135.07 ± 7.14a
 P 5.20 ± 0.11a 5.20 ± 0.28a 5.24 ± 0.21a 5.31 ± 0.39a
 K 6.22 ± 0.36a 6.19 ± 0.04a 6.33 ± 0.12a 6.34 ± 0.31a
Total herb (2-cycles)
 N 253.63 ± 5.71a 257.61 ± 12.76a 259.07 ± 10.05a 257.84 ± 9.01a
 P 9.57 ± 0.22a 9.76 ± 0.40a 9.83 ± 0.28a 9.89 ± 0.63a
 K 11.86 ± 0.39a 11.98 ± 0.35a 12.14 ± 0.08a 12.18 ± 0.46a
System total
 N 527.33 ± 14.37a 535.40 ± 21.13a 544.83 ± 13.40a 538.57 ± 4.95a
 P 57.39 ± 0.99a 61.44 ± 2.51a 62.21 ± 3.30a 62.88 ± 3.70a
 K 34.87 ± 1.84a 34.55 ± 1.0a 35.38 ± 0.91a 35.23 ± 1.21a

Data are represented as mean ± SE.

Values within the same row with different superscript letters are significantly different (p < 0.05).

N, nitrogen; P, phosphate; K, potassium.

Download Excel Table

The percentage nutrient recovery of hybrid lemon fin barb and red claw crayfish cultured with O. basilicum under different night lighting regimes is shown in Table 7. There were no significant differences (p > 0.05) across the treatments in NPK recovery from both fish and crayfish. However, the nutrient recovered from O. basilicum in both cycles was similar and there were no significant differences (p > 0.05) in % NPK recovered across the treatments in both cycles. The system total P recovered from 4–12 h-treatments was significantly higher (p < 0.05) than the system total P recovered.

Table 7. Nutrient recovery (%) of hybrid lemon fin barb, red claw crayfish, and Ocimum basilicum exposed to different night light regimen in a polyculture aquaponic system
% Recovery 0 h 4 h 8 h 12 h
Fish
 N 30.94 ± 1.83a 31.20 ± 0.67a 31.61 ± 1.90a 30.81 ± 0.58a
 P 44.58 ± 2.38a 48.16 ± 0.27a 48.30 ± 2.11a 48.27 ± 1.78a
 K 37.63 ± 1.43a 37.04 ± 0.84a 37.73 ± 0.17a 37.06 ± 1.55a
Crayfish
 N 18.69 ± 0.61a 19.40 ± 0.81a 20.14 ± 1.71a 20.48 ± 0.96a
 P 9.32 ± 0.39a 9.70 ± 0.35a 9.70 ± 0.50a 10.25 ± 0.67a
 K 6.07 ± 0.18a 6.23 ± 0.63a 6.36 ± 0.81a 6.57 ± 0.81a
Total (fish and crayfish)
 N 49.64 ± 1.95a 50.60 ± 0.45a 51.75 ± 1.26a 51.28 ± 0.39a
 P 53.89 ± 1.99a 57.87 ± 0.53a 58.01 ± 1.62a 58.51 ± 2.20a
 K 43.70 ± 1.59 43.27 ± 1.41a 44.10 ± 0.66a 43.63 ± 0.86a
O. basilicum (cycle 1)
 N 11.39 ± 0.78a 11.75 ± 0.39a 11.64 ± 0.32a 11.26 ± 0.53a
 P 3.78 ± 0.28a 4.11 ± 0.10a 4.05 ± 0.08a 3.98 ± 0.32a
 K 7.71 ± 0.44a 7.85 ± 0.27a 7.76 ± 0.23a 7.63 ± 0.61a
O. basilicum (cycle 2)
 N 12.86 ± 0.98a 12.95 ± 0.98a 12.73 ± 0.41a 12.41 ± 1.00a
 P 4.51 ± 0.43a 4.70 ± 0.36a 4.61 ± 0.13a 4.63 ± 0.50a
 K 8.51 ± 0.66a 8.43 ± 0.43a 8.45 ± 0.06a 8.30 ± 0.72a
Total herb (2-cycles)
 N 24.25 ± 1.74a 24.70 ± 1.29a 24.37 ± 0.73a 23.66 ± 1.52a
 P 8.29 ± 0.71a 8.81 ± 0.46a 8.66 ± 0.19a 9.00 ± 0.58a
 K 16.23 ± 0.92a 16.29 ± 0.61a 16.21 ± 0.17a 15.92 ± 1.28a
System total
 N 73.89 ± 3.54a 75.30 ± 1.49a 76.13 ± 0.89a 74.95 ± 1.13a
 P 62.19 ± 2.68b 66.68 ± 0.90a 66.67 ± 1.68a 67.12 ± 2.66a
 K 59.92 ± 2.19a 59.56 ± 1.96a 60.30 ± 0.79a 59.55 ± 2.11a

Data are represented as mean ± SE.

Values within the same row with different superscript letters are significantly different (p < 0.05).

N, nitrogen; P, phosphate; K, potassium.

Download Excel Table

Discussion

Water quality parameters are very important variables of interest in a polyculture aquaponic system for optimum growth of fish and plants (Martan, 2008; Oladimeji et al., 2020). This is because water quality imbalances such as high ammonia levels could be detrimental to fishes raised in such a closed aquaculture system. The levels of most water qualities observed in the current study are in line with the reports of Boyd & Gross (2000) and Yildiz et al. (2017) and are considered safe for the culture of experimental organisms (crayfish and fish) used. Generally, the photoperiods have no significant effect on the water qualities observed in this study across the treatments, and this is similar to the reports by Liang & Chien (2013) and Ogah et al. (2020b). The decrease in pH levels in the culture tanks and plant trough outlets under the different light regimes could be attributed to nitrate accumulation in the biofilter during the culture period (Boyd & Gross, 2000; Oommen et al., 2019). Also, the levels and variations of the EC observed in this study were higher than in the earlier study by Ogah et al. (2020b) which reported 0.25–0.42 mS/cm in a similar polyculture aquaponic system. Maintaining high DO in a bicultural aquaponic system cannot be over-emphasized as it helps with the breakdown of organic materials in the culture water, therefore making available sufficient nutrients for plant absorption and improved health (Eck et al., 2019; Rakocy et al., 2006). The current study also observed that the DO for the polyculture aquaponic system used was within the recommended range for aquaculture purposes (Yildiz et al., 2017) and may have been made possible because of the provision of aeration mechanisms that supply additional DO to the system. The water temperature observed in this study falls within the optimum range for fish growth in aquaponics (Yildiz et al., 2017) and is also similar to the report by Ogah et al. (2020b) which reported 27°C–29°C in a similar aquaponic system. However, there was a noticeable drop in water temperature at weeks 4 and 6, and this could be attributed to substantial water replenishment in the culture tanks due to water loss. Water loss in aquaponic systems could be a result of leaf transpiration and evaporation from the system (Liang & Chien, 2013).

Most importantly, the ammonia level in this study suggests that the organisms raised in the polyculture aquaponics system may have had no risk of ammonia toxicity. Consequently, this explains the similarity in the survival of the experimental fishes as observed in the various treatments. In a similar case, the survival and growth of hybrid lemon fin barb and red claw crayfish in this study were not significantly affected by the different durations of lighting provided for the O. basilicum. This observation is in line with the findings of El-Sayed & Kawanna (2004), who observed that there were no differences in the growth performance of Nile tilapia fingerlings reared under four different photoperiods, and Ogah et al. (2020b), who observed no differences in the growth of hybrid lemon fin barb reared with peppermint exposed to different durations of night lighting in a polyculture aquaponic system. It should be noted that the fish in this study and those of Ogah et al. (2020b) were not directly exposed to the different prolonged lighting. Hence, this could be the reason for the disparity in the performance evaluation compared with those of Liang & Chien (2015) who reported improved growth performance of tilapia and loach exposed directly to prolonged night lighting in a raft aquaponic system.

According to Avgoustaki (2019), one of the most important factors for evaluating growth conditions and consumer choices for vegetables and herbs is plant quality. The indices of plant quality as opined by researchers include colour, shape, height, size (morphometry) of herb leaves, and yield (McElroy et al., 2004; Miguel et al., 2002; Zhang et al., 2018). In conventional farming, photoperiod plays an important role in the size/area of leaves and biomass (Adams & Langton, 2005). The assumption at the beginning of the current study was that an increase in the supplementary night lighting (or illumination period) would result in a significant increase in yield compared to the O. basilicum grown under control. However, the result of the current study is at variance with this assumption as it is observed that there is no significant difference in all morphometry parameters taken from the O. basilicum grown under the increased illumination periods. Similarly, McElroy et al. (2004) had earlier reported that the root weights of Florida betony exposed to long-day and short-day photoperiods were similar after 10 weeks of culture. In contrast, the study by Ogah et al. (2020b) observed a 19% higher yield, stem length, and leaf numbers in peppermint plants exposed to 12 h additional night lighting in a polyculture aquaponic system when compared with the control group. Also, Miguel et al. (2002) reported higher fresh mass yields of several medicinal herbs when they were exposed to a longer day length. The observed differences in the responses of the different plants to additional night lighting may be due to the differences in their biology and photoperiodic preferences. Nonetheless, Zhang et al. (2018) had earlier hypothesized that the differences in the ability of different plants to use larger amounts of carbohydrates for physiological metabolism activities/growth could explain the diversity of performance of plants under different photoperiods.

The trends of NPK recoveries by red claw crayfish, hybrid lemon fin barb, and the O. basilicum in this experiment were similar irrespective of the different supplementary night lighting regimes to which the O. basilicum were subjected. Whiteman & Room (1991) had earlier stated that temperature may have a direct effect on the nutrient absorption capacity of organisms. However, the additional lighting was not observed to increase the temperature of the system or environment, which may partly justify the similarities in the NPK recoveries of the treatments and control groups. However, Ogah et al. (2020b) had earlier reported that additional night lighting did not affect growth and NPK recoveries of hybrid lemon fin barb, and their finding is in contrast with the present study, which showed an 18% nutrient uptake of the peppermint plant exposed to the prolonged night lighting. Differences in the biology and photoperiod preferences of the two plants used may explain the performance differences. The recovery of 0.04 % P and 1.68 % K in cucumber co-cultured with common carp in an aquaponic system was reported by Guzel et al. (2018), while Ogah et al. (2020b) reported 4.54%–8.15% N, 0.94%–1.91% P and 2.06%–2.31% K recovery rate by peppermint in a similar aquaponic system. These reports show that O. basilicum in the present study has a higher NPK recovery than the reported plants. A study by Moustafa et al. (2020), which reported 25.8% N and 2.74% P recovery in a RAS with Nile tilapia, was lower compared to the observations of this study for fish (30.81%–31.2% N; 44.58%–48.3% P) and crayfish (18.96%–20.48% N; 9.32%–10.25% P). The differences in nutrient recoveries may be linked to the different culture systems used in both studies.

Conclusion

The findings of this study showed that varying supplementary night lighting has no significant effect on the growth performance of O. basilicum, hybrid lemon fin barb, as well as red claw crayfish. A similar observation was made with respect to their nutrient recoveries and water qualities. Future studies should also investigate the effect of exposing the fish directly to different light regimes (such as light intensity, source, and quality) on the performance of fish and plants co-cultured in the aquaponic system.

Competing interests

No potential conflict of interest relevant to this article was reported.

Funding sources

This study was supported by Ministry of Higher Education, Malaysia through a Satreps-Cosmo Grant no. 63000854-10201.

Acknowledgements

Not applicable.

Availability of data and materials

Upon reasonable request, the datasets of this study can be available from the corresponding author.

Ethics approval and consent to participate

The authors confirm that the ethical policies of the journal have been adhered to and the appropriate ethical review committee approval has been received. The US National Research Council’s guidelines for the Care and Use of Laboratory Animals were followed.

References

1.

Adams SR, Langton FA. Photoperiod and plant growth: a review. J Hortic Sci Biotechnol. 2005; 80:2-10

2.

Ahmed AF, Attia FAK, Liu Z, Li C, Wei J, Kang W. Antioxidant activity and total phenolic content of essential oils and extracts of sweet basil (Ocimum basilicum L.) plants. Food Sci Hum Wellness. 2019; 8:299-305

3.

Association of Official Analytical Chemists [AOAC]. Changes in Official Methods of Analysis Made at the Annual Meeting.In In: Cunnif PA, editor.editor Official Methods of Analysis of AOAC International. 16 ed Arlington, TX: AOAC. 1997.

4.

Avgoustaki DD. Optimization of photoperiod and quality assessment of basil plants grown in a small-scale indoor cultivation system for reduction of energy demand. Energies. 2019; 12:3980

5.

Bader N. Sample preparation for flame atomic absorption spectroscopy: an overview. Rasāyan J Chem. 2011; 4:49-55.

6.

Boyd CE, Gross A. Water use and conservation for inland aquaculture ponds. Fish Manag Ecol. 2000; 7:55-63

7.

Dou H, Niu G, Gu M, Masabni JG. Responses of sweet basil to different daily light integrals in photosynthesis, morphology, yield, and nutritional quality. HortScience. 2018; 53:496-503

8.

Eck M, Körner O, Jijakli MH. Nutrient cycling in aquaponics systems.In In: Goddek S, Joyce A, Kotzen B, Burnell GM, editors.editors Aquaponics food production systems: combined aquaculture and hydroponic production technologies for the future. Cham: Springer. 2019; p p. 231-46

9.

El-Sayed AFM, Kawanna M. Effects of photoperiod on the performance of farmed Nile tilapia Oreochromis niloticus: I. growth, feed utilization efficiency and survival of fry and fingerlings. Aquaculture. 2004; 231:393-402

10.

Fernández-Cabanás VM, Pérez-Urrestarazu L, Juárez A, Kaufman NT, Gross JA. Comparative analysis of horizontal and vertical decoupled aquaponic systems for basil production and effect of light supplementation by LED. Agronomy. 2020; 10:1414

11.

Guzel S, Odun UC, Cakmakcİ T, Cakmakcİ O, Sahİn U. The effect of cucumber (Cucumis sativus) cultivation in aquaponic and hydroponic systems on plant nutrient elements and antioxidant enzyme activity. Fresenius Environ Bull. 2018; 27:553-8.

12.

Hasan Z, Dhahiyat Y, Andriani Y, Zidni I. Water quality improvement of Nile tilapia and catfish polyculture in aquaponics system. Nus Biosci. 2017; 9:83-5

13.

Liang JY, Chien YH. Effects of feeding frequency and photoperiod on water quality and crop production in a tilapia–water spinach raft aquaponics system. Int Biodeterior Biodegrad. 2013; 85:693-700

14.

Liang JY, Chien YH. Effects of photosynthetic photon flux density and photoperiod on water quality and crop production in a loach (Misgurnus anguillicandatus)–nest fern (Asplenium nidus) raft aquaponics system. Int Biodeterior Biodegrad. 2015; 102:214-22

15.

Love DC, Fry JP, Li X, Hill ES, Genello L, Semmens K, et al. Commercial aquaponics production and profitability: findings from an international survey. Aquaculture. 2015; 435:67-74

16.

Malayeri SH, Hikosaka S, Ishigami Y, Goto E. Growth and photosynthetic rate of Japanese mint (Mentha arvensis) grown under controlled environment. VI Intern Symp Light Horticult. 2011; 907:73-9

17.

Martan E. Polyculture of fishes in aquaponics and recirculating aquaculture. Aquaponics J. 2008; 48:28-33.

18.

McElroy JS, Yelverton FH, Neal JC, Rufty TW. Influence of photoperiod and temperature on vegetative growth and development of Florida betony (Stachys floridana). Weed Sci. 2004; 52:267-70

19.

Miguel MG, Duarte F, Venâncio F, Tavares R, Guerrero C, Martins H, et al. Changes of the chemical composition of the essential oil of portuguese Thymus mastichina in the course of two vegetation cycles. Acta Hortic. 2002; 83:6

20.

Moustafa YTA, Ali A, Gomha SAA. Nitrogen and phosphorus budget for Nile tilapia hatchery. Egypt J Aquac. 2020; 10:1-22

21.

Nuwansi KKT, Verma AK, Tiwari VK, Prakash C, Chandrakant MH. Standardization of the stocking density ratios of koi carp (Cyprinus carpio var. koi): goldfish (Carassius auratus) in polyculture aquaponic recirculating system. Turk J Fish Aquat Sci. 2017; 17:1271-8

22.

Ogah SI, Kamarudin MS, Nurul-Amin SM, Puteri Edaroyati MW. Nutrient recycling through aquaponics and night-lighting. J Environ Biol. 2020b; 41:1113-25

23.

Ogah SI, Kamarudin MS, Nurul Amin SM, Wahab Puteri Edaroyati M. Biological filtration properties of selected herbs in an aquaponic system. Aquac Res. 2020a; 51:1771-9

24.

Oladimeji AS, Olufeagba SO, Ayuba VO, Sololmon SG, Okomoda VT. Effects of different growth media on water quality and plant yield in a catfish-pumpkin aquaponics system. J King Saud Univ Sci. 2020; 32:60-6

25.

Oommen AK, Saji A, Joseph S, Kuriakose BP. Automated water quality monitoring system for aquaponics. Int Res J Eng Technol. 2019; 6:7832-41.

26.

Ouzounis T, Rosenqvist E, Ottosen CO. Spectral effects of artificial light on plant physiology and secondary metabolism: a review. HortScience. 2015; 50:1128-35

27.

Petrucio MM, Esteves FA. Influence of photoperiod on the uptake of nitrogen and phosphorus in the water by Eichhornia crassipes and Salvinia auriculata. Rev Bras Biol. 2000; 60:373-9

28.

Rakocy JE. Aquaponics—integrating fish and plant culture. Aquac Prod Syst. 2012; 344:86

29.

Rakocy JE, Masser MP, Losordo TM. Recirculating aquaculture tank production systems: aquaponics—integrating fish and plant culture [Internet]. SRAC. 2006.[cited 2023 Jun 5]https://fisheries.tamu.edu/files/2013/09/SRAC-Publication-No.-454-Recirculating-Aquaculture-Tank-Production-Systems-Aquaponics-Integrating-Fish-and-Plant-Culture.pdf.

30.

Whiteman JB, Room PM. Temperatures lethal to Salvinia molesta Mitchell. Aquat Bot. 1991; 40:27-35

31.

Yildiz HY, Robaina L, Pirhonen J, Mente E, Domínguez D, Parisi G. Fish welfare in aquaponic systems: its relation to water quality with an emphasis on feed and faeces—a review. Water. 2017; 9:13

32.

Zhang X, He D, Niu G, Yan Z, Song J. Effects of environment lighting on the growth, photosynthesis, and quality of hydroponic lettuce in a plant factory. Int J Agric Biol Eng. 2018; 11:33-40