
Introduction
Biological diversity is the variability among living organisms from all sources, including diversity within species, between species, and within ecosystems (United Nations, 1992). Aquatic ecosystems consist of communities of several living organisms in the water, such as fishes, shrimps and mollusks. Fishes were the first vertebrates to evolve and are also the most diverse and numerous vertebrates on Earth. Over one-half of the world’s living vertebrate species (32,000 out of 60,000) are fishes (Nelson et al., 2016). According to a report on the diversity of freshwater fish in Thailand in 1997, there were 570 species from 56 families, of which at least 50 were unprecedented and unidentified species (Vidthayanon et al., 1997). In 2017, at least 858 species in 81 families were listed, up to 70 species of which were from unidentified taxa, while at least 137 species were threatened (Vidthayanon, 2017). Human activities often affect biodiversity, causing degradation or loss (United Nations, 1992), including of genetic diversity (Nguyen et al., 2022). Sustainable development is a process for resource management and sustainable utilization. However, the correct identification of species is required to assess and understand the biodiversity of an ecosystem and is the first step in biological research (Kürzel et al., 2022).
Generally, the species identification of fishes is based on morphology, such as body shape, numbers of fin rays, and scales in the lateral line (Nelson et al., 2016). However, several fish species have very similar appearances and are difficult to correctly identify. Even one species in different developmental stages or fishery products may also cause errors in the identification of species. DNA-based identification called “DNA barcoding” is utilized because it is an accurate and rapid technique for nonexpert taxonomists. DNA barcoding is the partial sequencing of a mitochondrial DNA gene. Mitochondrial DNA evolves faster than nuclear DNA, producing a higher degree of sequence variation (Stoneking & Soodyall, 1996), which is suitable for distinguishing fish species. Several genes have been used as DNA barcodes. The cytochrome b (Cytb) gene has been effectively utilized to identify diverse vertebrate animals (Parson et al., 2000), including fishes such as chub and spotted mackerels (Sezaki et al., 2001), family Goodeidae (Doadrio & Dominguez, 2004), four Thunnus tuna species (Lin et al., 2005), Acipenser gueldenstaedtii, Acipenser stellatus and Huso huso (Qiftci et al., 2013).
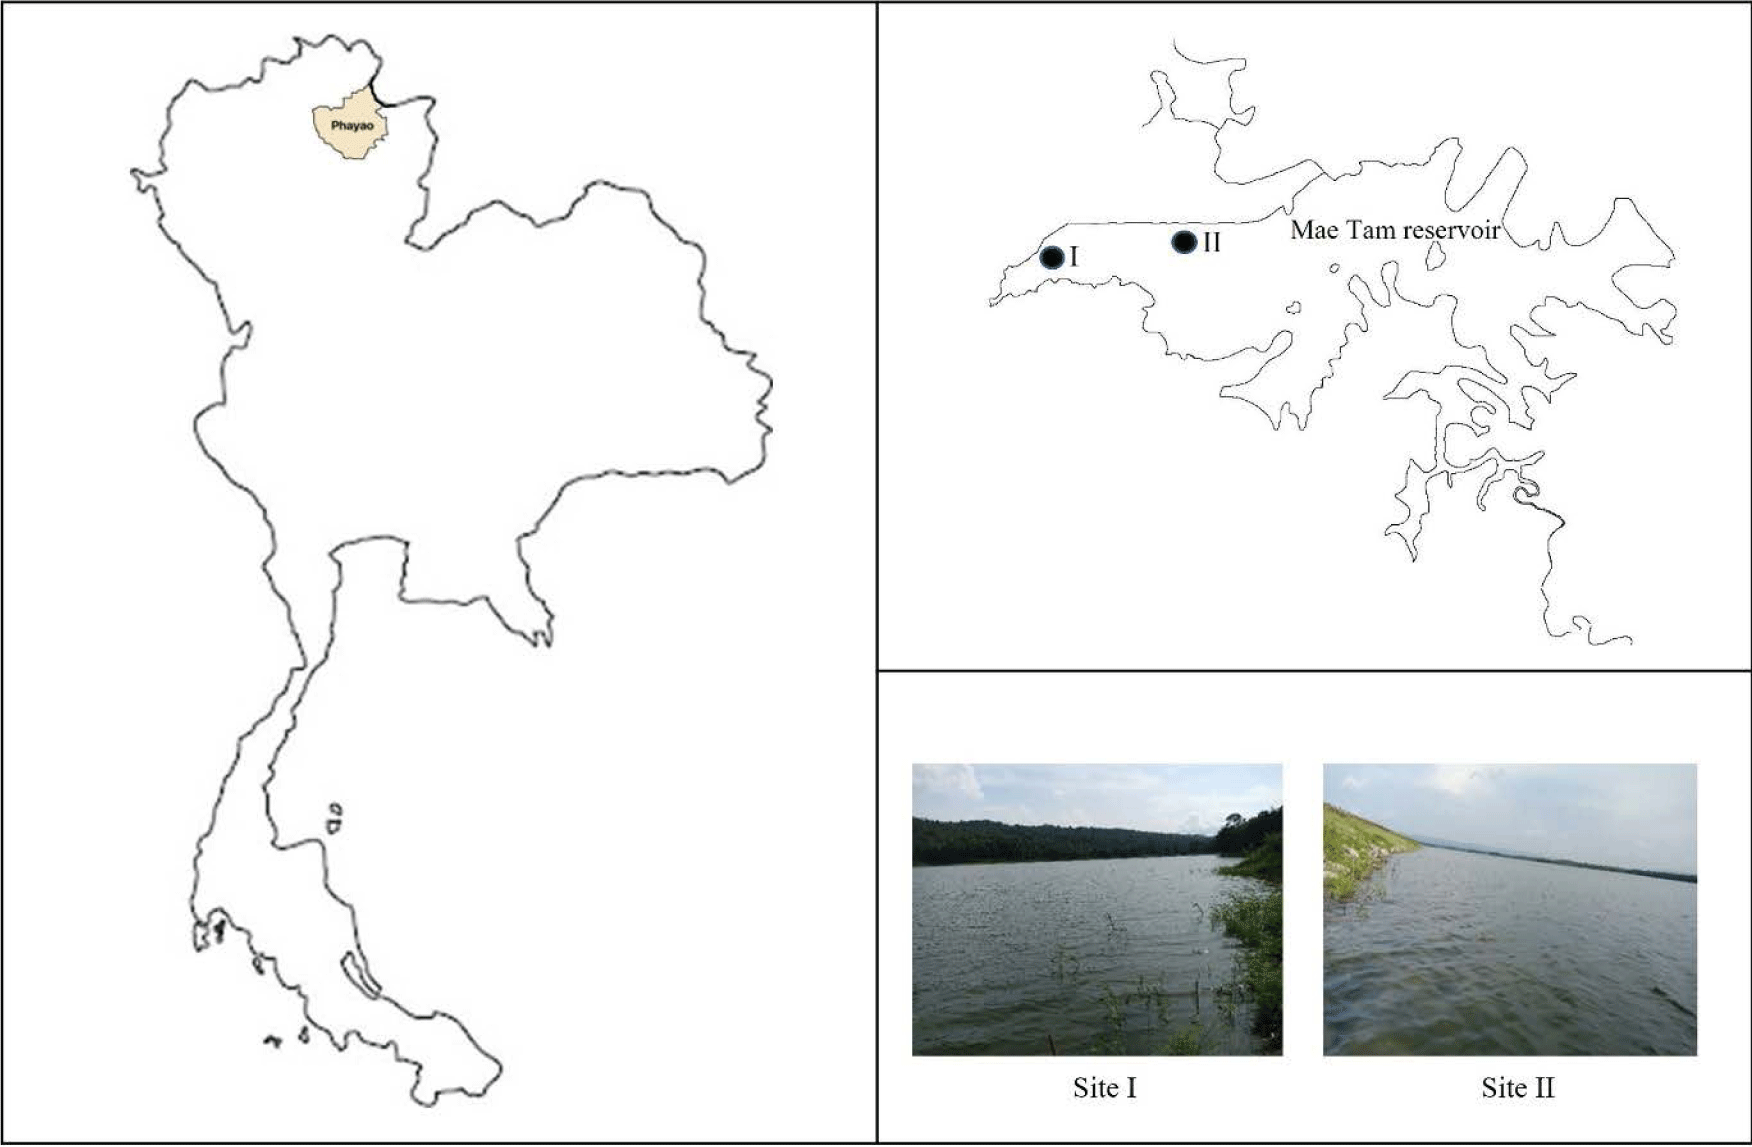
Mae Tam reservoir is located in Mueang district, Phayao province, Thailand. It has the longest reservoir ridge in northern Thailand, approximately 1,800 meters long. Its capacity is 37 million cubic meters (MaeKa Subdistrict Municipality, 2023). This reservoir is one of the Projects Initiated by His Majesty King Bhumibol Adulyadej that the Royal Irrigation Department considered construction in 1981 to supply water to farmers in the Muang and Dok Kham Tai districts for use in agriculture. It is also a source of fish breeding for the communities around the reservoir. In a study of the diversity of fish species in the Mae Tam reservoir, a total of 8 families and 15 species were found (Soontornprasit & Sangsrichan, 2014). The environment of the reservoir has changed over time, which along with the advent of more efficient fishing gear, may affect the species, diversity and quantity of fish caught.
The aims of this research were to identify fish species using DNA barcodes of the partial Cytb gene and to assess the diversity of fishes in the Mae Tam reservoir, Thailand. The fish samples were collected using gillnets with 3 mesh sizes at 2 sampling sites in 3 seasons. Fish diversity was assessed through diversity, richness, and evenness indices. In addition, the catch per unit effort (CPUE) was calculated for measurement the relative abundance of fish species. The obtained data can be used as basic information for planning the conservation and management of aquatic animal resources in the Mae Tam reservoir for sustainable utilization.
Materials and Methods
Fish samples were collected using gillnets with one of three different mesh sizes, 30, 50, and 70 mm. The seasons of sampling were winter (February 2018), summer (May 2018), and the rainy season (September 2018). Two study sites were selected: site I (19°00’13.3”N 99°56’26.5”E) was far from any human activities, while site II (19°00’15.3”N 99°56’55.2”E) was near the road on the ridge of the reservoir, which has many human activities, such as fishing, feeding the fishes and picnicking (Fig. 1). Gillnets were laid in the evening and were gathered in the morning of the next day, after a duration of laying of 12 hours. Total fish of each mesh size gillnet were photographed, counted, and weighed.
Similar-looking fish were grouped together. Species classification based on morphology was performed according to the fish taxonomy of Nelson et al. (2016). The representative fish were stored in absolute ethanol at room temperature until DNA extraction.
Because some fish samples could not be identified at the species level and for confirmation of the species that could be morphologically identified, DNA barcoding was utilized. The fish fin of each representative sample was extracted for genomic DNA isolation using 20 mg/mL protease, followed by the standard phenol-chloroform extraction method (Sambrook & Russell, 2001). The quality of extracted DNA was determined using 1.2% agarose gel electrophoresis, immersion in Novel Juice (Bio-Helix, New Taipei City, Taiwan) and exposure to UV light. The good-quality DNA was stored at -20°C.
The partial fragments of the Cytb gene were amplified by polymerase chain reaction (PCR) using primers L14735: 5’-AAAAACCACCGTTGTTATTCAACTA-3’ and H15149AD: 5’-GCICCTCARAATGAYATTTGTCCTCA-3’ (Burgener, 1997). The 25 μL PCR mixture consisted of 2.5 μL of 10x Taq buffer, 1 mL of 50 mM MgCl2, 2 μL of 2.5 mM dNTPs, 0.3 μL of 1 U Taq DNA polymerase (Bio-Helix), 2 μL of each 10 μM primer and 1 μL of extracted DNA (100 ng/μL). The thermal cycling program was 35 cycles of denaturation at 94 °C for 40 s, annealing at 50°C for 80 s and extension at 72 °C for 80 s (Sotelo et al., 2001). The PCR products were identified using 1.2% agarose gel electrophoresis.
The visible PCR products were purified using the HiYield™ Gel/PCR DNA Fragments Extraction kit (RBC Bioscience, New Taipei City, Taiwan) according to the manufacturers instructions. The purified PCR product was sequenced at Macrogen (Seoul, Korea).
All nucleotide sequences were determined the stop codons, insertions and deletions by eye using the Chromas program (Technelysium, Queensland, Australia) and ORF finder (https://www.ncbi.nlm.nih.gov/orffinder/). The scientific name of each sample was determined by comparing its sequence with references in the GenBank database using the Basic Local Alignment Search Tool (BLAST; https://blast.ncbi.nlm.nih.gov/Blast.cgi). As a basic criterion for species identification, a sampled sequence had to match a top hit of a reference sequence with more than 98% similarity (Ward et al., 2009). All sequences have been deposited in GenBank (accession numbers OQ561413-OQ561446).
The identified fish species were classified according to the fish taxonomic system of Nelson et al. (2016). The conservation status of each fish species was found on the International Union for Conservation of Nature (IUCN) Red List of Threatened Species version 2022-2 (https://www.iucnredlist.org) as of February 2023.
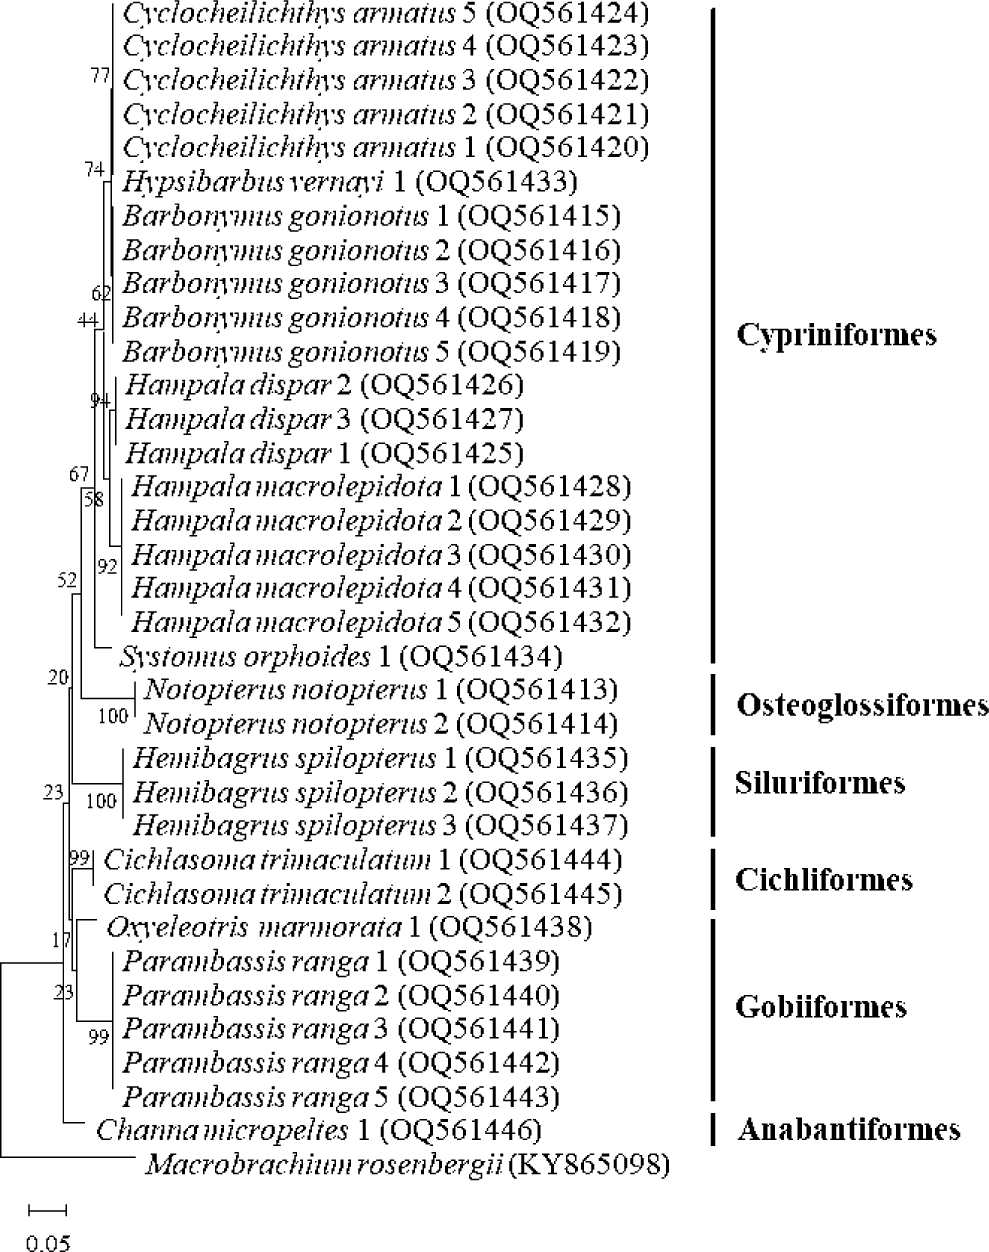
For evolutionary relationship analysis, a phylogenetic tree of translated amino acid sequences was constructed by the neighbor-joining method (Saitou & Nei, 1987) using the program MEGA11 (Tamura et al., 2021) with 1,000 bootstrap replications. The Cytb sequence of Macrobrachium rosenbergii (accession no. KY865098) was used as an outgroup species sequence. The intraspecies distances were also calculated using MEGA11 (Tamura et al., 2021).
Fish diversity was measured by the indices diversity, richness and evenness, which were calculated using the following formulas:
where H = diversity index, and Pi = number of individuals of species i/total number of sample (Shannon & Weaver, 1949);
where R = richness index, S = number of different species in the sample, and n = total number of individual species in the sample (Margalef, 1968); and
where E = evenness index, H = Shannon-Weiner diversity index, and S = number of different species in the sample (Pielou, 1966).
CPUE was calculated according to the formula of Swingle (1950):
Moreover, the frequency of occurrence of each fish species at each sampling site and season was calculated following Kolding (1989).
Results and Discussion
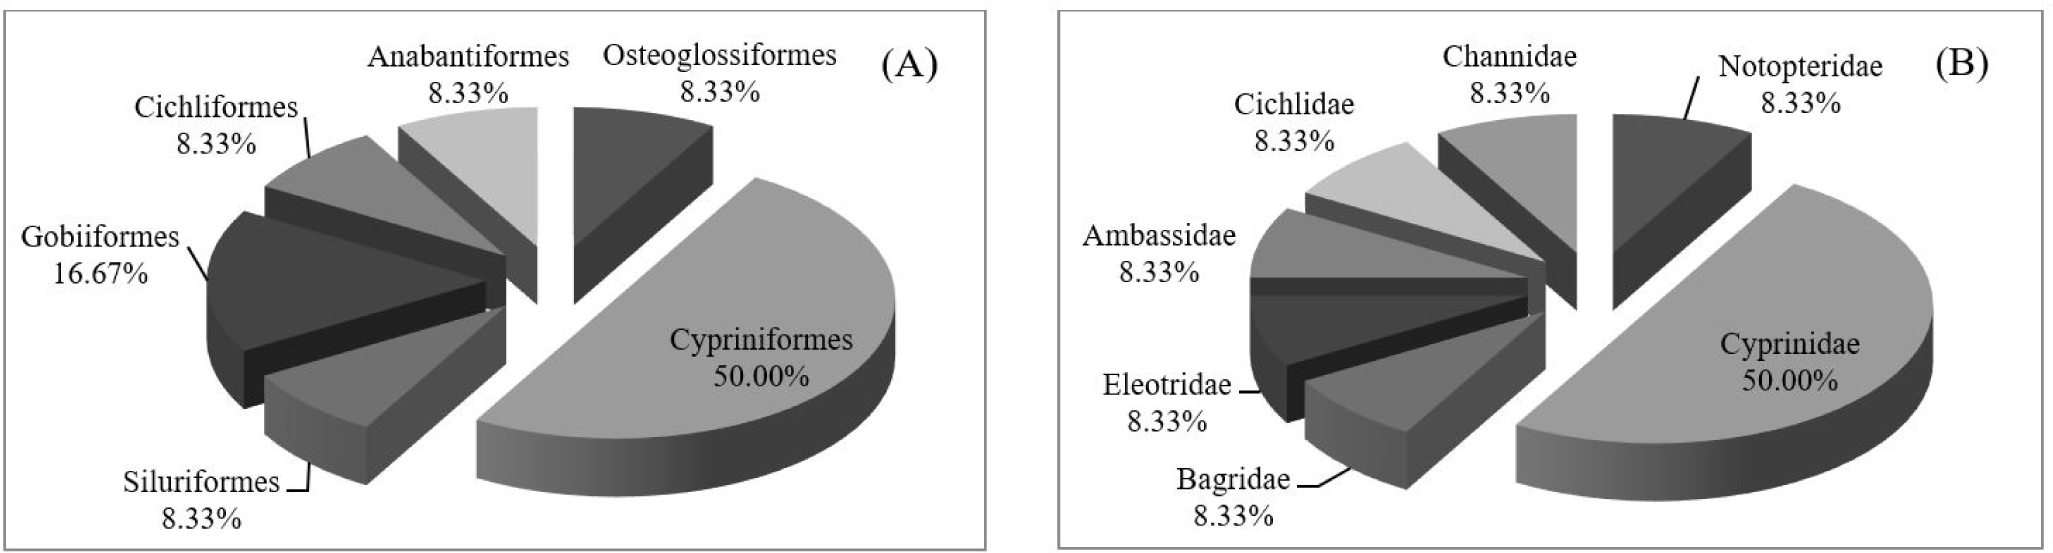
A total of 34 representative fish samples were morphologically identified to 12 species, 11 genera, 7 families and 6 orders according to Nelson et al. (2016). The most abundant order was Cypriniformes (50.00%), followed by Gobiiformes (16.67%) (Fig. 2A). Cyprinidae was the most abundant family (50.00%) (Fig. 2B). Cypriniformes is the most diverse fish order in Southeast Asia (Nelson et al., 2016), including in Thailand. Moreover, family Cyprinidae is the most common and the largest family of freshwater fish, followed by family Gobiidae (Nelson et al., 2016). As for their IUCN status, all species were assessed as least concern except Systomus orphoides, which was not evaluated. One cichlid fish could not be identified at the species level from morphology due to the inexperience of the researchers. Thus, molecular-based identification was necessary in this study to specifically identify this species and confirm the identities of the remaining species.
A molecular-based identification technique, DNA barcoding is one tool that has gained attention and is widely used for identification of organism species. The Cytb gene fragments could be successfully amplified in all fish samples. From comparison with reference sequences in the database, all samples could be identified at the species level with 98.97%-100% identity (Table 1) according to the criteria of Ward et al. (2009). The average length of the Cytb gene was 390 bp, ranging from 381 to 396 bp, and we found no stop codons, insertions, or deletions. Therefore, these nucleotide sequences were deemed normal.
We picked twelve species to classify with both DNA barcoding and morphology. One cichlid fish could not be identified to the species level by morphology but could be identified by DNA barcoding: Cichlasoma trimaculatum, which had 99.74%-100% identity. This exotic cichlid is an alien species that was introduced into Thailand for ornamental purpose (Silarudee & Kongchum, 2008). Because of its predacious nature (Daniel et al., 2020), the infestation of C. trimaculatum into the natural waters would cause many impacts. C. trimaculatum's habit of eating smaller fishes creates a hazard to the biodiversity of native fishes (Daniel et al., 2020). Many natural waters were infested with this invasive species, including Madambakkam Lake, India (Daniel et al., 2020), Lake Buluan, Philippines (Noquilla, 2021), and Lake Mahalona, Indonesia (Nasution et al., 2022).
One main advantage of DNA barcodes, including of the Cytb gene, is that the low intraspecies distances provided enable easier distinguishing of one species from others (Kartavtsev et al., 2007; Tobe et al., 2010). Ward et al. (2005) mentioned that the successful identification of species depended on the nucleotide sequences being more similar than those of different species. Generally, the mitochondrial Cytb gene of fishes presented intraspecific differences of less than 1%, while interspecific differences were higher than 10% (Li et al., 2018; Shen et al., 2013). In the present study, the low intraspecies distances ranged from 0.0% to 0.3% (Table 1), as in several fishes including, six flatfish species (0.46 ± 0.19%) (Kartavtsev et al., 2007), A. gueldenstaedtii (0.42%), A. stellatus (0.32%) and H. huso (0.17%) (Qiftci et al., 2013). From the relationship analysis, the phylogenetic tree of Cytb gene also showed that each given fish species was clustered together with itself (Fig. 3). In addition, 12 fish species were correctly grouped according to the taxonomic system. The number of sequences of fish deposited in the GenBank database is rapidly increasing, and invalid or incorrectly identified species may be submitted, depending on personal experience. The low values of divergence and phylogenetic tree of the Cytb gene could detect the errors in numerous sequences submitted in GenBank (Li et al., 2018).
Although DNA barcoding is a useful tool for non-fish taxonomists to identify fish species. However, collaboration with fish taxonomists to confirm DNA barcoding results is necessary for correct fish species identification (Panprommin & Manosri, 2022). A database with a large amount of accurate data is useful for identifying fish species in the investigation of species diversity and in several kinds of study, including studies on different developmental stages and on the fish meat from fishery products. Therefore, the correct identification of an unknown sample depends on the availability of the sequences in the database (Parson et al., 2000).
A total of 371 individuals were collected from site I and site 11 over three seasons (Table 2). They were identified to 12 species by both morphology and DNA barcoding. From the comparison of a previous study, 15 fish species were collected monthly between January and June 2011 at 3 sampling sites using gillnets with 4 mesh sizes including 25, 40, 70, and 100 mm (Soontornprasit & Sangsrichan, 2014). Among these species, 8 species were collected in both studies. Seven species were found only in the previous study, while 4 species were found only in this study. Several factors may be affected different of fish species such as mesh sizes of gillnets, period and location of sampling (Keawkhiew et al., 2013; Soontornprasit et al., 2019b). Nowadays, the areas around this reservoir are increasingly being utilized for buildings and agricultural areas, thus, domestic wastes and the use of agricultural drugs and chemicals may be caused the water pollution. The environmental disturbances may have seriously destroyed the fish habitat and led to the decline of fish species diversity (Guo et al., 2018).
At site I, a total of 273 individuals (73.58%) were identified to 5 species, while 98 individuals (26.42%) were identified to 12 species from site II. This may be because site II is an easily accessible area and people tend to feed the fish regularly, which raised the number of fish species at site II relative to site I. Fish feeding is not only food intake directly to the fish but also increases nutrients to the water environment (Yang et al., 2021). These increased nutrients affect the diversity of the fish. Henderson & Crampton (1997) demonstrated that fish diversity in nutrient-rich habitat (108 species) was higher than nutrient- poor habitat (68 species). However, the number of individuals at site I was greater than that at site II because site I is a quiet area and has little human activity. In addition, the area of site I has several shelters, such as aquatic plants, grass, and roots. A large number of shelters contributes to the abundance of fish, as they are suitable for habitation, refuge and foraging (Chamason & Janekitkarn, 2005).
We collected 236 (63.61%) and 74 (19.95%) in winter and summer, respectively, which were identified to 7 species. We collected the fewest individuals in the rainy season, 61 (16.44%), and identified them to 5 species (Table 2). In winter and summer, these sites have less water, so more fish individuals could be collected then than in the rainy season, when there is higher water content. The different water levels in each season are an important factor for the abundance and productivity of fish (Chamason & Janekitkarn, 2005).
The independent samples t-test detected differences in various indices between the two sampling sites. The Shannon-Weiner diversity index (0.60 ± 0.04) and richness index (1.46 ± 0.01) at site II were higher (p < 0.05) than those at site I (0.45 ± 0.27 and 0.64 ± 0.47, respectively), while the evenness index presented no significant difference (p > 0.05) between the two sites (Table 3). Comparing the indices between seasons, the diversity and richness indices were the highest (p < 0.05) (0.65 ± 0.01 and 1.26 ± 0.28, respectively) in summer, while the evenness index was the highest (p < 0.05; 0.40 ± 0.00) in the rainy season. However, the average diversity indices were lower than 1, indicating low diversity (Ulfah et al., 2019). Ecosystems are abundant at low levels and may be contaminated by heavy pollution (Wilhm & Dorris, 1968), corresponding to the Margalef richness index, which represents diversity in biological populations by comparing organism communities and identifies rich or poor ecosystems by their species numbers (Malvandi et al., 2021). The evenness index ranges from 0 to 1 (Krebs, 1989). The evenness indices of this study ranged from 0.27 to 0.40, indicating that the distribution of the number of individuals of each species is not similar between sampling sites and seasons, so there is a tendency for one species to dominate (Krebs, 1989; Ulfah et al., 2019).
In this study, the CPUE was calculated for 2 sampling sites and 3 seasons (Table 4). The CPUE at site I (472.63 ± 94.66 g/100 m2/night) was higher (p < 0.05) than that at site II (340.76 ± 153.34 g/100 m2/night). Because site I was an area that was difficult to access and was not disturbed by human activities, the fishes have a chance to grow and gain more weight. Moreover, the CPUE in the rainy season (498.04 ± 249.05 g/100 m2/night) and winter (487.21 ± 4.24 g/100 m2/night) were greater (p < 0.05) than the CPUE in summer (234.84 ± 32.02 g/100 m2/night). Guo et al. (2018) demonstrated that CPUE in the wet season was higher than CPUE in the dry season. However, the average CPUE values of this study were lower than 500 g/100 m2/night, indicated that this reservoir is low abundance based on the standard of CPUE for gillnet of Sricharoendham et al. (2015). Generally, the CPUE is an index for assessment the relative abundance of fish species (Rayan et al., 2020). Two fish species could be collected at both sampling sites and in every season, Barbonymus gonionotus and Hampala macrolepidota, 100% F (Table 2). These species are economic fish that could be caught in large numbers, 67 (18.06%) and 83 (22.37%) individuals, respectively, especially in the winter and rainy seasons. In addition, since both these species spawn in the rainy season (Tuncharoen et al., 2018), the weight of the fishes was also high, which affected the CPUE. The glassy fish (Parambassis ranga) was the most dominant species in this study, with 178 (47.98%) individuals. This genus is a small fish in Thailand that is mainly distributed in several natural waters in Phayao province, including Kwan Phayao (Soontornprasit et al., 2019a) and the Nong Leng Sai Wetland (Soontornprasit et al., 2019b; Tuncharoen et al., 2020).
The CPUE using gillnets with 3 mesh sizes, including 30, 50, and 70 mm, showed that gillnets with a 50 mm mesh size had the highest average (p < 0.05), which was 474.80 ± 171.56 g/100 m2/night (Table 4), followed by gillnets with 70 and 30 mm, with averages of 417.41 ± 176.24 and 327.88 ± 115.60 g/100 m2/night, respectively. This indicated that gillnets with 50 mm mesh sizes were the most efficient at catching the fishes in the Mae Tam reservoir. The fish caught were usually medium to large in size, letting the small fish escape from the gillnets to continue to grow and reproduce.
In conclusion, twelve fish species could be identified using both morphological and DNA barcode approaches. However, one cichlid species could be specified to the species level using only the DNA barcode of the Cytb gene, although not a fish taxonomist. The various diversity indices indicated that fish diversity at both sampling sites in the Mae Tam reservoir was relatively low. However, study of other sampling sites should be undertaken for a more accurate and comprehensive assessment.