Introduction
Marine waters exhibit high biodiversity, which is supported by expansive territorial waters and diverse marine habitats (Carpenter & Niem, 1998). However, not all species have been recognized, including those in the Tondano River Estuary of Manado Bay, Indonesia. Meanwhile, increased urbanization in this area of Manado Bay poses a severe threat to marine biodiversity, particularly estuary fish species. The biodiversity issue raises concerns that some species will become extinct before being identified.
These issues prompt the need for a fast and accurate method to uncover global biodiversity before it vanishes. A quick, precise, and accurate breakthrough method is needed through DNA barcoding, which can be applied to fish in the Tondano River Estuary, Manado Bay, Indonesia. Accurate species identification is essential in ichthyology, frequently requiring genetic methods for precise classification. Basic Local Alignment Search Tool (BLAST) is widely used as a standard technique for sequence comparisons and species identification (NCBI, 2024).
The goby, a highly diverse group of fish, belongs to the family Gobiidae within the order Gobiiformes. The family Gobiidae encompasses over 2,000 species found across various aquatic habitats, including marine, coral reef, estuarine, and freshwater environments (Froese & Pauly, 2024; Hoese & Allen, 1977; Phan et al., 2023). One genus within this family is Glossogobius however, several other genera exist, such as Gobius, Apocryptes, and Stenogobius (Hoese & Allen, 2009; Phan et al., 2023). These fishes are generally small to medium-sized and typically inhabit the benthic zone, predominantly found in freshwater and brackish environments. Their distribution spans the Indo-Pacific region, encompassing areas from Africa to Southeast Asia, Australia, and the Pacific islands (Froese & Pauly, 2024; Hammer et al., 2021). Based on the above description, the objectives of this study are as follows: 1) To identify goby caught in the Tondano River Estuary using DNA Barcode; 2) To characterize the genetic profile of goby caught in the Tondano River Estuary; 3) To describe the spatial distribution of goby.
Materials and Methods
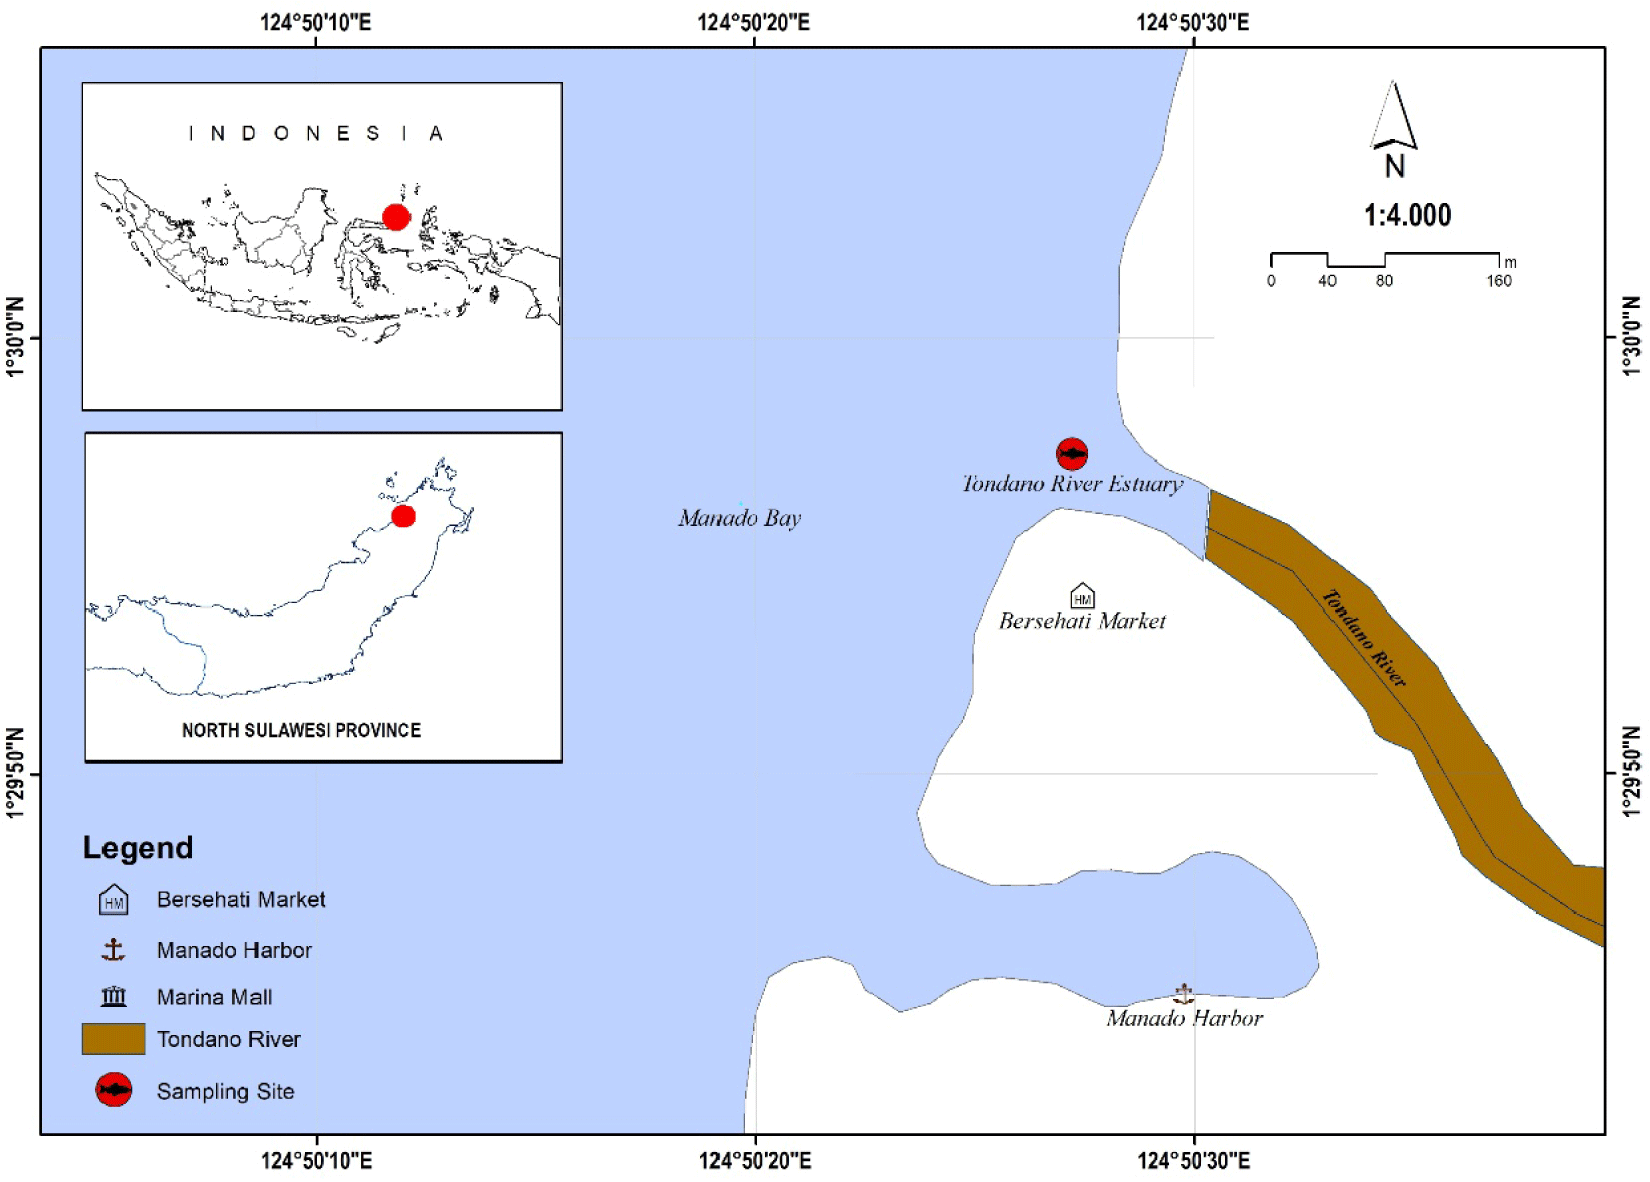
Fish samples have been collected from the Tondano River Estuary in Manado Bay, North Sulawesi Province, Indonesia. They were preserved in a 95% ethanol solution, which is particularly effective at preserving DNA stability and morphological properties (Marquina et al., 2021). Notably, high-concentration ethanol reduces DNA degradation, allowing for direct PCR amplification without requiring elaborate extraction processes (Shokralla et al., 2010). This preservation strategy is critical for providing reliable results in ecological and evolutionary biology research (Fig. 1).
The Genomic DNA Mini Kit from Analytical Jena, Germany (GP100, Geneaid Biotech, New Taipei, Taiwan) was used to extract DNA from fish samples, following the manufacturer’s manual with minor adjustments. Samples were cut into 3 mm pieces and incubated in 400 µl of GP1 buffer at 60°C for 2 h. After incubation, 100 µl of GP2 buffer was added, and the tube was inverted five times before being frozen for three minutes. The supernatant was collected after centrifugation at 10,000 rpm and mixed with 750 µl of GP3 buffer before inverting the tube again. Next, 600 µl of the sample was placed into a GD column attached to a collection tube and centrifuged for one minute; the filtrate was discarded, and the additional sample was processed similarly. After discarding the filtrate, 400 µl of W1 buffer was added and centrifuged, followed by the addition of 600 µl of wash buffer with the same centrifugation step. The GD Column was then transferred to a new Eppendorf tube and air-dried for 2 min. Finally, 100 µl of elution buffer was added, incubated for 1 min, and centrifuged again, and the GD Column was discarded, leaving the purified DNA in the Eppendorf tube for storage at freezing temperatures.
The polymerase chain reaction (PCR) process was carried out using MyTaqTM HS Red Mix (Bioline, Newtown, OH, USA), There is one pair of primers used in this procedure, FF2d with the sequence 5-TTC TCC ACC AAC CAC AAR GAY ATY GG-3’ as the forward primer and FR1d with the sequence 5-CAC CTC AGG GTG TCC GAA RAA YCA RAA-3’ as the reverse primer (Ivanova et al., 2007). This PCR reaction used a master mix with the following composition: 20 µl MyTaq™ HS Red Mix (Bioline) 2x, 1.5 µl forward primer (10 µM), 1.5 µl reverse primer (10 µM), 15 µl Milli-Q water, and 2 µl DNA template (sample), making the total reaction volume 40 µl. The temperature settings on the PCR machine are performed with the following steps: the initial denaturation stage is carried out at 95°C for 3 min, followed by denaturation cycles at the same temperature for 20 s, repeated 35 times. After that, primer annealing is performed at 50°C for 30 s, DNA extension at 72°C for 40 s, and finally, a final extension at 72°C for 1 min.
Visualization of the PCR product DNA was accomplished using a UV-Transilluminator. The successful PCR amplification was confirmed by the presence of a single DNA band, which aligns with standard practices in molecular genetics (Hebert et al., 2003; Ivanova et al., 2007). Bi-directional sequencing was performed by First Base (Selangor, Malaysia) using Big Dye© terminator chemistry (Perkin Elmer, Shelton, CT, USA), a method widely applied in DNA barcoding to ensure reliable results (Dahruddin et al., 2017; Zhang, 2011).
The chromatogram was edited using MEGA 11 software (Tamura et al., 2021). This editing process involved trimming the DNA sequences at both ends, specifically the forward (F) and reverse (R) primers, to isolate the core region. This step was crucial to ensure accuracy in data processing, facilitate sequence alignment, and minimize the risk of errors when constructing phylogenetic trees. We confirmed species identity using BLAST (https://www.ncbi.nlm.nih.gov/).
Sequence analysis included 36 ingroup sequences representing the goby (Family Gobiidae), with 547 nucleotide bases aligned. This method was chosen based on three main aspects: Identifying the tree with the best variation count in the sequence set, examining all possible tree configurations, and suitable for a smaller number of sequences. An outgroup sequence, Chaetodon ephippium (accession number: NC086643.1), was added due to significant interspecies differences.
The Kimura 2-Parameter (K2P) model analyzes genetic distances between DNA sequences, allowing us to distinguish between two types of nucleotide alterations. The K2P model, which distinguishes between transitions and transversions, provides a more precise estimate of genetic divergence among species. The Neighbor-Joining approach is used to understand evolutionary history (Saitou & Nei, 1987). The percentage of replicate trees with grouped related taxa in the bootstrap analysis (1,000 repetitions) is shown beneath the branches (Felsenstein, 1985). The tree’s branch lengths correspond to the evolutionary distances used to construct it, and it is drawn to scale (Tamura et al., 2021). The percentage identity of distinct Goby species was established using sequencing analysis, and Tree Cluster software was utilized to improve the internal coherence of the phylogenetic tree-based groupings (Balaban et al., 2019).
Quantum GIS version 3.34.10-Prizren (http://qgis.osgeo.org) was used to map and show goby’s spatial distribution. The current research focused on BLAST sequences with genetic characteristics most similar to those reported in the Tondano River Estuary, Manado Bay, Indonesia (Altschul et al., 1990). Our findings shed light on the biogeographical boundaries and environmental factors that influence goby distribution (Avise, 2000).
Results
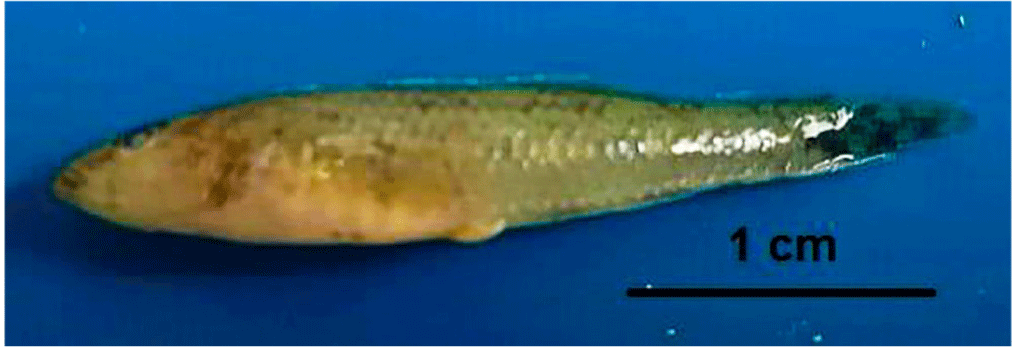
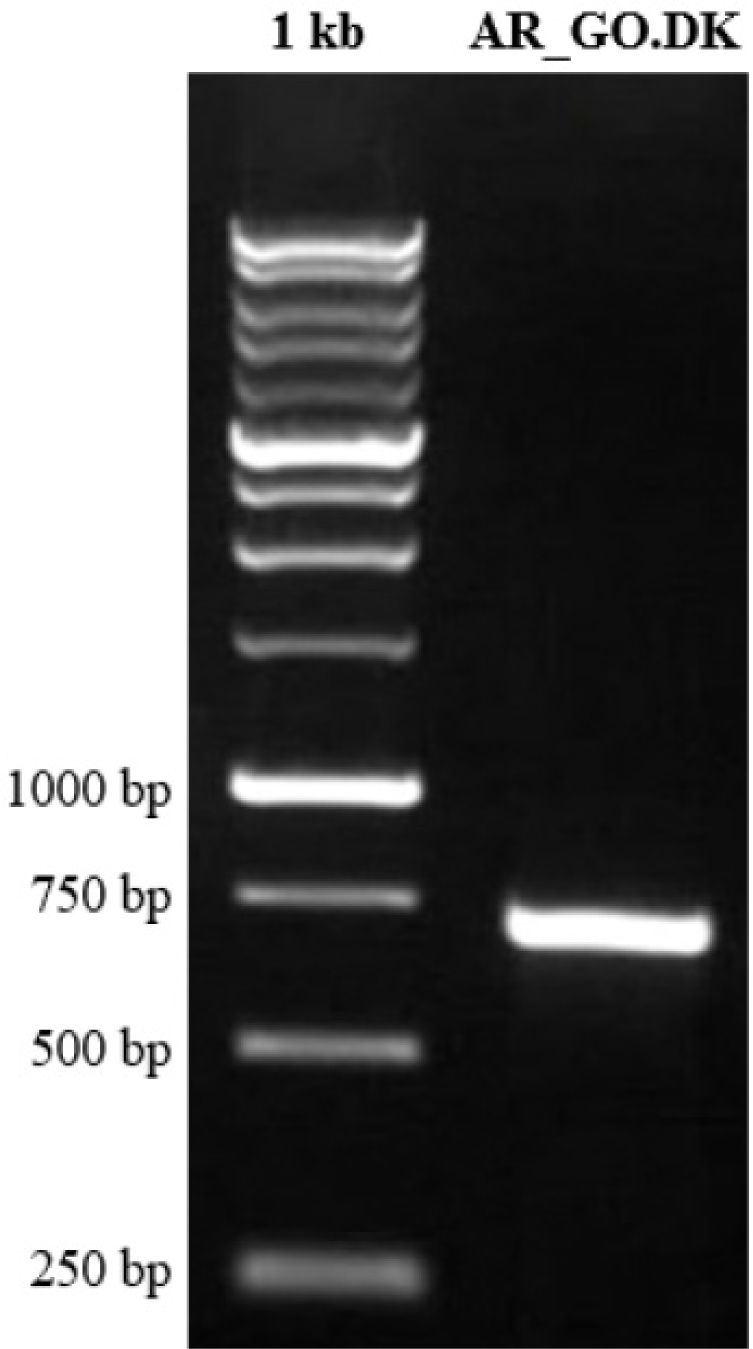
The COI gene from the Tank Goby in Tondano River Estuary, Manado Bay, Indonesia (see Fig. 2), was amplified using DNA barcoding techniques (Fig. 2). The resulting forward (FR) and reverse (RV) DNA lengths were 683 and 680 base pairs (bp), respectively. The sequences were of high quality (HQ), ranging from 93.6% to 94.9%, with an average of 94.25% amplified using DNA barcoding techniques (Fig. 3). After editing, the DNA length was 616 bp with 99.5% HQ. These results indicate that the acquired sequences are of excellent quality and suitable for further analysis.
The BLAST analysis of sequence MST0922.M40 revealed important information about its genetic identity and phylogenetic relationships within the genus Glossogobius. The high identity percentage and low E-value show that MST0922.M40 is most closely related to Glossogobius coatesi from Papua New Guinea, with a similarity of 92.52% and an E-value of 0.00. This indicates a strong and significant genetic match, confirming the accuracy of this identification. The sequence’s similarity to other species in the Glossogobius genus, including Garra robertsi and G. giuris, showed the genus close genetic relationship. Identity percentages range from 85.04% to 88.67%, indicating that MST0922.M40 most likely belongs to a species closely related to G. coatesi, with probable genetic overlap with other members of the genus (Table 1).
Table 2 shows the average genetic distance matrix of the COI sequences, based on distance estimation analysis using the p-distance model and Bootstrap processing (1000X). From the 37 sequences analyzed, G. coatesi sequences (ingroup) have a genetic distance of 0.044 (4.357%) with G. coatesi at the Tondano River Estuary. The genetic distance across all sequences is 0.147 ± 0.064 (14.729%), with the ingroup population (all Gobiidae) having an average p-distance (d) of 0.141 ± 0.060 (14.141%), while the genetic distance for the outgroup is 0.247 ± 0.014 (24.725%).
| Sequences | p-distance (d) | % | SD |
|---|---|---|---|
| Total | 0.170 | 17, 000 | 0.077 |
| Ingroup (Glossogobius coutesi) | 0.047 | 4,680 | 0.091 |
| Ingroup (Goby) | 0.162 | 16,238 | 0.072 |
| Outgroup (Chaethodon ephiphium) | 0.297 | 29,664 | 0.020 |
The overall average genetic distance of 0.170 indicates a 17.0% difference in DNA sequences between all populations studied. This suggests a large genetic difference across species, implying that they evolved independently for a long time (Nei & Kumar, 2000). Ingroup, the genetic distance within G. coatesi is 4.680%, indicating low genetic variability. This is consistent with populations of the same species, where genetic alterations are usually minor, reflecting local adaptations rather than huge evolutionary gaps (Tamura et al., 2004, 2021). The goby group has a higher genetic distance (16.238%), implying greater genetic defference. This could imply that goby contains multiple species or subspecies, resulting in greater variation in their DNA sequences (Nei & Kumar, 2000).
To measure the genetic divergence within or between populations or species, Nei (1972) developed the idea of genetic distance. To classify populations according to the extent of their genetic variation, this metric is frequently employed. Researchers can categorize populations into groups with low, moderate, or high genetic divergence by using Nei’s approach, which calculates genetic distance (d) based on variations in allele frequencies among populations. More evolutionary isolation is indicated by a higher genetic distance, whereas closer relationships between populations are indicated by a smaller genetic distance. These criteria classify the genetic difference between the goby ingroup and outgroup populations as moderate, and the G. coatesi ingroup population as low. According to these findings, interspecies genetic variation has already occurred in the moderate group, while intraspecies genetic variation is still present in the low category (Table 3).
| Analysis parameter | Category | ||
|---|---|---|---|
| Low | Moderate | High | |
| Genetic distance (d) | 0.010–0.099 | 0.1–0.99 | 1.00–2.00 |
Data from Nei (1972).
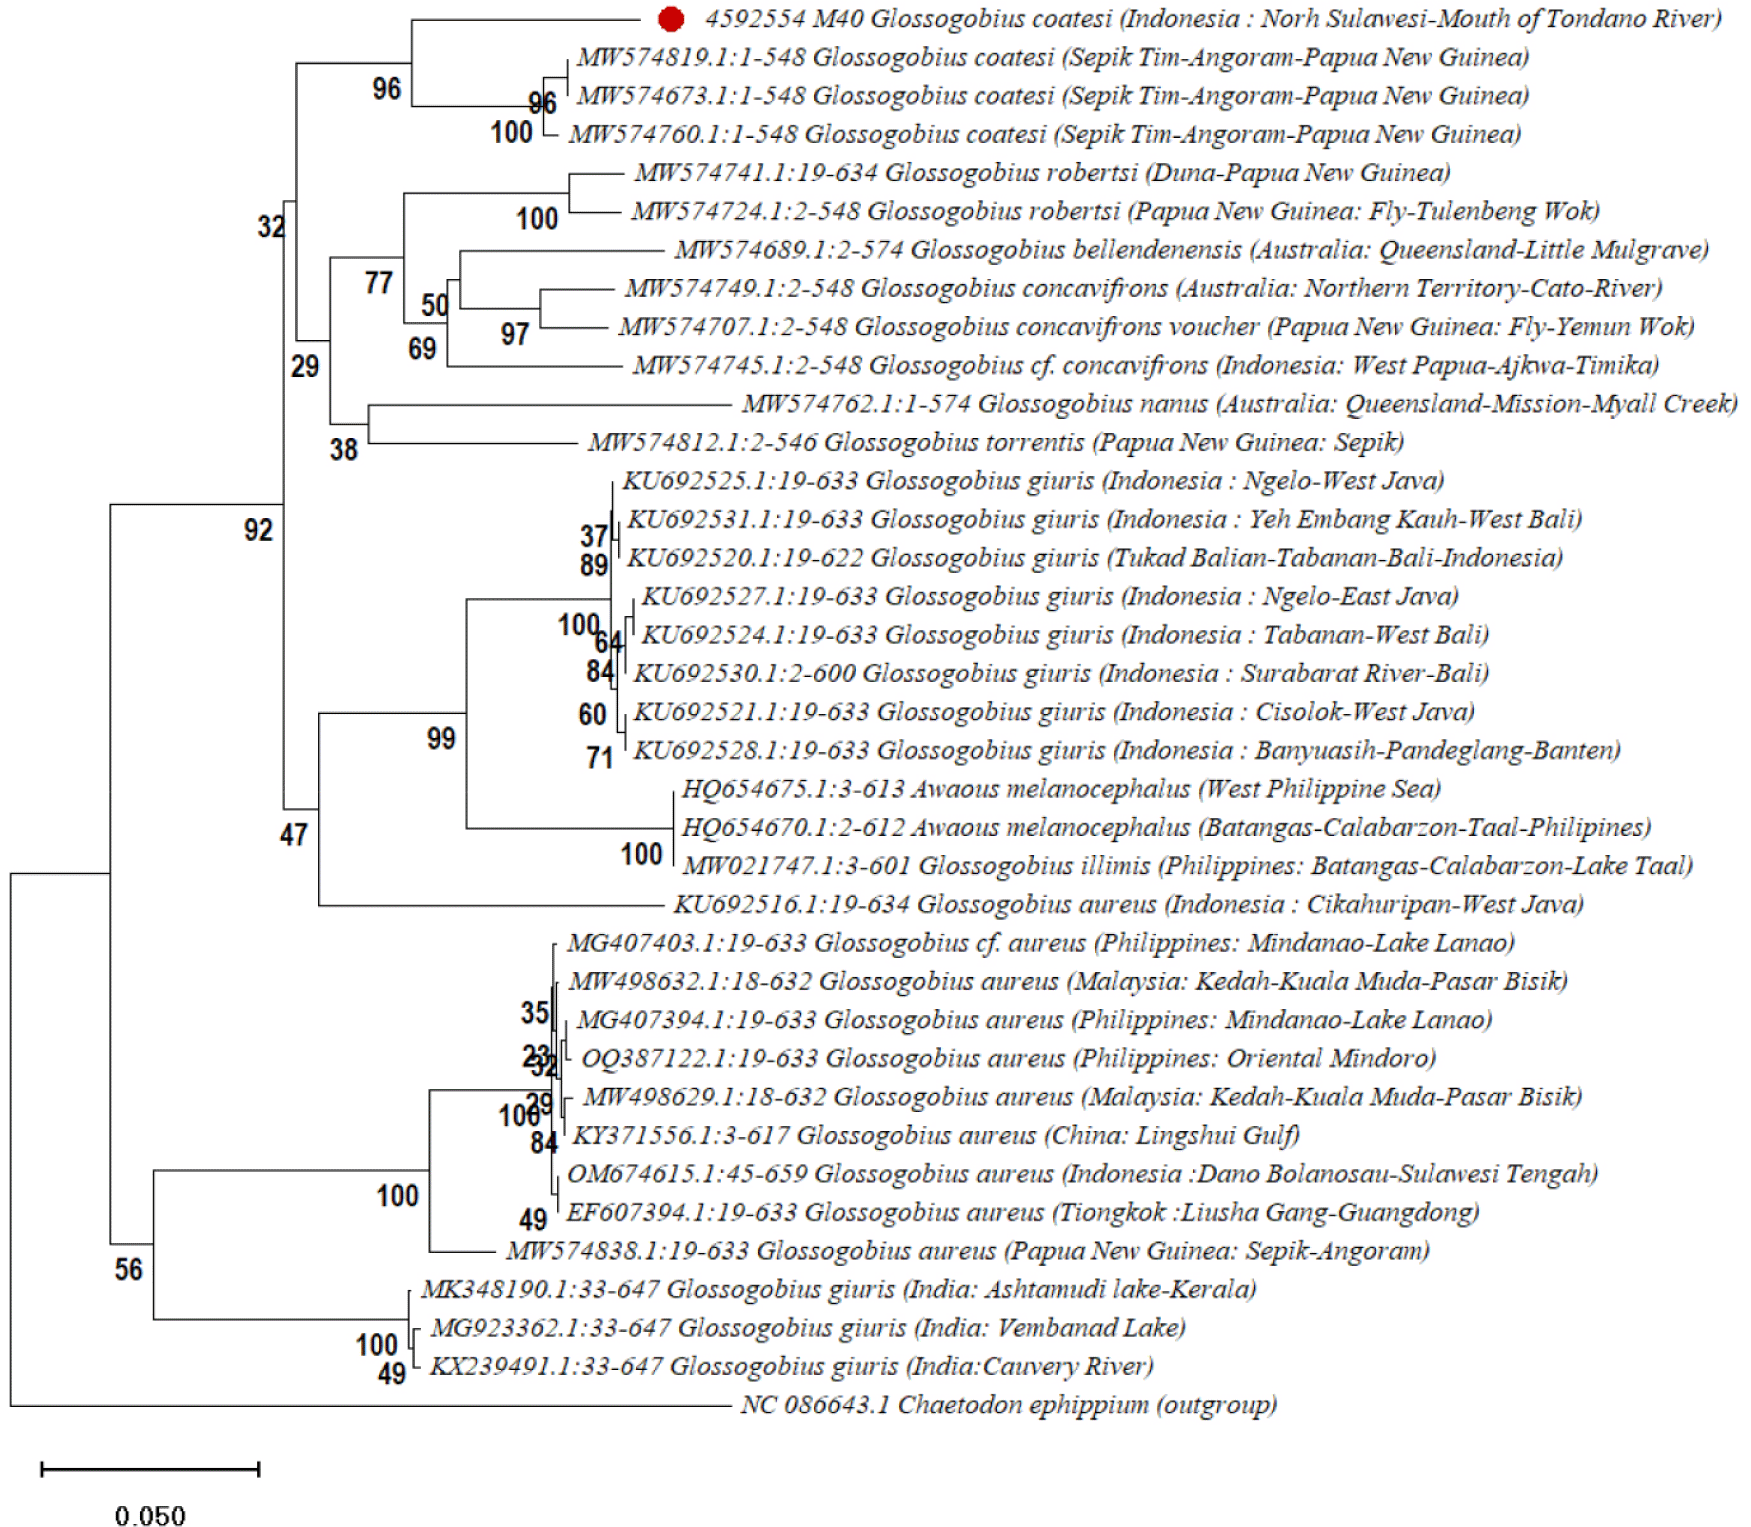
The phylogenetic analysis shown in Fig. 4 reveals several strong clades that indicate the evolutionary relationships among species within the Glossogobius sp. (Felsenstein, 1985; Kimura, 1980; Saitou & Nei, 1987; Tamura et al., 2021). C. ephippium was used as the outgroup to help root the tree, aiding in identifying the direction of evolutionary changes (Nelson, 2006). The sequences of G. giuris from regions in Indonesia, such as East Java, West Bali, and Banten, formed a solid clade with bootstrap values over 90% (Dahruddin et al., 2017). This suggests a close evolutionary relationship among these populations, likely influenced by Indonesia’s geological history.
Another important clade includes G. coatesi, Gerbillus nanus , and Garra robertsi from Papua New Guinea and Australia, showing strong evolutionary links (Coates, 1993; Hammer et al., 2021; Hoese & Allen, 2009). The high bootstrap values indicate they may share a recent common ancestor, possibly due to historical land connections or gene flow via ocean currents. Garra robertsi and G. concavifrons from Papua New Guinea and Indonesia also form a well-supported clade (Hammer et al., 2021), highlighting their shared history, which may involve ancient land bridges or ocean dispersal routes (Briggs, 1995).
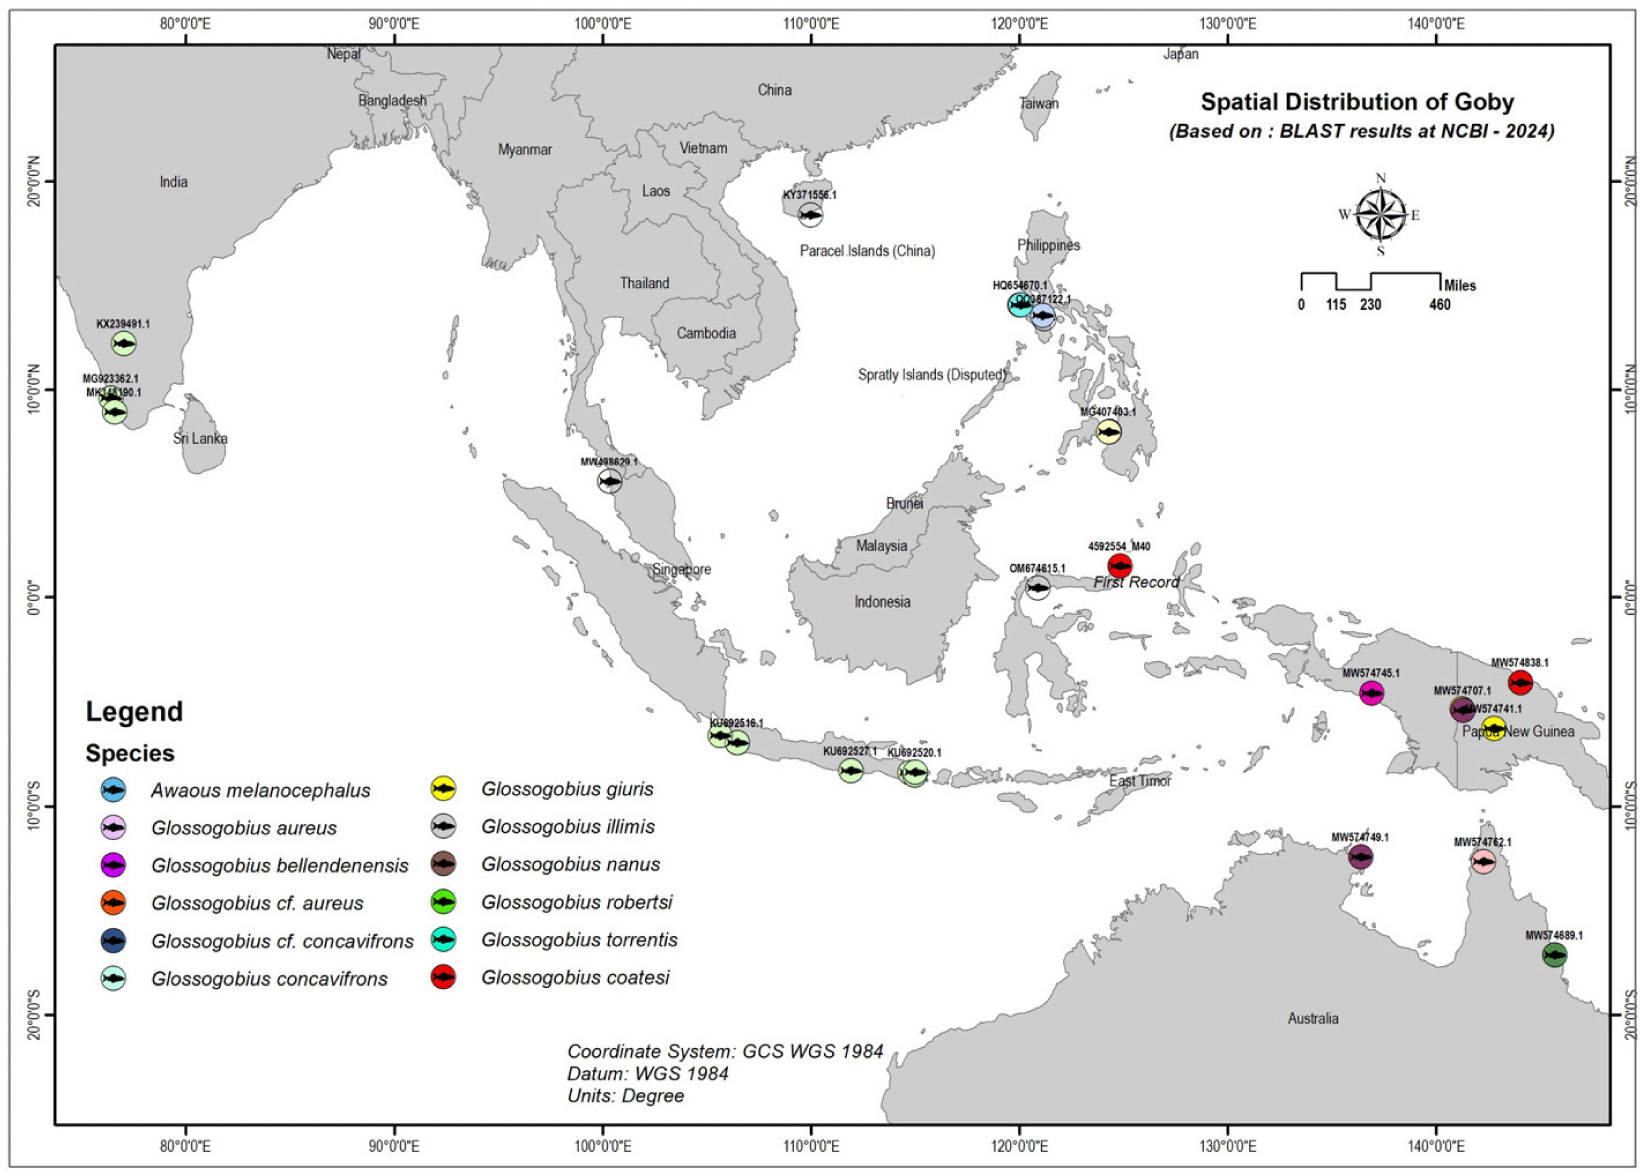
Fig. 5 shows the distribution of gobies across several regions, including Southeast Asia, Oceania, South Asia, and East Asia. Southeast Asia is a key region for many goby species, found in countries like Indonesia, Malaysia, the Philippines, and Papua New Guinea. These areas provide diverse habitats, including rivers, lakes, and coastal waters.
In Malaysia, G.aureus is mainly found in Kedah (Abidin et al., 2021), and its presence in markets like Pasar Bisik suggests it inhabits nearby freshwater and possibly estuarine systems. The Philippines also supports various goby species. For instance, G. cf. aureus and G. illimis can be found in lakes such as Lake Lanao and Lake Taal, showing their adaptability to different water types (Abdulmalik-Labe & Quilang, 2019; Abdulmalik-Labe et al., 2022; Aquilino et al., 2011).
In South Asia, G. giuris is common in major freshwater systems, particularly in India, where it is found in significant rivers and lakes, including the Cauvery River and Vembanad Lake in Kerala (Das et al., 2017; Ghosh et al., 2021). Lastly, in East Asia, particularly southern China, goby species such as G. aureus are present. Their range extends from tropical Southeast Asia to the temperate regions of southern China, indicating their adaptability to varying water temperatures and salinity (Zhang, 2011). Finally, the sequence MST0922.M40 from the Tondano River Estuary is grouped with G coatesi, indicating a close relationship with populations in Papua New Guinea, suggesting potential historical or biogeographic links between these regions (Hoese & Allen, 2009; Hoese et al., 2017).
In Papua New Guinea, gobies like G. coatesi and Garra robertsi are abundant in river systems, especially the Sepik River (Coates, 1993). In Oceania, gobies are widely distributed in Papua New Guinea and Australia, living in tropical and subtropical rivers, lakes, and streams (Springer, 1982). Papua New Guinea boasts a rich diversity of freshwater bodies, with G. coatesi thriving in areas like Angoram and Fly-Yemun Wok (Coates, 1993). In Australia, species such as G. bellendenensis and Gerbillus nanus are mostly found in the northern and eastern regions (Hoese & Allen, 2009).
Discussion
This research makes a substantial contribution to our understanding of aquatic biodiversity, especially when considering the richness of fish species found in Indonesian estuary environments. This study expands the known geographical distribution of G. coatesi and emphasizes the significance of the Tondano River Estuary, Manado Bay, as a crucial environment for fish variety. G. coatesi was the first record of the species in this estuary. For the objective of conserving biodiversity, especially in relation to challenges to estuarine environments, information on the distribution of fish species, like G. coatesi, is essential. Being the meeting place of freshwater and ocean, the Manado Bay region offers a crucial habitat for numerous fish species. Such estuarine habitats frequently provide a variety of fish species with habitat, food, and breeding grounds, including gobies, which are important markers of the health of aquatic ecosystems (Carpenter & Niem, 1998).
The successful identification of G. coatesi as the first specimen recorded in the Tondano River Estuary provides valuable insights into the distribution and evolutionary patterns of the species. Phylogenetic analysis reveals that the MST0922.M40 specimen found in Manado shares genetic similarities with populations from Papua New Guinea (Hoese & Allen, 2009; Hoese et al., 2017), indicating a genetic connection. Historical movements through aged marine or riverine channels suggest a broad genetic distribution pattern throughout the Indo-Pacific region. The dispersal theory posits that species such as G. coatesi may have been able to migrate and establish themselves in various geographic regions during the Pleistocene sea-level fluctuations in Southeast Asia (Voris, 2000).
The populations of the Tondano River Estuary and Papua New Guinea showed modest genetic distances, indicating genetic continuity and supporting the theory of migration between these regions without significant evolutionary divergence. This limited variation may result from local adaptation and environmental stability, allowing the species to maintain genetic traits across diverse aquatic environments (Nei & Kumar, 2000). Low genetic diversity suggests weak reproductive isolation, which facilitates interbreeding among G. coatesi populations in Indonesia and Papua New Guinea (Ferguson, 2002). Genetic studies indicate that these populations are in an early evolutionary stage with little speciation occurring. Consequently, G. coatesi in the Tondano River Estuary shows genetic patterns similar to those in Papua New Guinea, indicating that the two populations are not reproductively isolated.
Additionally, this study shows how bootstrap analysis (Felsenstein, 1985) and phylogenetic approaches (Saitou & Nei, 1987) can help identify evolutionary links between species. This study effectively discovered phylogenetic patterns indicating the possibility of shared ancestry between the populations of G. coatesi from Papua New Guinea and Manado River Estuary. This is important when discussing biodiversity since it enables scientists to comprehend how these species disperse and adjust to various habitats.
The management and conservation of fishery resources depend heavily on biodiversity information, as this study clearly emphasizes. As a recently discovered species in Manado Bay, G. coatesi warrants careful consideration by local government agencies and other relevant parties for developing more comprehensive conservation plans. In the process of identifying susceptible populations and creating scientifically supported conservation strategies to save native and endangered fish species, the genetic data gathered from this investigation may prove to be an invaluable resource.
Studies in the past, including the one carried out, have demonstrated that DNA barcoding can identify exotic and cryptic species that are frequently missed in conventional biodiversity surveys (Dahruddin et al., 2017; Ndobe et al., 2023). For conservation purposes, it is crucial to find cryptic species because many species that go unidentified could be endangered or vulnerable and go unnoticed. Likewise, the data acquired from this research may help identify new species that are unknown in the Manado Bay region, as well as cryptic species.
Conclusion
This study successfully identified G. coatesi for the first time in the Tondano River Estuary, Manado Bay, Indonesia, revealing significant genetic similarities with populations in Papua New Guinea. This finding contributes valuable insights into the distribution patterns of goby species in the Indo-Pacific region and demonstrates that G. coatesi has preserved a high degree of genetic continuity despite geographical distances.
Furthermore, this study highlights the significance of biodiversity data in managing and maintaining aquatic resources. We use phylogenetic analysis and DNA barcoding to give reliable and consistent record of Manado River Estuary species diversity. This discovery is critical for safeguarding the local aquatic ecology, especially in tackling environmental concerns that could harm regional biodiversity. Future studies should emphasize the identification of estuarine fish species in Indonesia using a biomolecular approach, as this will enhance sustainable fisheries management.

