
Introduction
Bass (Micropterus salmodes) and bluegill (Leponmis macrohirus) are freshwater fish belonging to the Perciformes and the Centrarchidae family. They live in slow-flowing streams and lakes, and in dams and reservoirs (Park et al., 2021). In the Korea, bass were first released in Cheongpyeong Dam in the mid-1960s. In 1976, they were released into Paldang Lake and then spread throughout the country (Lee et al., 2009). In 1969, 510-bluegill were imported from Japan and released at Paldang Dam to increase the internal freshwater fisheries stock enhancement. They are now widely distributed in dams, lakes, and rivers throughout the country (Song et al., 2012).
Bass and bluegill are omnivorous fish that feed on small fish, amphibians, shrimp, insects and even dead fish. Due to these feeding habits, bass and bluegill are currently listed as invasive alien species in the Korea (KNPS, 2020; NPRI, 2014). Previous studies have shown relatively low numbers of endemic species in waters dominated by bass and bluegill (Lee et al., 2020; Maezono & Miyashita, 2003). The introduction of invasive species such as bass and bluegill has been documented in research cases, indicating a threat to the extinction of endemic freshwater fish in the area and inland waters fisheries (Katano & Matsuzaki, 2012). Additionally, previous studies have reported a significant decline in native fish species and their abundance following the introduction of bass into Geumgyeji, Samgaji, and Naejangji reservoirs in South Korea five years ago (Park et al., 2021). Furthermore, the proliferation of bass and bluegill throughout rivers and reservoirs in South Korea since 1988 has had a significant impact on the country’s freshwater ecosystems (NPRI, 2014; Park et al., 2021).
Therefore, there is a need for research on the distribution of invasive alien species in the region, such as bass and bluegill to understand the situation and develop remedies and management strategies for the protection of endemic freshwater fish (KNPS, 2020; Park et al., 2021).
In the Korea, one method used to assess the distribution and density of inland aquatic species is the use of fishing gear (three-side fyke net, gill nets). However, certain areas are designated as fisheries resource conservation zones, such as Lake Yedang, and fishing activities are prohibited. Therefore, carrying out surveys using fishing gear is not possible in such areas, and a method involving the use of hydro-acoustics is employed to assess the distribution and density of inland aquatic species. Hydro-acoustics based method involves equipping a vessel with a scientific echosounder, conducting systematic surveys, and collecting acoustic data while navigating through the study area. This method allows for the rapid survey of entire marine areas in a short, period and is widely used in many countries globally (Han et al., 2017; Park et al., 2023; Yang et al., 2014; Yoon et al., 2024).
Therefore, this study aims to present research methods to determine the distribution and density of invasive species (Micropterus salmodes and Leponmis macrohirus) in inland surface waters where no fishing gear can be installed.
Materials and Methods
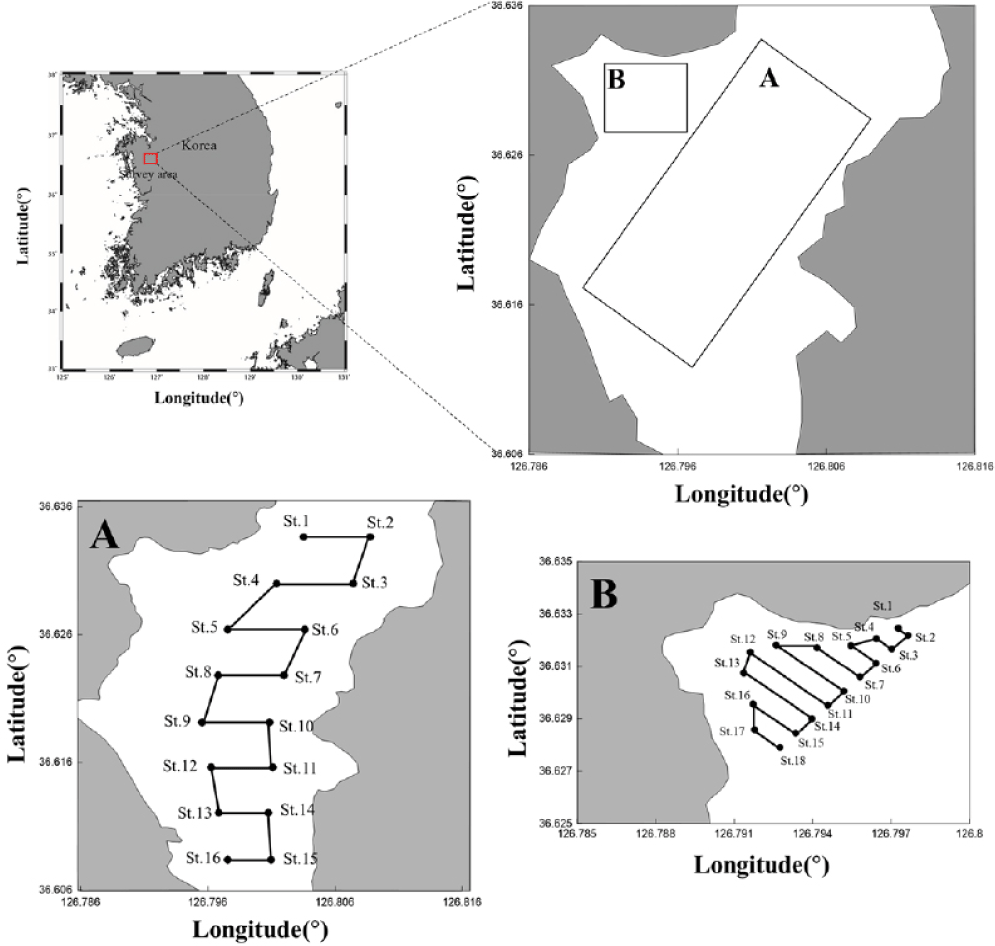
Identify the spatio-temporal distribution of fish in the waters of Yedang Reservoir (depth: ~10 m), located in Yesan-gun, Chungcheongnam-do in South Korea. This study performed a hydroacoustic survey in reservoir (survey perimeter: 1.38 km2, survey line: 6.8 km) using a scientific echosounder (Fig. 1). Survey sites were selected by identifying areas with the highest density of invasive species in Yedang reservoir. Surveys were conducted twice in June and September 2021 at the two waters, daytime surveys at the area A, where gill nets were deployed, and daytime and nighttime surveys at the area B, where no gill nets were deployed. Prior to the survey, survey lines were established based on the survey area, and survey points and transects were selected within the survey area using Aglen’s (1983) formula for degree of coverage (DOC) as expressed in Equation (1).
Here, where N represents the length of the survey transect, and A denotes the area of the survey region, the design ensured that the DOC value was maintained at 6 or above. In this study, the DOC value was 7.8.
The acoustic system used frequencies 38 and 120 kHz from a split-beam scientific echosounder (EK-60, Simrad, Kongsberg , Norway). The acoustic data were recorded on the hard disk along by continuously receiving location information from the differential global positioning systems (DGPS ; SPR-1400, Samyung ENC, Samyoung, Korea) receiver. When collecting acoustic data, the pulse width was set to 1.024 ms and the pulse repetition interval to 1 sec. The transducer was attached to a tow-fish and deployed one meter deep using a support on the side of the survey vessel, with the vessel speed controlled at six to seven knots to collect data. Furthermore, to identify the species composition of fish inhabiting the survey area, three-side fyke nets and gill nets were used to analyze the fish species list and fish information.
In the process of collecting acoustic data using scientific echosounder, various problematic acoustic noises occur (de Robertis & Higginbottom, 2007; Echoview, 2024). The acoustic survey revealed the presence of impulse and transient noises. Impulse noise is caused by acoustic equipment mounted on other ships and is characterized by its irregular appearance in the form of thick, vertical rain (Park et al., 2022). This noise is removed when after excluding each sample value for variation in the horizontal range from the center data sample in the specified area, the resulting value is greater than a threshold value. This is called the two-sided comparison method (Anderson et al., 2005; Table 1).
Transient noise is caused by various electrical equipment in the vessel. This noise comes in the form of a regular drizzle (Ryan et al., 2015). Transient noise is removed when after subtracting the median value of the relevant area from the central data sample in the specified area, the resulting value is greater than the threshold value. This can be seen as representing temporary noise (Table 2).
| Frequency | 38 kHz | 120 kHz |
|---|---|---|
| Horizontal extent (ping) | 20 | 20 |
| Vertical units | Samples | Samples |
| Vertical extent (samples) | 5 | 5 |
| Vertical overlap (%) | 0 | 0 |
| Maximum noise (dB) | –120 | –145 |
| Minimum SNR | 10 | 10 |
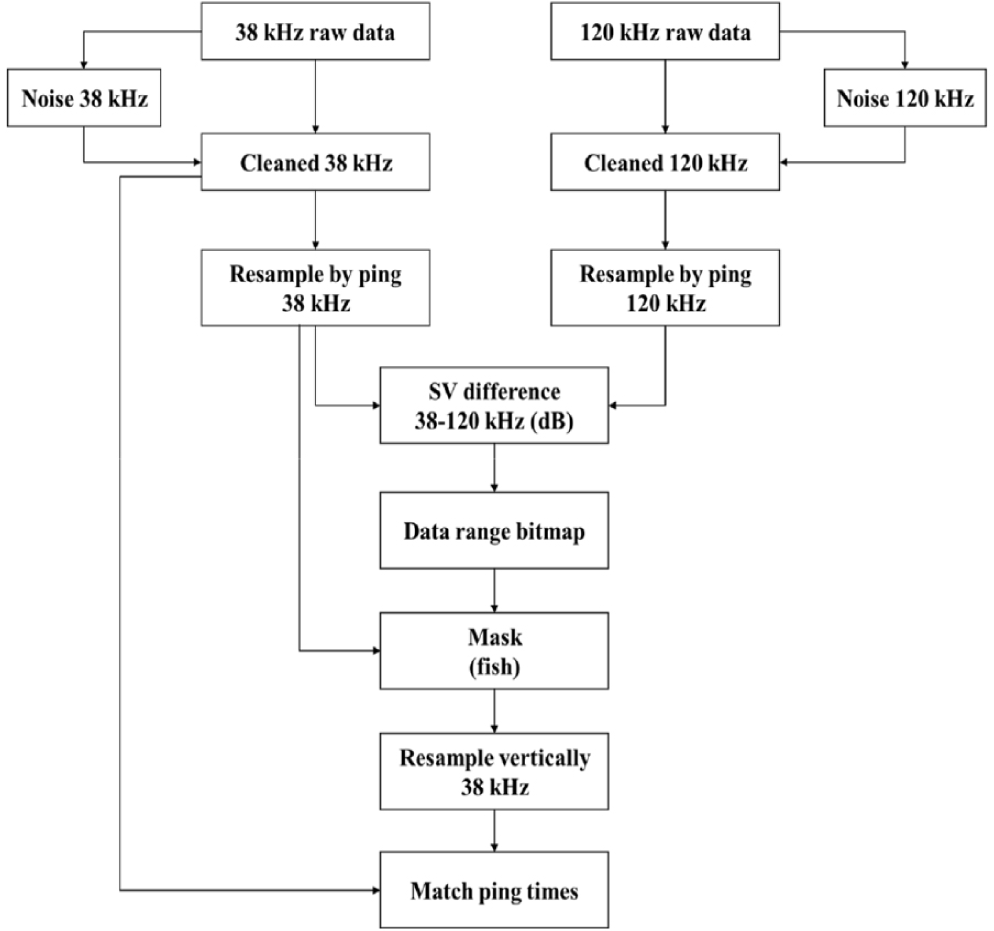
Separate the echo signals of fish from the data collected in the acoustic survey, the frequency characteristics and differences for frequencies 38 and 120 kHz need to be identified. Here, the frequency difference represents the difference in mean volume backscattering strength (MVBS) across multiple frequencies (frequency difference represents the difference in Mean Volume Backscattering achieve a positive value for ∆MVBS, the frequency-specific target strength (TS) of the target species to be separated is compared and the frequency with the larger TS is subtracted from the frequency with the smaller TS. Generally, fish appear higher at 38 kHz than at 120 kHz. Hence, for the new echograms at 38 and 120 kHz, which are matrixed, ∆MVBS can be expressed as the following Equation (4).
Furthermore, the acoustic scattering TS used to identify bluegill and bass was calculated from the TS cm value of the previous study by Yang et al. (2014). The acoustic backscattering strengths for identifying bluegill in the echo signal were −67.4 and −66.3 dB at frequencies 38 kHz and 120 kHz, and those for bass were −65.3 and −66.8 dB, respectively.
The acoustic data analysis filters out other noises such as near the surface layer and the bottom layer, and when the integration interval is set, a matrix by frequency is constructed to create a new echogram (Fig. 2). The size of the cell for examining frequency differences was 5 ping × 5 m (width × height). When the frequency difference of the fish becomes clear, we set a range of values to create a data range bitmap, create a mask with the echo signals set in this range and the echo signals corresponding to the cell size with a frequency of 38 kHz. This is then divided by the ping interval, and the echo signal that matches the de-noised 38 kHz echo signal is regarded as the echo signal of the fish. Once undergoing this method, the echo signals of the fish that fit this characteristic can be isolated to identify each species.
To estimate fish density using acoustics, this survey used volume backscattering strength (SV) data extracted at 0.1 n.mile intervals from well-calibrated scientific echosounders after converting the values to nautical area scattering coefficients (NASC). The relationship of converting the volume backscattering strength to the area scattering coefficient is shown in Equation (5).
Since the NASC value is the linear sum of the signals received from underwater inhabitants in a volume, the density of fish (ρ, g/m2) can be calculated by dividing the mean NASC value in the acquired seawater volume by the backscatter strength value of the target fish, as shown in Equation (6). The TS and backscattering section according to the length (L, cm) of the target fish can be represented as Equation (7) and Equation (8).
Additionally, the length (L, cm) – weight (w, g) relation for fish inhabiting the surveyed waters is given by the following.
Fish density (ρ) can be calculated by dividing the mean area scattering coefficient within a 0.1 n.mile interval in a volume by the backscattering cross section of a single fish (σ) and multiplying by its weight, as shown in Equation (10). The right-hand side of Equation (10), excluding NASC, is the conversion factor for calculating density from acoustic data, which considers the fish’s backscattering cross section and length–weight relation.
The mean fish density of all surveyed waters (ρ̅) is a weighted mean of the mean density data for each transect and is shown in Equation (11).
Here, ρ is the mean density of the ith transect, n is the number of elementary distance sampling units in the ith transect, and N is the number of transects. The mean fish density ρ was obtained using the above formula.
Results
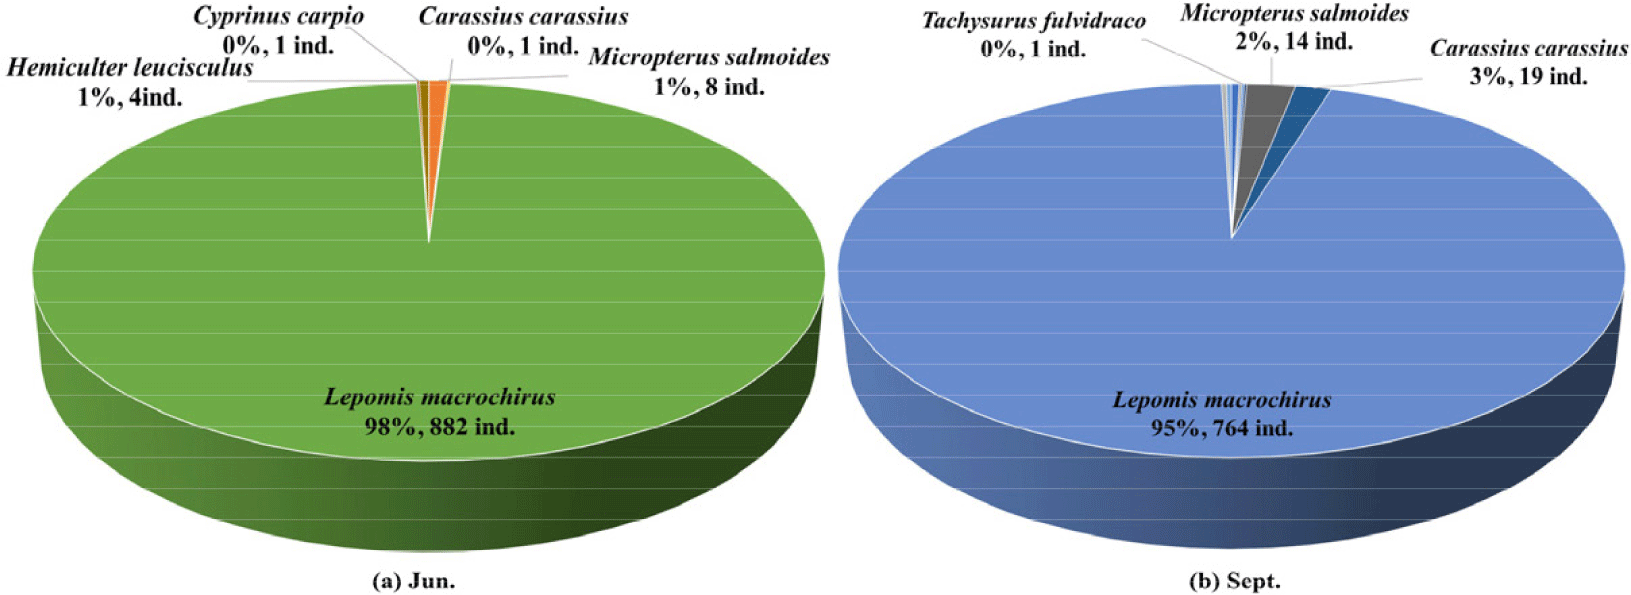
Bluegill, bass, korean sharpbelly, crusian carp, common carp, etc. were the fish species caught in June with fishing gear at Yedang Reservoir, with 882 bluegills being the dominant species. Fish species collected in September included bluegill, bass, yellowhead catfish, Chinese muddy loach, korean sharpbelly, and crusian carp, with 764 bluegills being the dominant species (Fig. 3). Specifically, for bass, an invasive species similar to bluegill, eight individuals were collected in June and nineteen in September.
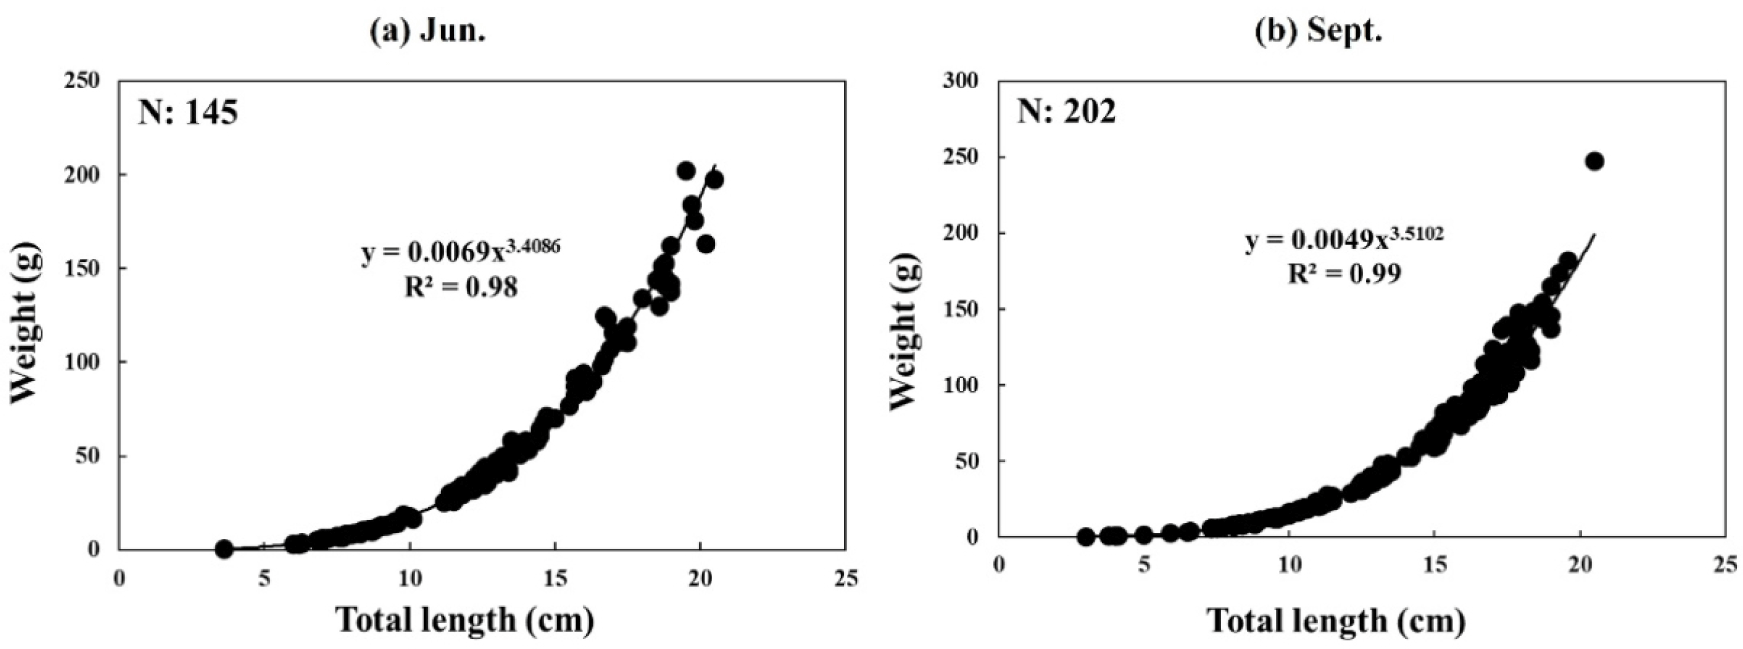
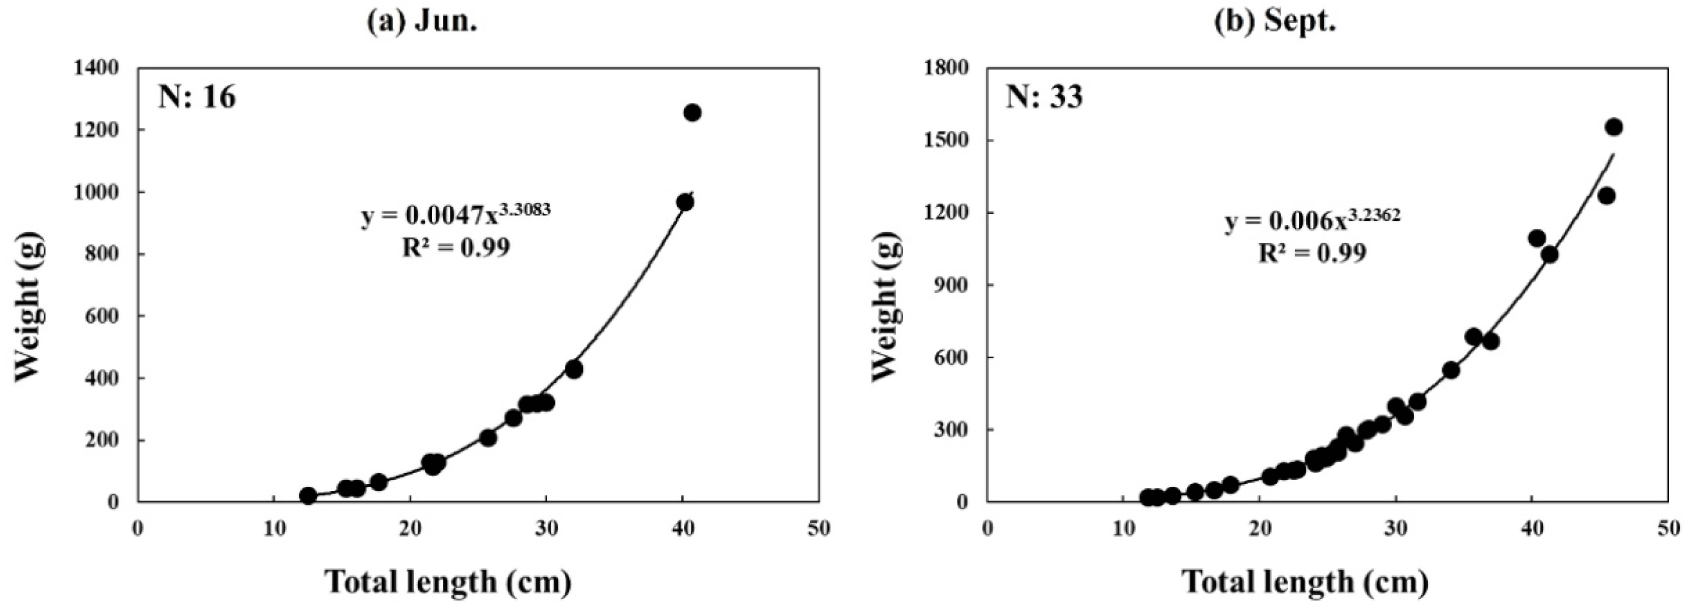
Bluegill collected in June from Yedang Reservoir, had a mean length of 12.7 cm and a mean weight of 53.0 g; its length–weight relation is given as w=0.0069L3.4086 (R2=0.98). The length–weight relation for bluegill collected in September was w=0.0049L3.5102 (R2=0.99), with a mean length of 14.0 cm and a mean weight of 68.0 g. (Fig. 4). The length–weight relation for bass collected in June was w=0.0047L3.3083 (R2=0.99), with a mean length and weight of 26.8 cm and 356.0 g, respectively. The length–weight relation for the bass collected in September was w=0.0006L3.2362 (R2=0.99) (Fig. 5). The mean length of the bass was 25.8 cm and the mean weight 316.6 g.
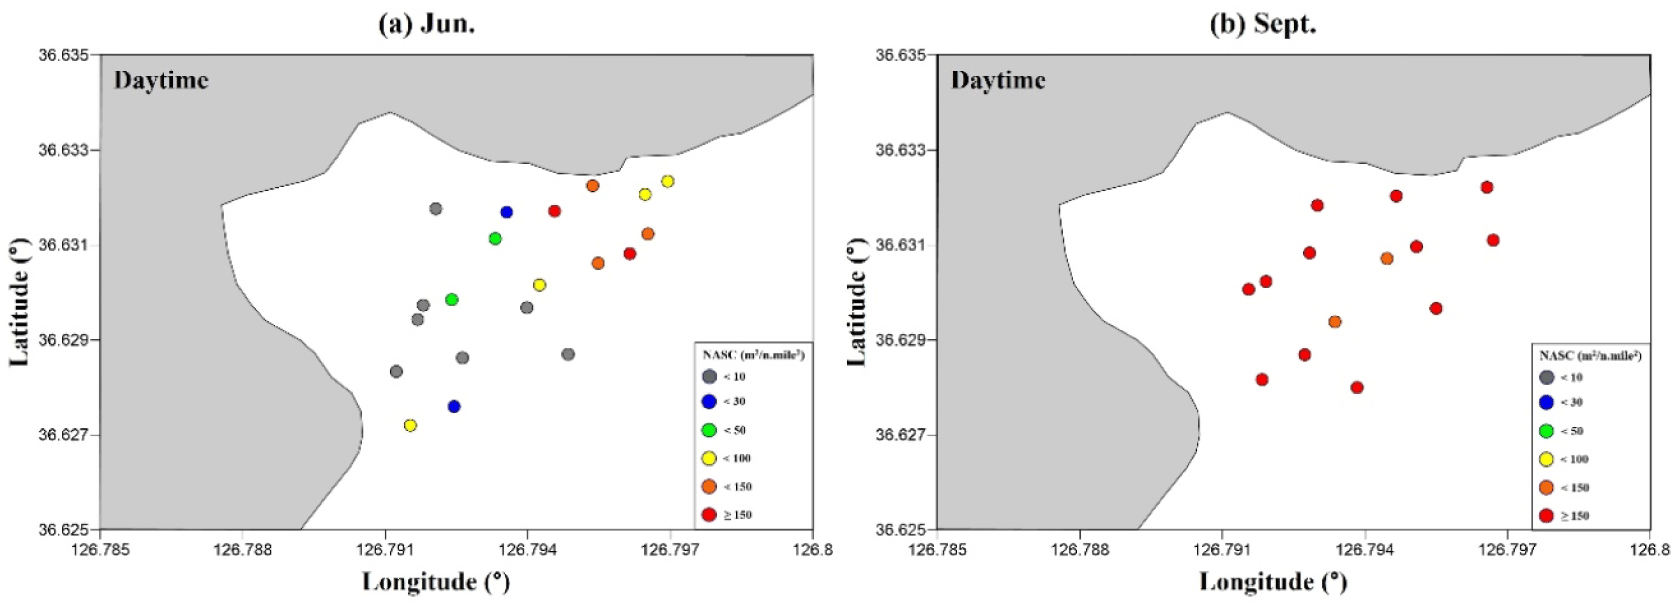
The distribution of fish found in Yedang Reservoir in June and September is shown in the figures below (Figs. 6–8). Acoustic surveys conducted in June at Yedang Reservoir showed that in the survey area (A), the distribution was higher in the eastern waters during the daytime and lower toward the south. The mean NASC value in the daytime survey area (A) was highest at 107.0 (m2/n.mile2) at the Transect line 5 and lowest at 24.9 (m2/n.mile2) at the Transect line 7. In the daytime survey area (B), the distribution was higher in the northern waters, with the highest mean NASC value at 145.7 (m2/n.mile2) at the Transect line 2 and the lowest at 7.9 (m2/n.mile2) at the Transect line 5. The nighttime surveys showed a similar fish distribution to the daytime surveys, with high abundance in all waters. In the nighttime survey area (B), it was highest at 684.2 (m2/n.mile2) at the Transect line 2 and lowest at 11.6 (m2/n.mile2) at the Transect line 6 (Table 3).
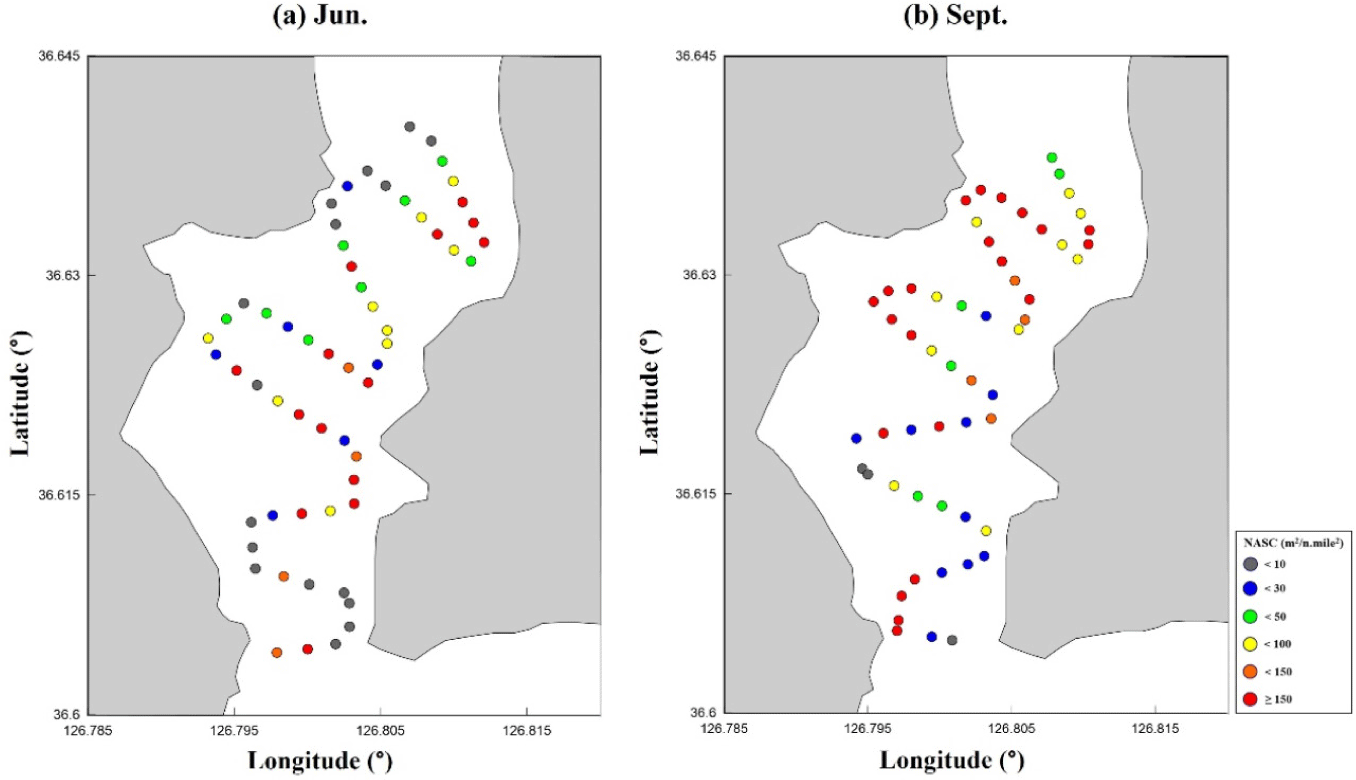
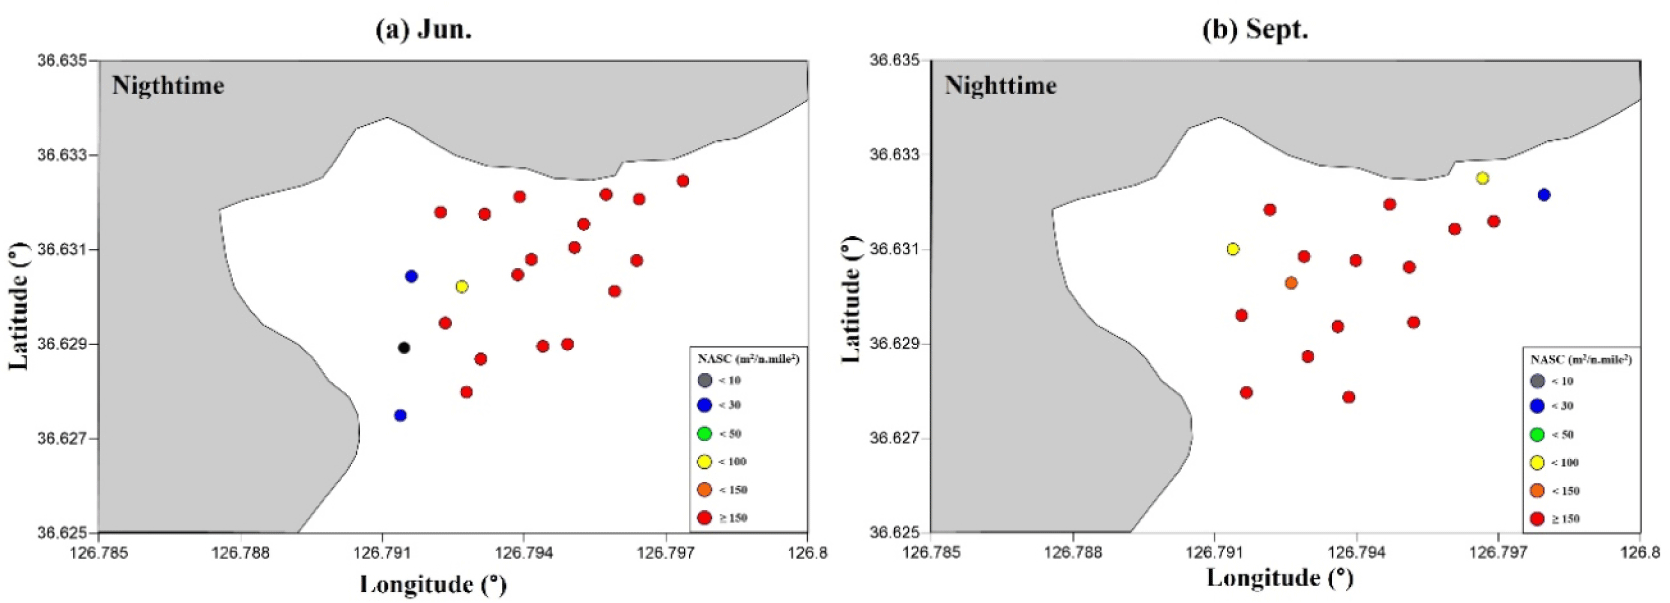
In September, acoustic surveys in the survey area (A) showed a relatively high distribution of fish in the northern waters during the daytime, and an overall high distribution of fish in the western waters. The mean NASC value of fish by transect was highest at 343.6 (m2/n.mile2) on the Transect line 3 and lowest at 34.2 (m2/n.mile2) on the Transect line 7. In the survey area (B), the daytime-nighttime distribution of fish showed a high distribution across all transects, and the mean NASC value of fish by transect was highest at 1,044.8 (m2/n.mile2) at the Transect line 2 and lowest at 210.6 (m2/n.mile2) at the Transect line 3. In the nighttime survey area (B), it was highest at 1,265.7 (m2/n.mile2) at the Transect line 4 and lowest at 35.5 (m2/n.mile2) at the Transect line 6 (Table 4).
The mean densities of dominant species in June using hydroacoustic surveys are shown in Table 5. The mean density of bluegill, the dominant fish species, was estimated to be 70 (10-4 g /m2) and the mean density of bass was estimated to be 2,010 (10-4 g /m2) in site A at daytime. The mean density of bluegill was estimated to be 50 (10-4 g/m2) and the mean density of bass was estimated to be 1,440 (10-4 g/m2) in Site B at daytime. The mean density of bluegill was estimated to be 430 (10-4 g/m2) and bass was estimated to be 12,050 (10-4 g/m2) in site B at nighttime. In September, the mean daytime density of bluegill was estimated to be 100 (10-4 g/m2) and that of bass 2,750 (10-4 g/m2) at site A. The mean densities of dominant species in Site B during the daytime were estimated to be 500 (10-4 g/m2) for bluegill and 280 (10-4 g /m2) for bass, while the mean densities of bluegill in Site B at nighttime were estimated to be 480 (10-4 g/m2) for bluegill and 270 (10-4 g/m2) for bass (Table 6).
| Scientific name | Survey area | Mean density (10−4 g/m2) | ||
|---|---|---|---|---|
| Daytime | Nighttime | |||
| June | Lepomis macrochirus | A | 70 | - |
| Micropterus salmoides | 2,010 | - | ||
| Lepomis macrochirus | B | 50 | 430 | |
| Micropterus salmoides | 1,440 | 12,050 | ||
| Scientific name | Survey area | Mean density (10−4 g/m2) | ||
|---|---|---|---|---|
| Daytime | Daytime | |||
| September | Lepomis macrochirus | A | 100 | - |
| Micropterus salmoides | 2,750 | - | ||
| Lepomis macrochirus | B | 500 | 480 | |
| Micropterus salmoides | 280 | 270 | ||
Discussion
Yedang reservoir is the largest reservoir in South Korea and its extensive upstream catchment area contributes to fish abundance. It also serves as a favorable habitat for freshwater fish, hosting a diverse array of native species from the Cyprinidae, Bagridae, Gobiidae, Cobitidae and Centrachidae families. Moreover, the lake supports several exotic species, including the bluegill, bass, and sunfish (Kim et al., 2019a). In a previous study conducted by Ko et al. (2012), 32 fish species were documented, with stone moroko (Pseudorasbora parva) and rosy bitterling (Rhodeus ocellatus) being identified as the dominant species. In a study by Kim et al. (2019b), 29 fish species were identified, predominantly species belonging to the Cyprinidae family. However, results from the survey revealed that bass and bluegill accounted for approximately 98% of the total catch, with other species such as common carp, Korean sharpbelly and crude carp making up the remaining catches. Discrepancy between the findings of this study and those of previous studies is due to the differences in survey locations. According to a study by Kim et al. (2019), the central area of Yedang reservoir is characterized by a lentic zone, leading to is limited external inflow in the downstream areas, resulting in low species diversity. Therefore, considering that the surveyed area is the central region of Yedang reservoir, unlike the previous study conducted in the downstream areas of Yedang reservoir, it is inferred that there is a lower species diversity in this study area. Furthermore, considering that the survey was conducted in June, which corresponds to the spawning season for bluegill and bass, the relatively high catch of bluegill, particularly after the spawning period, aligns with previous research findings indicating an increased catch post-spawning compared to other fish species (Abookire et al., 2000; Kim et al., 2019).
A previous study by Lee et al. (2014) analysed the abundance of fish using single target detection method and fish track technique. Also, a previous study by Kang (2012) used a time-varying threshold method using one frequency to distinguish between fish and zooplankton. However, these methods have difficulties in identifying fish species with similar physical characteristics. In a previous study by Yang et al. (2014), it is difficult to estimate the distribution density of fish species in the surveyed waters using only a single frequency, and future studies will use two or more frequencies to estimate the distribution density of the target fish species. Therefore, it is recommended to estimate the distribution and density of the target fish species using the dB-difference method using two or more frequencies as in this study. According to the study by Binder et al. (2012), bass feed primarily in shallow water during the day, with more active feeding in the afternoon. According to the study by Woodward & Noble (1997), bass feed at night and concentrate their feeding activity within a certain area. In the study, fish density was higher at night than during the day. Therefore, it is likely that this is the reason for the higher density of bass at night compared to day.
According to the study by Maezono & Miyashita (2003), when comparing ponds with and without invasive species, ponds with invasive species showed a lower abundance of native fish. Moreover, their findings indicated that abundance of bass is lower in agricultural reservoirs where bluegill and bass coexist. In a study by Lee et al. (2020), bass and bluegill, designated as invasive species in South Korea, were found to have a direct impact on the decline of native species in the country. This study indicated a significant reduction in the abundance of native species residing in locations where invasive species were present. Previous studies have, that introduction of invasive species poses a threat to native species in their respective regions, placing them at risk of extinction, and endangering inland fisheries and ecosystems (Katano & Matsuzaki, 2012; Maezono & Miyashita, 2003). In Yedang reservoir, bass and bluegill showed an increasing trend, while native species such as trout and crucian carp exhibit a decreasing trend. Therefore, continuous monitoring is necessary to manage and conserve native species. Moreover, research addressing potential solutions to mitigate the decline in native fish populations caused by invasive species is essential.
Conclusion
In this study, acoustic surveys were conducted in June and September to determine the distribution and density of invasive fishes Yedang Reservoir. Acoustic surveys were conducted in the survey areas (A) and (B) where fishing gear was deployed using scientific echosounders. The collected data from three-side fyke nets and gill nets were used to identify the distribution and density of fish. According to the June survey results, the dominant fish species in Yedang reservoir was bluegill. In Area A, the average density of bluegill and bass was 70 (10-4 g/m²) and 2,010 (10-4 g/m²), respectively. In Area B, during the week, the average densities of the bluegill and bass were 50 (10-4 g/m²) and 1,440 (10-4 g/m²) respectively. At nighttime, the average density of bluegill and bass was 430 (10-4 g/m²) and, 12,050 (10-4 g/m²), respectively. The result of the September survey indicated that bluegill was the predominant fish species in Yedang reservoir. In Area A in September, the average densities of bluegills and bass were 150 (10-4 g/m²) and 2,750 (10-4 g/m²) respectively. In Area B, both during the day and night in September, the average density of the bluegills was 500 (10-4 g/m²) during the day and 480 (10-4 g/m²) at night. The average density of bass was 280 (10-4 g/m²) during the day and 270 (10-4 g/m²) at night. Thus, this study proposes a new method for assessing the distribution and density of fish in freshwater areas where traditional fishing gear installation is not feasible. The findings of this study are expected to provided foundational data for future studies aimed at understanding the distribution of freshwater species.