Introduction
Seawater pH is a critical environmental stressor for marine species resulting in both direct and indirect adverse effects (Wessel et al., 2018). It significantly affects early developmental stages, critical physiological functions, and skeletal growth (Wessel et al., 2018). The current average pH of the open ocean is 8.1, a decrease of 0.1 units from 8.2 since the Industrial Revolution (Liu et al., 2012). This decline in seawater pH is attributable to an increase in CO2 absorption by the oceans (Caldeira & Wickett, 2003), with pH predicted to drop further by an additional 0.3–0.4 units in accordance with the IS92a scenario by 2100 (Orr et al., 2005) and by 0.77 units by 2300 (Caldeira & Wickett, 2003). Atmospheric CO2 concentrations are expected to reach 788 parts per million by volume (PPMV) by 2100 (Orr et al., 2005) and 1,900 PPMV by 2300 (Caldeira & Wickett, 2003). In coastal areas, human activities and seasonal variation can cause short-term or temporal fluctuations in pH levels that frequently exceed pH trends observed across decades (Ono et al., 2024). For example, industries producing titanium dioxide via sulfuric acid can produce waste water with a pH of 1–2 (Li et al., 2023). Several industries and domestic activities use NaOH, which can enter the water and increase the pH level (Ghazy et al., 2011). In extreme cases, coastal pH levels might exceed 9 or fall below 7 (Hinga, 2002).
Most aquatic organisms can survive within a pH range of 6.0 and 9.0, while macroinvertebrates can tolerate pH levels between 6.5–8.5. However, some marine organisms can survive in water outside this pH range. Sensitivity to pH changes varies significantly among marine ecosystems (Ghazy et al., 2011), life stages, and species (van Colen et al., 2012). Several studies have shown that mollusks are susceptible to pH-related stress, especially in their early life stages. Wessel et al. (2018) reported that a low pH of 7.6–7.7 caused European abalone (Haliotis tuberculata) larvae to be smaller than the controls. The number of malformed or unshelled larvae was also increased at low pHs. The hatching rate and normal larval growth of donkey’s ear abalone (Haliotis asinina) were significantly reduced at pH 7.4 and 7.6, compared to the controls (Tahil & Dy, 2016).
Abalone, widely distributed across tropical and temperate coastal areas, is an economically important molluscan species. The global value of abalone exports increased from USD 36.79 million in 1976 to USD 644.16 million in 2020 (FAO, 2022). In Korea, the production of farmed abalone increased significantly from 20 tons in 2000 to 22,078 tons in 2022 (KOSIS, 2022). Pacific abalone (Haliotis discus hannai) accounts for the highest production volume in South Korea (KOSIS, 2022). The effect of decreasing pH due to elevated pCO2 on Pacific abalone larvae was studied by Kimura et al. (2011) and Li et al. (2013), with reductions in pH ranging between 7.41–8.02 and 7.30–8.20, respectively. However, research examining the effects of decreasing or increasing pHs across a broader range remains limited. Research on the impact of extreme pH conditions will provide fundamental data that is crucial to understand the sensitivity of abalone larvae to environmental pH fluctuations.
Hatching rate, larval length, malformation rate, oxygen consumption rate, and settlement rate are commonly studied parameters used to evaluate the effects of pH on larval abalone. In addition to these parameters, DNA damage has been analyzed using comet assays to investigate the effects of environmental stress on several aquatic organisms, including Mediterranean mussel (Mytilus galloprovincialis) (Braga et al., 2020), backwater hard clam (Meretrix casta) (Praveen Kumar et al., 2014), and yellow clam (Paphia malabarica) (Praveen Kumar et al., 2014). However, the use of comet assays to analyze the effects of pH on abalone larvae remains unexplored. Acidification has been observed to disrupt calcification and shell formation in mollusks (Wessel et al., 2018). Therefore, it is critical to investigate the expression of genes involved in calcification, such as calmodulin and carbonic anhydrase (Sharker et al., 2021). Calmodulin, an intracellular calcium-signaling mediator, is crucial for controlling calcium absorption and transport during biomineralization and can also serve as a stress indicator (Liu et al., 2012). Carbonic anhydrase catalyzes the change of CO2 to bicarbonate ions and protons (Sharker et al., 2021). In addition, the expression of heat shock proteins (HSPs) has been widely analyzed to determine an organism’s stress response. HSP expression is induced by heat stress and various environmental stimuli (Lee, 2023), including pH (Qian et al., 2012).
This study aimed to investigate the effects of extreme seawater pH on the early larval stages of Pacific abalone. The parameters analyzed included the hatching rate, larval length, malformation rate, DNA damage, oxygen consumption rate, settlement rate, expression levels of biomineralization genes (calmodulin and carbonic anhydrase), and stress-related genes (HSP90). Larvae were examined at 20 and 30 hours post fertilization (hpf), corresponding to the free-swimming trochophore and veliger stages, respectively. Additionally, the settlement rate was assessed at 96 hpf, during the prematamorphic stage.
Materials and Methods
Fertilized Pacific abalone eggs were collected from a commercial abalone hatchery (Haenam, Jeollanam Province, Korea). The eggs were placed in plastic bags under oxygen pressure and returned to the Laboratory of Marine and Fisheries Resources at Mokpo National University. The fertilized eggs were maintained at 18°C and 32 practical salinity units (PSU) without aeration, replicating the hatchery seawater conditions. Embryonic development was monitored utilizing a stereomicroscope (Leica MZ10F, Leica Microsystems, Heerbrugg, Germany) at a 6.3 × 100 µm magnification. The experiment used embryos at four hpf during which most embryos had reached the morula stage.
To investigate the effects of extreme pH on early larval development, embryos at the morula stage were divided into five pH conditions (6, 7, 8, 9, and 10), using three replicate tanks for each pH treatment. We selected pH levels 6–9 based on the pH tolerance of most aquatic organisms, while pH 10 was chosen to assess sensitivity beyond tolerance limits. Local seawater pH typically ranges between 7.96–8.15. For the experimental design with 1-unit pH differences, pH 8 was chosen as the control. Embryos were incubated in 1 L of filtered seawater at 21°C and 32 PSU until 30 hpf. Since abalone larvae are lecithotrophic, deriving food from egg yolks, no feed was provided during the experiment. Seawater pH was measured using a YSI water quality analyzer (YSI Professional Plus; YSI, Yellow Springs, OH, USA), calibrated using three-point calibration buffers with pHs 4, 7, and 10. This water analyzer measured the pH using the NBS scale. The pH was modified using 1 M hydrochloric acid (HCl) and 1 M NaOH solution.
The hatching rate was monitored using a stereomicroscope (Leica MZ10F, Leica Microsystems) by randomly sampling three 1 mL replicates per tank (n = 9 per pH treatment). The hatching rate was measured by calculating the number of hatched larvae compared to the number of fertilized eggs and multiplied by 100. Larvae at 20 and 30 hpf were sampled and fixed in 70% ethanol to measure the larval length and malformation rate. The malformation rate was measured by subsampling three 1 mL replicates per tank (n = 9 per pH treatment) using a stereomicroscope (Leica MZ10F, Leica Microsystems). The assessment of the malformation rate of 20 hpf larvae was based on abnormalities in the prototrochal ciliary band, apical tuft, and shell (Tahil & Dy, 2016), while at 30 hpf it was based on abnormal bodies, abnormal shells, or unshelled larvae (Li et al., 2013). Larval lengths at 20 and 30 hpf were measured using a stereomicroscope (Leica MZ10F, Leica Microsystems) at a magnification of 6.3 × 100 µm.
DNA damage was evaluated using alkaline single-cell electrophoresis (CometAssay, Trevigen, Gaithersburg, MD, USA). After pH treatment, larvae of 20 and 30 hpf were sampled and homogenized in a buffer containing 1X HBSS, 10% dimethyl sulfoxide, and 20 mM EDTA with a pH of 7.0–7.5. Samples were centrifuged at 845×g for 5 min at 4°C. The cell pellet was then diluted in chilled phosphate-buffered saline and combined with molten LMAgarose at a ratio of 1:10 (v/v). A 100 µL aliquot was immediately pipetted onto the CometSlideTM and incubated at 4°C in the dark for 10 min. Then, slides were submerged in a lysis solution at 4°C in the dark for 30 min before being placed in an alkaline solution (NaOH 8 g and 5 mL 200 mM EDTA L–1 distilled water) for another 30 min. Electrophoresis was carried out using an alkaline electrophoresis solution (NaOH 8 g and 2 mL 500 mM EDTA L–1 distilled water) at 21 V for 30 min. Slides were then immersed twice in distilled water for 10 min each, followed by a 5-minute immersion in 70% ethanol. Samples were stained with SYBR Gold for 30 min and observed using a fluorescence microscope (DM 2500, Leica, Wetzlar, Germany) for analysis. Fifty cells per treatment were scored randomly and analyzed using the Comet Assay IV Lite System (Instem, Staffordshire, UK). Tail intensity (% tail DNA) was used to express cellular DNA damage.
After pH treatment, 10 mL samples of 20 and 30 hpf larvae were subsampled and placed in glass bottles with an oxygen sensor spot (SP-PSt3-NAU, PreSens, Regensburg, Germany) affixed to the inner wall. Screw caps and parafilm were used to tightly and carefully seal the glass bottles. The initial oxygen concentration was immediately recorded utilizing a fiber optic oxygen meter, the Fibox 4 (PreSens), connected to a polymer optical cable (POF, PreSens). Reactive oxygen spots were calibrated by scanning the integrated barcode reader sensor of the oxygen meter, according to the manufacturer’s instructions. After one hour, the oxygen sensor in each bottle was scanned again to record the final oxygen level. Larvae in each bottle were then counted, and oxygen consumption was estimated by deducting the final oxygen concentration from the initial value and dividing by the number of larvae. The data are expressed as nmol.larvae–1.h–1.
The larval settlement rate was assessed using premetamorphic 96-hour post-fertilization (hpf) veliger larvae, which were competent to settle based on the presence of a third tubule on the cephalic tentacle (Mzozo et al., 2023). Fifteen 10-liter plastic aquaria were filled with 8 L of seawater at different pH levels, with 3 replicate tanks per treatment. Two vertical polycarbonate plates (10 cm × 15 cm), covered with diatoms, which served as live food sources and factors to encourage natural settlement, were inserted in each tank. After estimating the larval density, 5 mL of larvae were distributed into each tank. The settlement rate was measured after 24 hours by calculating the number of larvae that settled on the two plates and dividing by the total number of initially incubated larvae.
Abalone larvae at 20 and 30 hpf were sampled and immediately frozen in liquid nitrogen. Before RNA extraction, the samples were frozen at –80°C. Total RNA was isolated using RiboEx (GeneAll Biotechnology, Seoul, Korea) according to the manufacturer’s instructions. RNA purity was determined using a NanoDropTM OneC (Thermo Fisher Scientific, Wilmington, MA, USA) instrument. Subsequently, high-quality total RNA was reverse transcribed into cDNA using the Maxima First-Strand cDNA Synthesis kit (K1641, Thermo Fisher Scientific), following the manufacturer’s instructions. A polymerase chain reaction was performed under the following conditions: initial denaturation at 25°C for 10 min, annealing at 65°C for 30 min, and a final extension at 85°C for 5 min. The synthesized cDNA was stored at –80°C until further analysis.
Two biomineralization genes (calmodulin and carbonic anhydrase) and one heat stress-related gene (HSP90) were analyzed in this study. Specific primers used are listed in Table 1. Gene amplification was performed using a reaction mix comprising 2 μL of cDNA, 10 μL of 2× qPCR mix buffer, 0.6 μL (10 mM) each of forward and reverse primers, and 6.8 μL of nuclease-free water. Pre-denaturation was performed at 50°C for 2 min, followed by 40 cycles of denaturation at 95°C for 15 s, annealing at 60°C for 30 s, and extension at 72°C for 30 s. Amplification results were verified using PikoReal software 2.1, and the 2−ΔΔCt method was used for comparison with previously published Ct values. Ribosomal protein L3 (RPL3) was used as a reference gene, as described by Choi et al. (2022).
| Gene name | Sequence (5’–3’) | References |
|---|---|---|
| RPL3 | F: 5’-AGTCCTTCCCTAAGGATGACAAG-3’ | Choi et al. (2022) |
| R: 5’-GCCTCCACAACTTCCTTCTTATT-3’ | ||
| Carbonic anhydrase | F: 5’-GAGAAAACGCTACGATGCTG-3’ | Sharker et al. (2021) |
| R: 5’-GCTCTCCTTCACACAATGG-3’ | ||
| Calmodulin | F: 5’-AGCCTTTTCGACAAAGACGG-3’ | Designed for the study |
| R: 5’-TCTGGCCATCATTGTCAGGA-3’ | ||
| HSP90 | F: 5’-TTGACGAGTACTGTGTCCAG-3’ | Lee et al. (2023) |
| R: 5’-ACCAGACGATTGGAAACCAC-3’ |
The Shapiro-Wilk Test was applied to ensure that all data were normally distributed. Normally distributed data were evaluated with one-way analysis of variance (ANOVA) and Tukey’s post hoc test. A t-test was also used to compare the two larval stages at each pH. For non-normally distributed data, the Kruskal-Wallis test was used, followed by Dunn’s post hoc test. Additionally, a Wilcoxon test was applied to compare changes between the two larval stages at each pH. Two-way ANOVA and Aligned Rank Transform ANOVA were performed to evaluate interaction effects between pH and larval age (p < 0.05). We performed Spearman’s Rho Correlation to assess the correlation between parameters. All data were analyzed using SPSS version 25.0 (IBM, Armonk, NY, USA).
Results
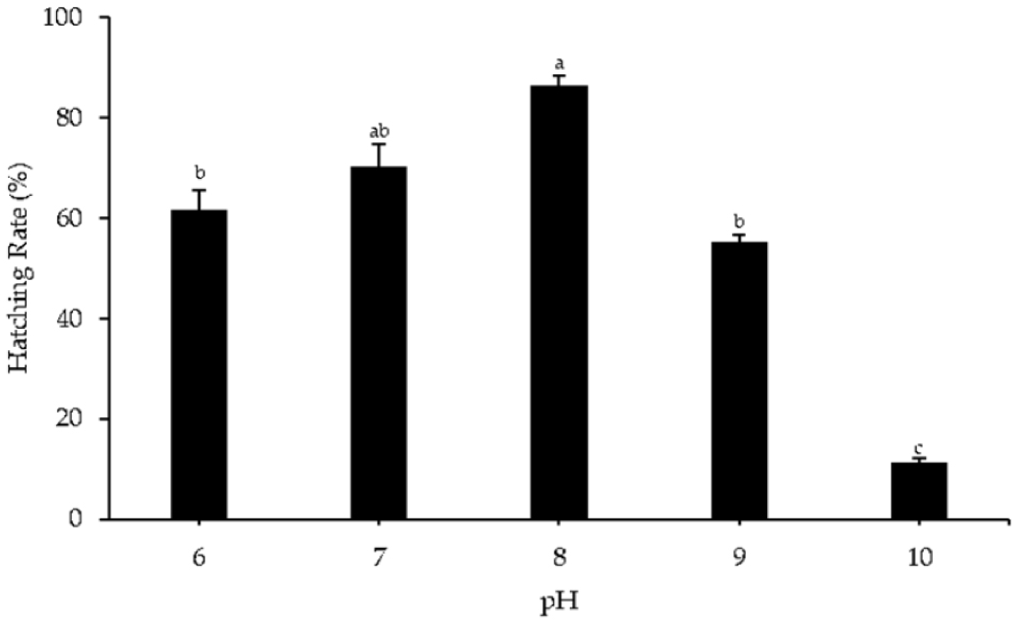
The highest hatching rate of Pacific abalone was observed in the control group at pH 8 (86.40 ± 2.01%). The lowest hatching rate was observed at pH 10 (11.17 ± 0.83%) and significantly differed from those observed with other pH treatments. The hatching rates were not significantly different between pH 6, 7, and 9, nor between pH 7 and 8 (Fig. 1).
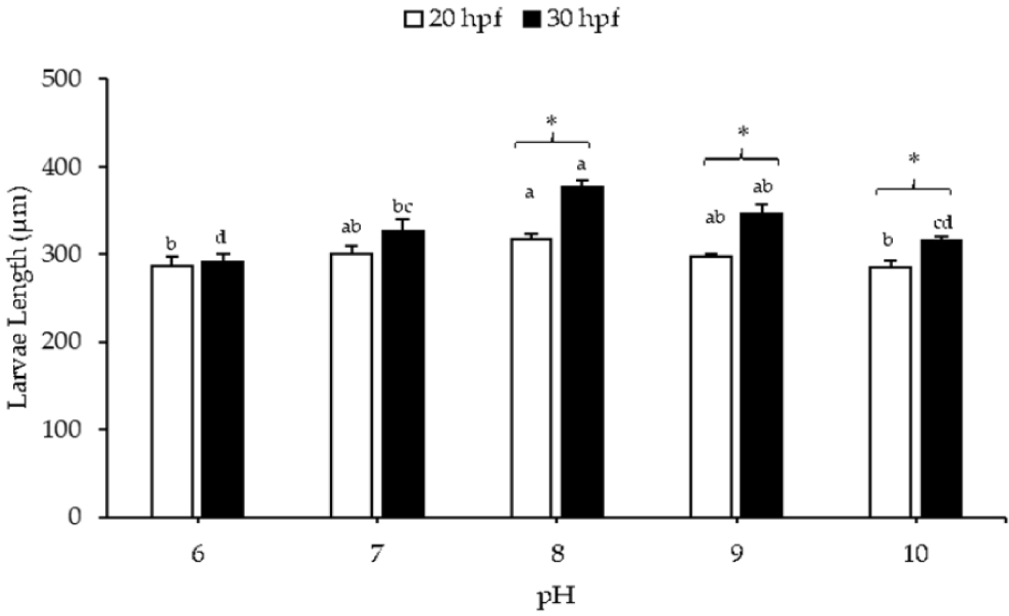
For a larval length of 20 hpf, substantial reductions were noted in the lowest pH (pH 6) and highest pH (pH 10) treatments compared to the control (pH 8; 317.86 ± 6.06 μm). The shortest larval length was recorded at pH 10 (284.83 ± 8.49 μm), followed by pH 6 (286.56 ± 10.04 μm). In the case of 30 hpf larvae, the larval length at pH 8 (377.14 ± 7.41 μm) was not significantly different from that at pH 9 (346.74 ± 10.29 μm), but it differed from the other pH levels. The shortest larval length was observed at pH 6 (290.78 ± 9.60 μm), followed by pH 10 (315.02 ± 5.22 μm). Substantial differences in larval length were observed between 20 and 30 hpf at pHs of 8–10 (Fig. 2).
The malformation rates of larvae at 20 and 30 hpf are presented in Fig. 3. The malformation rate of 20 hpf larvae at pH 6, 9, and 10 was increased significantly from the control (pH 8). At 20 hpf, the malformation rates of larvae at pH 6 and 10 were 46.59 ± 3.54% and 43.03 ± 4.125%, respectively. Normal and abnormal trochophore larvae were observed at pHs 6 and 10, but none showed shell formation (Fig. 4A and 4E). Meanwhile, at pH 9, some larvae showed shell formation (Fig. 4D) despite the relatively high malformation rate (39.32 ± 2.91%). Almost all larvae at pH 7 and 8 and 20 hpf showed the presence of a shell (Fig. 4B and 4C). The malformation rates at pH 7 and 8 were 27.27 ± 2.94% and 18.28 ± 1.65%, respectively.
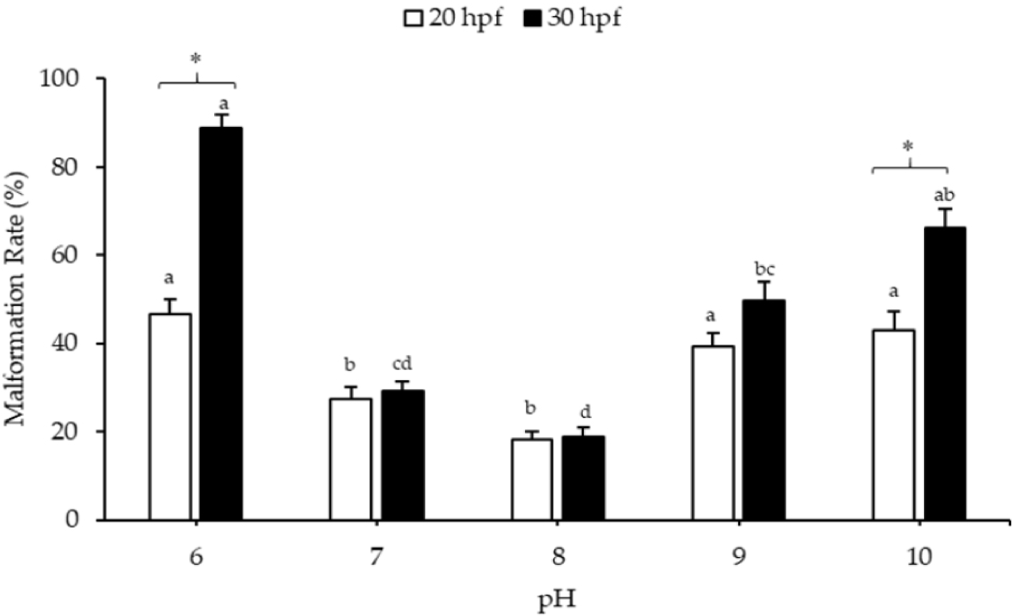
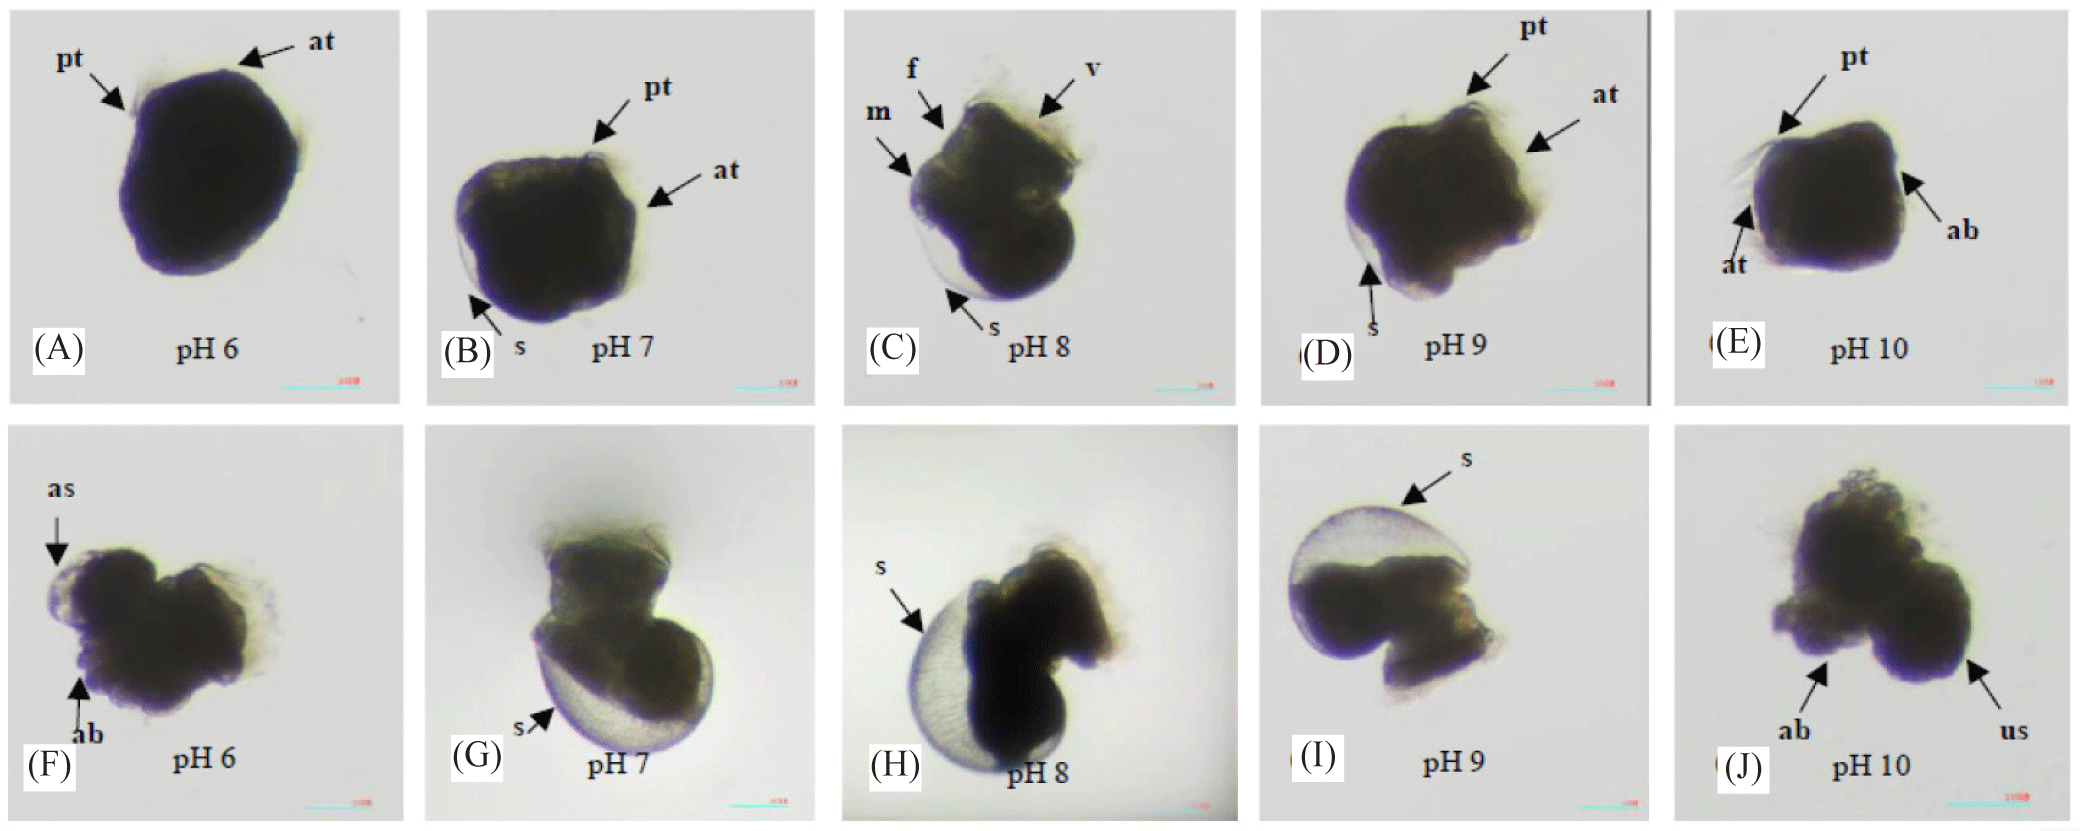
The malformation rates of 30 hpf larvae at pH 6, 9, and 10 were also significantly higher than those of the control (pH 8) (Fig. 3). At pH 6, 9, and 10, the malformation rates were 88.85 ± 3.06%, 49.58 ± 4.32%, and 66.24 ± 4.13%, respectively. Although some larvae could develop into normal veligers at pH 6 and 10, over 50% were aberrant (Fig. 4F and 4J). At pH 8, the larvae at 30 hpf had the lowest malformation rate (18.74 ± 2.22%). At pH 6 and 10, the malformation rate of larvae at 30 hpf was significantly higher than that of larvae at 20 hpf.
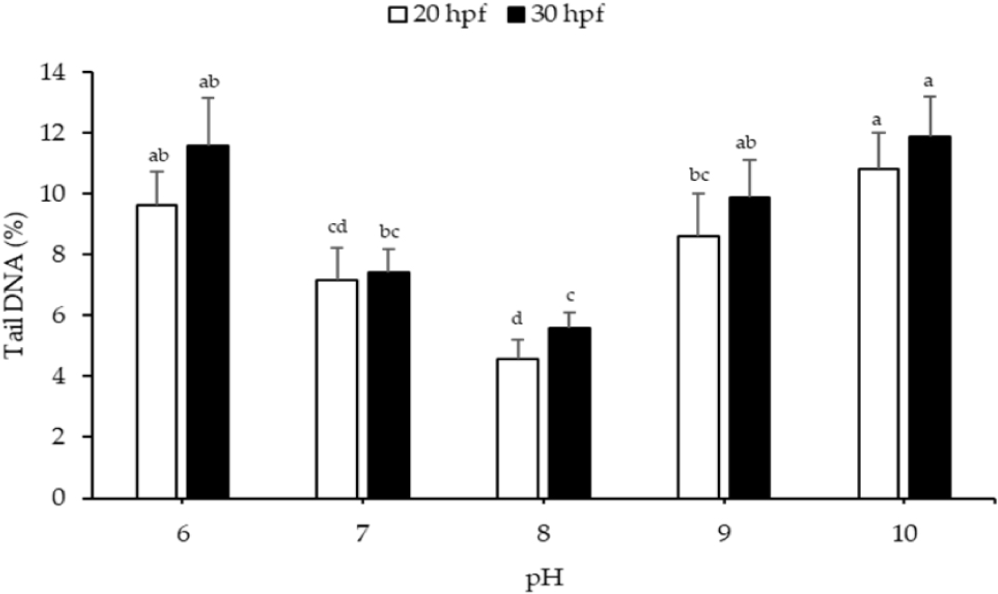
The recorded DNA damage in Pacific abalone larvae under various pH treatments is shown in Fig. 5. At 20 and 30 hpf, the DNA damage of larvae was significantly higher at pH 6, 9, and 10, compared to the control (pH 8). The highest DNA damage was observed at pH 10 for larvae at both 20 and 30 hpf, with values of 10.83 ± 1.15% and 11.85 ± 1.32%, respectively.
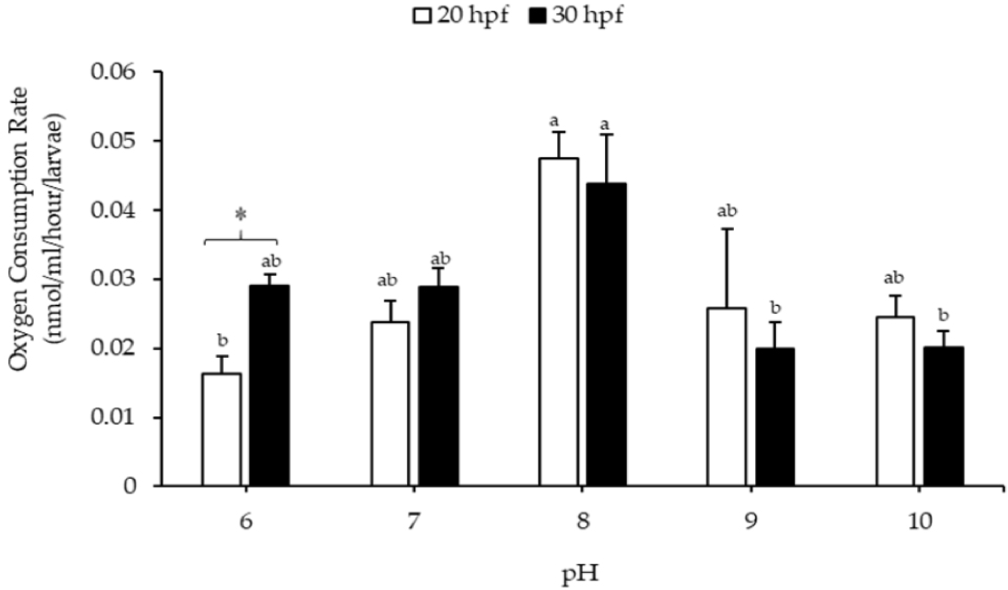
Our findings regarding the effects of pH on the oxygen consumption rate of Pacific abalone larvae are shown in Fig. 6. At pH 8, the larvae at 20 and 30 hpf had the highest oxygen consumption rates, with values of 0.0475 ± 0.0038 and 0.0437 ± 0.0071 nmol.larvaeM–1.h–1, respectively. The oxygen consumption rate of 20 hpf larvae decreased significantly at pH 6, whereas for 30 hpf larvae, it decreased at pH 9 and 10, compared to the control. Additionally, oxygen consumption rates in 20 and 30 hpf larvae were significantly different at pH 6.
Highly significant differences (p < 0.05) were observed in the number of attached larvae at pH 10 and the control (pH 8). The lowest settlement rate was recorded at pH 10 (1.27 ± 0.093%). However, no significant differences were found between pH 6, 7, 9, and the control (Fig. 7).
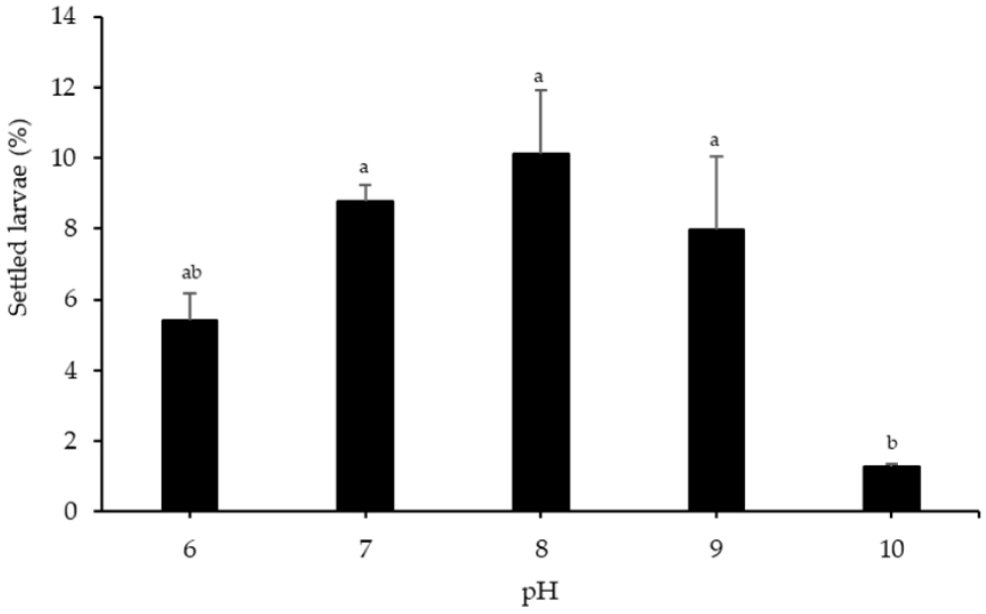
Fig. 8A depicts the relative mRNA expression levels of the calmodulin gene in Pacific abalone larvae, standardized to RPL3 expression levels under different pH conditions. Calmodulin expression levels in larvae at 20 and 30 hpf were not significantly affected by pH (p > 0.05). The calmodulin expression value at 20 hpf was higher than that at 30 hpf, especially at pH 10. Fig. 8B illustrates carbonic anhydrase expression levels in Pacific abalone under various pH treatments. At 20 and 30 hpf, the expression levels of carbonic anhydrase showed different trends. At 20 hpf, the highest carbonic anhydrase gene expression level was recorded at pH 6 (2.72 ± 0.95-fold change); the level decreased as the pH increased, although not significantly. Meanwhile, at 30 hpf, the highest expression was observed at pH 8 (1.00 ± 0.05-fold change), and this value was significantly different from that observed with other pH treatments (p < 0.05). Additionally, carbonic anhydrase expression was higher at 20 hpf than at 30 hpf, especially at pH 6. HSP90 expression levels at 20 and 30 hpf remained unaffected by pH (p > 0.05) (Fig. 8C).
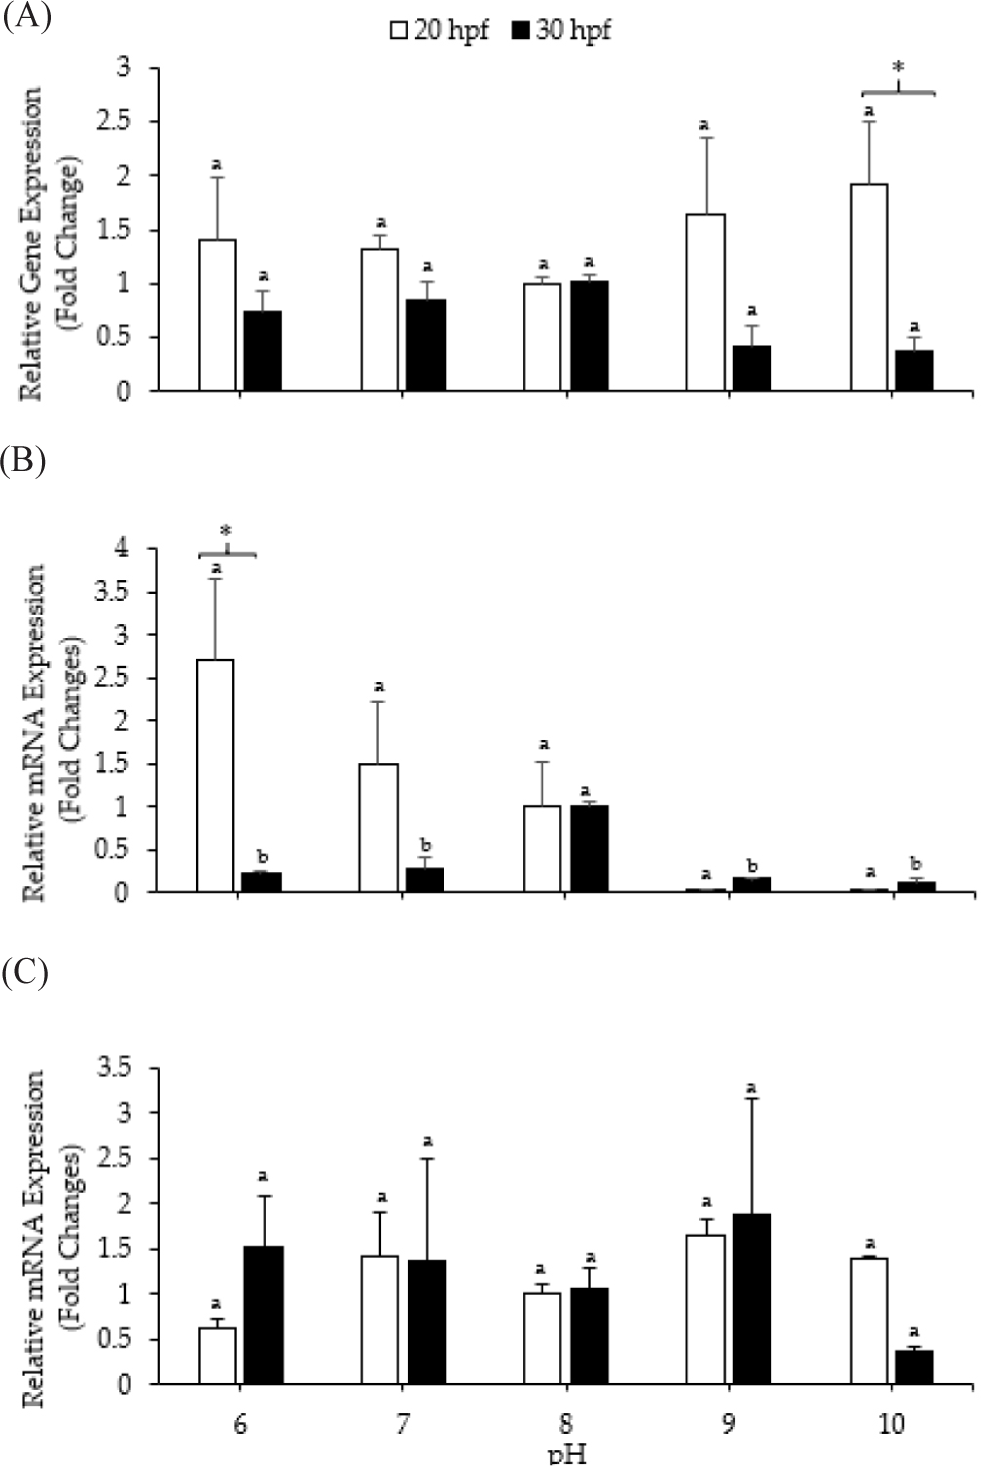
Table 2 displays the interaction effect between pH and larval age. Only larval length and malformation rate showed significant interaction between pH and larval age. Table 3 displays the correlation coefficient matrix of the study parameters. Most of the parameters showed a correlation with more than one other parameter. However, no correlation was found between the oxygen consumption rate and the expression of the HSP90 gene with any other parameters.
Discussion
The survival and growth of early-life-history-stage abalone are critical for determining the size of the adult abalone population (Tahil & Dy, 2016). A decline in the adult population results in a concomitant reduction in output levels and overall economic performance. Previous research has shown that the growth of abalone larvae is affected by the seawater pH (Wessel et al., 2018). Studies assessing the effects of varying seawater pH levels on abalone larvae and other mollusks remain limited. This work represents the first investigation into the effects of extreme seawater pH on the early larval developmental stages of Pacific abalone.
Our findings indicate that extreme pH levels significantly affect the hatching rate of this species. The hatching ability of Pacific abalone eggs remains viable across all pH treatments. However, a significant decrease in the hatching rate was observed upon treatment with a very low pH of 10. This reduction is attributed to the introduction of NaOH into the seawater, which then permeates the egg and hampers embryogenesis. Elevated pH levels can also result in lime deposition on the external surface of the egg, impeding the ingress of essential nutrients from the external environment, thereby hindering the hatching process (Saad et al., 2023). Huo et al. (2019) observed disparate outcomes in the hatching of Geoduck clam (Panopea japonica) eggs, revealing a significant decrease in hatching rate when exposed to acidic water with a pH of 6.8, compared to alkaline water with a pH of 9.2. According to Jiang et al. (2021), acidic water can reduce pH, resulting in the softening and decreased flexibility of the egg membrane, which facilitates membrane rupture and embryo mortality. Previous studies have documented reductions in hatching rates when exposed to lower pH levels, as compared to control conditions in many species, including the donkey’s ear abalone (Tahil & Dy, 2016), and Baltic tellin (Macoma balthica) (van Colen et al., 2012).
At 20 hpf, differences in larval length were observed only between pH 8 (control), and pHs 6 and 10. Meanwhile, in 30 hpf larvae, differences in length occurred between pH 8 (control) and pH 6, 7, and 10. It is hypothesized that the observed phenomenon can be attributed to the effect of the duration of each pH treatment on larval development. Kapsenberg et al. (2018) reported a positive correlation between the duration of pH treatments and the probability of experiencing delayed larval development. This result is in contrast with research involving European abalone, which showed that a change in pH from 8 to 7.6 significantly affected the development of larvae at 20 and 30 hpf (Wessel et al., 2018). This indicates that sensitivity to pH varies between species (van Colen et al., 2012).
In this study, larval development at extremely low pH (pH 6) was delayed, and malformation rates were higher than at pH 10. This is in accordance with findings on the Geoduck clam, which showed that acidic pH reduces larval length more than alkaline conditions. Alkaline environments are preferable to acidic circumstances for calcification. At alkaline pH values, seawater calcium carbonate is more saturated, which promotes the synthesis and stability of calcium carbonate, thereby accelerating larval growth and shell formation. Meanwhile, low pH conditions delay mineralization, result in shorter larval lengths, and inhibit shell formation (Huo et al., 2019). The malformation rate at control (pH 8) was less than 20% but greater than 10%. The result is similar to the experiment performed by Li et al. (2013), who used the same species and figured out that the malformation rate was less than 20 but greater than 10% at pH 7.9 and 8.2. This is likely due to low-quality egg batches (Nagy et al., 2024) and genetic factors (Lorenzo-Felipe et al., 2021).
In this experiment, treatment at pH 8 resulted in the lowest DNA damage values in larvae at 20 and 30 hpf, significantly differing from those at pH 6, 9, and 10. This outcome is attributed to the induction of reactive oxygen species (ROS) release owing to pH changes (Wu et al., 2016). Similarly, a reduction in pH acts as a stressor that, when combined with osmotic regulation, can modify the body’s antioxidant capacity (Kim et al., 2023). Ultimately, an antioxidant capacity lower than ROS generation can result in DNA damage (Wu et al., 2016). DNA damage, resulting in the loss of genetic material, is a significant indicator of how pH affects larvae, as it may cause chromosomal instability and subsequent pathological alterations in cells and tissues (Augustyniak et al., 2014). Increased DNA damage in aquatic organisms under low pHs or alkaline treatments has been reported in Mediterranean mussels (Braga et al., 2020).
The oxygen consumption rate is a key indicator of health in marine organisms, providing insight into stressful environmental conditions (Harris et al., 1999). According to this study, extremely low (pH 6) or high (pH 9 and 10) pHs considerably reduced the oxygen consumption rate of Pacific abalone larvae. Metabolic depression is often a short-term energy storage mechanism for surviving stressful situations. Consequently, larvae can increase their chances of survival during a difficult period by conserving most of their energy for maintenance at the expense of other functions. However, long-term exposure to pH stress can reduce larval survival (Martel et al., 2022). A decrease in metabolic rate can also occur due to decreased enzyme efficiency (Mangan et al., 2017). A significant decrease in oxygen consumption was observed under low and high pH stress in juvenile Greenlip abalone (Haliotis laevigata), cultivated for 50–68 days when pH levels were altered using HCl and NaOH (Harris et al., 1999). Alternatively, pH stress caused a significant increase in oxygen consumption rate in Eastern oyster (Crassostrea virginica) larvae (Schwaner et al., 2023). Meanwhile, Blue mussels (Mytilus edulis) exhibited variable oxygen consumption rates between short-term (6 h) and medium-term exposure (2 weeks) (Mangan et al., 2017). Thus, it is hypothesized that metabolic responses to pH stress are influenced by the duration of exposure (Mangan et al., 2017).
This study found that pH did not affect calmodulin gene expression in Pacific abalone larvae at 20 and 30 hpf. This finding is in contrast with the results described by Liu et al. (2012), who observed a significant downregulation of calmodulin gene expression in pearl oysters (Pinctada fucata) at pH 7.7. According to Xin et al. (2022), calmodulin is crucial for regulating calcium homeostasis in bivalves and its downregulation may inhibit calcification. Although pH did not have a significant effect on calmodulin in this study, prolonged pH exposure may eventually disrupt calmodulin expression and interfere with the calcification process.
Carbonic anhydrase plays a crucial role in facilitating biological calcification in several marine invertebrates. Carbonic anhydrase facilitates the reversible hydration of carbon dioxide, producing bicarbonate ions (HCO3–) and hydrogen ions (H+), which are crucial for providing the dissolved inorganic carbon necessary for forming skeletal structures (Zebral et al., 2019). Carbonic anhydrase expression under pH stress has been poorly studied in Pacific abalone larvae. This study showed that the expression of carbonic anhydrase in Pacific abalone larvae at 30 hpf was reduced in both alkaline and acidic conditions. Carbonic anhydrase expression was also decreased in blue mussels with treatment at low pHs on days 14 and 21. On day 21, the calcification rate also decreased (Sun et al., 2016). Low pHs may cause enzyme denaturation or inhibit enzyme-substrate interactions, thereby reducing enzyme activity (Sun et al., 2016). The inhibition of carbonic anhydrase activity may inhibit shell formation (Sun et al., 2016).
The pH stress is known to increase intracellular ROS, which causes oxidative stress (Wu et al., 2016). HSPs are crucial for mitigating pH-induced oxidative stress (Qian et al., 2012). In this study, we investigated HSP90 expression in Pacific abalone larvae cultured under various pH conditions. Although HSP90 gene expression levels fluctuated in larvae at 20 and 30 hpf, they were not significantly different. Fluctuations in HSP90 gene expression levels under pH stress with various exposure durations were also observed in vannamei shrimp (Litopenaues vannamei) cultured under five different pHs (6.1, 7.1, 8.1, 9.1, and 10.1) (Qian et al., 2012). HSP expression might be upregulated as a defense mechanism (Sganga et al., 2022), while it may be downregulated owing to a reduction in the available energy resources required for HSP synthesis (Liu et al., 2012).
During the early stages of larval development of abalone (lecithotrophic), external feeding is unnecessary as they obtain their nutrition from the egg yolk (Koyama et al., 2020). Upon reaching the premetamorphic stages, larvae must find a suitable substrate and start benthic grazing at the bottom of the aquatic environment (Espinel-Velasco et al., 2021). In this study, extremely low pH (6) and high pH (10) conditions decreased the settlement rate. In 2015, Tahil & Dy (2015) suggested that reduced pH levels can cause morphological problems and delayed development, making settlement more difficult for larvae. Changes in pH can lead to a reduction in the nutritional value of diatoms and impair the ability of larvae to recognize suitable substrates for settlement (Gómez-Reyes et al., 2023).
The pH treatment and larval age have a strong interaction effect on larval length and malformation rate. The larvae at 30 hpf experienced a longer pH exposure compared to those at 20 hpf. This can potentially result in increased damage to the larvae. Additionally, it can inhibit growth from 20 to 30 hpf in extreme acidic or alkaline pH conditions. In the correlation test, DNA damage had a strong negative correlation with hatching rate and settlement rate but a positive correlation with malformation rate in both 20 and 30 hpf larvae. This indicates that high damage to larvae DNA can lead to a high malformation rate.
Conclusion
The study revealed that extreme pH levels affected the hatching rate, malformation rate, larval length, DNA damage, and oxygen consumption rate of early-stage abalone larvae and the settlement rate of competent larvae. Deviations in pH beyond the optimal conditions also altered carbonic anhydrase gene expression in 30 hpf larvae. However, extreme pHs did not affect the expression of the calmodulin and HSP90 genes in abalone larvae. This research contributes fundamental knowledge regarding the sensitivity of Pacific abalone larvae to extreme pH conditions.
