
Introduction
Morphological variability is a widely observed characteristic in freshwater fish (Manna et al., 2019; Su et al., 2019). This variability generally results from the adaptation of populations to environmental constraints, which can lead to genetic divergences between populations (Boussou et al., 2024; Ndiwa et al., 2016). Understanding this phenotypic variability is essential for analyzing and comprehending the genetic structuring of a species and guiding selection programs and conservation efforts for aquaculture relevant genotypes (Adedeji et al., 2024; Boussou et al., 2024; El-Zaeem et al., 2012; Kwikiriza et al., 2023).
The analysis of morphometric and meristic variables in fish remains the most direct and commonly used method for intra or inter population discrimination (Adedeji et al., 2024; Kwikiriza et al., 2023; Makeche et al., 2020). Morphometric variables, which are continuous quantitative variables describing fish size and shape, are strongly influenced by environmental variations (Ben Labidi et al., 2021; Fagbuaro et al., 2015). Conversely, meristic variables, which are discrete variables, are determined by both genetic and environmental factors (Liasko et al., 2012). These variables have been used to characterize populations of various fish species, including the bogue (Boops boops) (Ben Labidi et al., 2021), common carp (Cyprinus carpio) (Jawad et al., 2022), African catfish (Clarias gariepinus) (Compaoré et al., 2015; Solomon et al., 2015), tilapia (Sarotherodon galilaeus) (Fagbuaro et al., 2015), and Nile tilapia (Oreochromis niloticus) (Adedeji et al., 2024; Boussou et al., 2024; Kwikiriza et al., 2023; Tibihika et al., 2023).
Nile tilapia is one of the most widely farmed aquaculture species in the world. Native to Africa, this species was introduced to several countries due to its remarkable aquaculture performance (resistance to various biotic and abiotic stresses, high-quality flesh, flexible feeding) and its adaptability to diverse ecological conditions (Tibihika et al., 2020). In West Africa, this species is widely distributed across river basins, exhibiting significant genetic and phenotypic diversity (Lind et al., 2019). Burkina Faso is among the West African countries with a rich diversity of natural Nile tilapia populations (Lind et al., 2019; Tibihika et al., 2020), which have been underutilized in aquaculture systems. Despite this diversity, very few studies have focused on the morphological characterization of West African Nile tilapia populations.
Beyond general morphological variability, Nile tilapia also exhibits sex determination mechanisms is a species whose sexual determination is influenced by interactions between genetic and environmental interactions (Baroiller & D’Cotta, 2016; Nivelle et al., 2019; Sissao et al., 2019). Environmental factors, particularly temperature, can induce phenotypic sex reversals at early developmental stages, leading to atypical individuals such as XX males and XY females. This raises questions about whether sexual genotypes contribute to morphological differences, as seen in other species like rainbow trout (Oncorhynchus mykiss) (Salinas et al., 2022). Most morphological characterization studies on Nile tilapia have focused on discriminating natural populations or farmed strains from East Africa (Asmamaw & Tessema, 2021; Endebu et al., 2021; Ikpeme et al., 2017; Kwikiriza et al., 2023; Makeche et al., 2020; Ndiwa et al., 2016; Tibihika et al., 2018, 2020, 2023). While genetic studies confirm distinctions between West and East African Nile tilapia (Bezault et al., 2011; Toguyeni et al., 2007), morphological comparisons remain scare particularly for populations in Burkina Faso. Moreover, no study as assessed whether sexual genotype (e.g., XX males) influences morphology in wild West African populations, despite evidence of such interactions in other species (Salinas et al., 2022). This underscores the importance of conducting this study to analyze for the first time, the morphological variability of natural Nile tilapia populations in West Africa based on sexual genotype.
This study primarily aims to characterize the morphological variability of atypical and typical male from two natural populations of Nile tilapia in Burkina Faso as part of a local strain selection program.
Materials and Methods
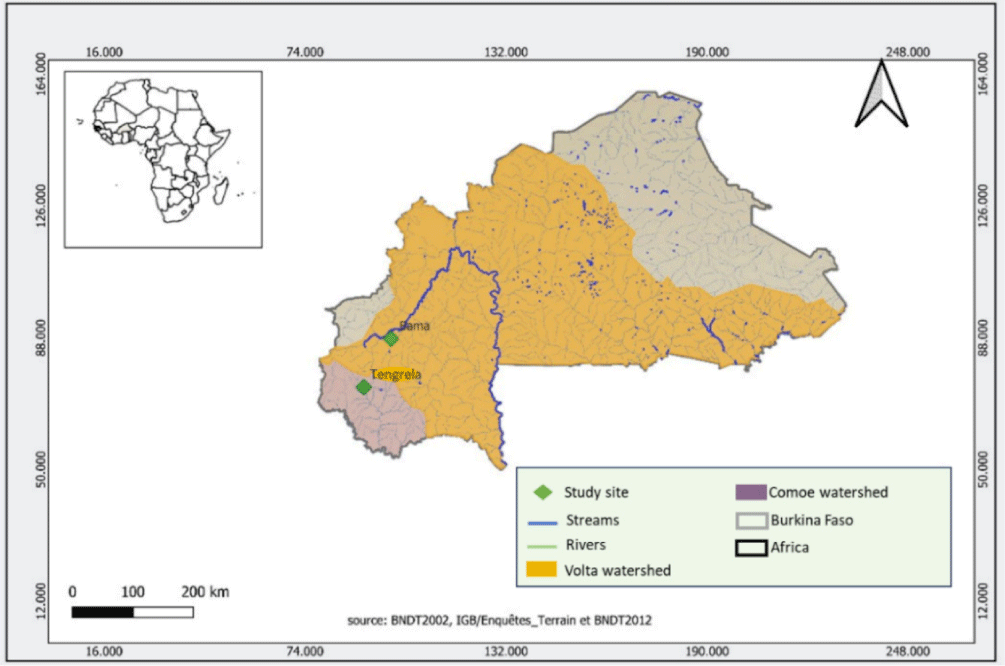
Two natural populations of Nile tilapia from Lake Tengrela and Lake Kou (Bama) in Burkina Faso were used for this study (Fig. 1). The characteristics of the two lakes are summarized in Table 1. For each population, 30 males with an average individual weight exceeding 50 g were collected with the assistance of local fishermen. Capture of these wild fish was conducted in accordance with articles 177, 187 and 202 from the Ministry of Animal Resources and Fisheries of Burkina Faso. After, capture the fish were immediately transported to the Molecular Biology Laboratory of the Aquaculture and Aquatic Biodiversity Research Unit for morphological parameter measurements.
Genomic DNA (gDNA) extraction was performed from a thin portion of caudal fin of each 30 males used for morphometric analysis in both populations, following the protocol described by Taslima et al. (2016). Thus, thin portion (0.5 × 0.5 cm) of caudal fin was digested at 55°C overnight in lysis solution (0.3 M NaCl, 50 mM Tris Base, 0.2 mM Ethylenediaminetetraacetic acid [EDTA], 0.2 mM Ethylene glycol-O,O'-bis(2-aminoethyl)-N,N,N',N'-tetraacetic acid [EGTA], 0.356 mM spermidine, 0.256 mM spermine, 4.8%) containing 30 µg of proteinase K. Treatment with ribonuclease (RNase) (10 µg) was then carried out for 1 hours at 37°C. Proteins were precipitated by adding 5M NaCl buffer and gDNA was isolated using 100% isopropanol, washed in 70% ethanol and resuspended in 5 mM Tris buffer. The gDNA was quantified on the nanodrop measurements, diluted to 30 ng/µl and stored at −20°C before polymerase chain reaction (PCR) reactions.
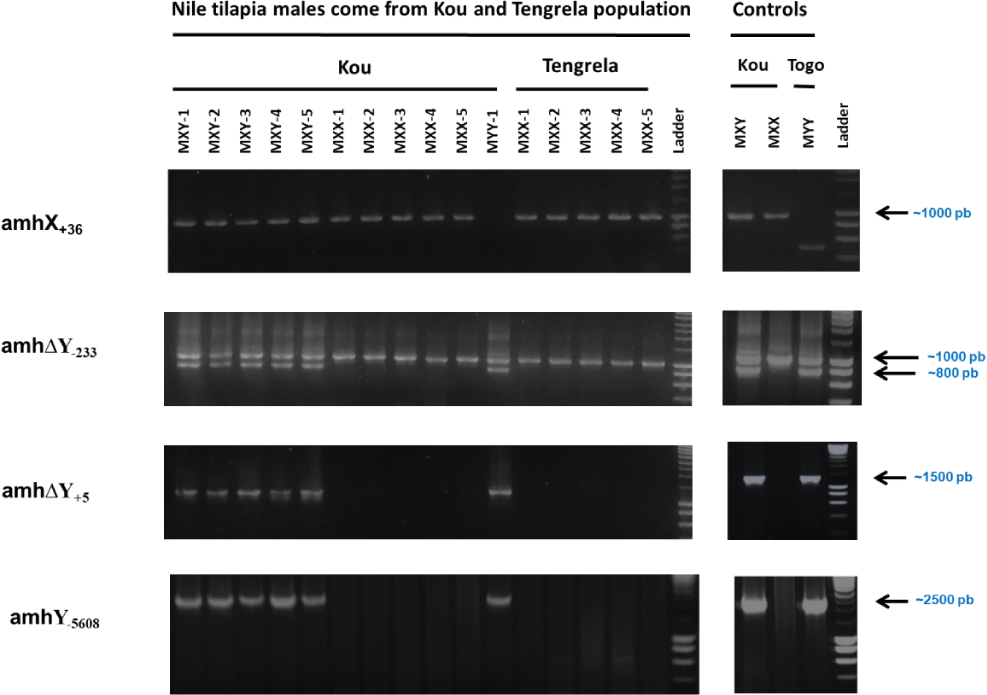
The presence of X and Y sex chromosomes was determined using combination of four amh markers (amhX+36, amh∆Y+5, amh∆Y-233 and amhY-5608) previously validated by Sissao et al. (2019) on the Kou strain (Table 2). These four markers are characterized by insertions and deletions in exons 2, 6, 7 and in the promoter and amh gene (Table 3). For each marker, amplification of the corresponding genome region was performed using PCR in a reaction volume of 25 µl with specific primers.
Amplification of the corresponding region of the markers amhX+36, amh∆Y+5, amh∆Y-233 was performed using 3 µl of gDNA (30 ng/µl) with a normal Taq polymerase (MP Biomedicals, Irvine, CA, USA) whereas for the amhY-5608 marker, because of the size of amplified fragment (8,022 and 2,414 pb), amplification was performed with the LongAmp Taq (New England Biolabs, Ipswich, MA, USA) using 53 µl of gDNA (30 ng/µl) in a 25 µl PCR reaction. The PCR program for each marker is shown in Table 4. The amplified products were then separated on a 1.5% agarose gel and visualized using a gel imager.
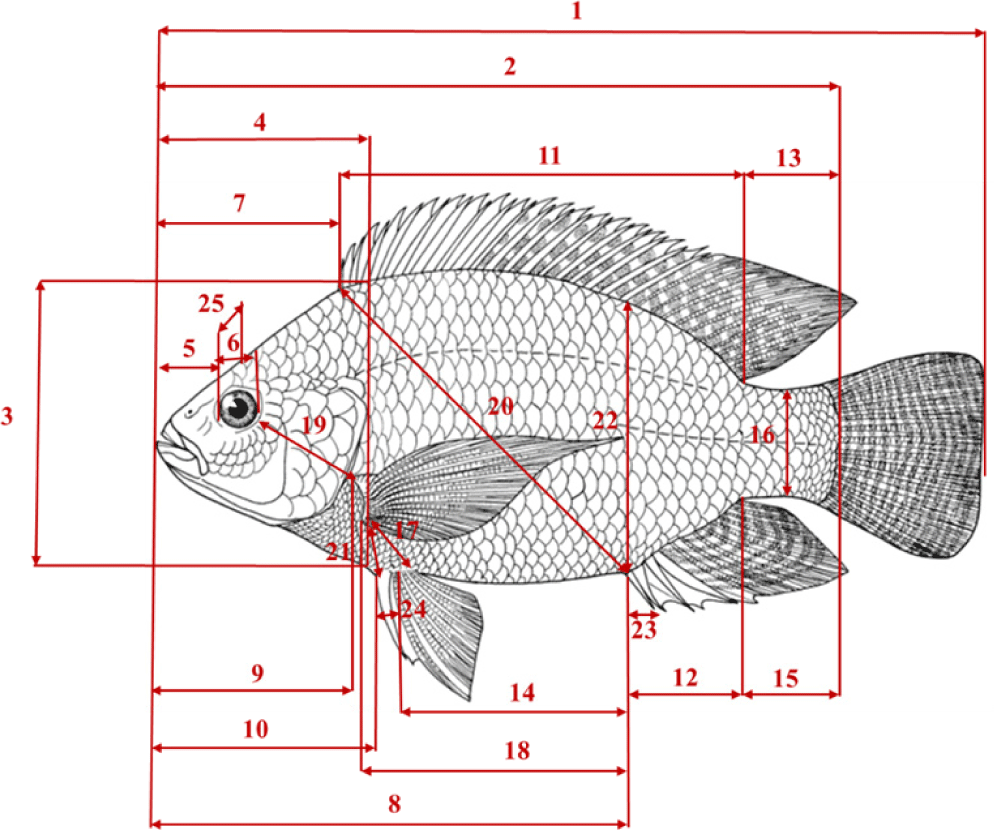
For the morphological characterization of individuals from the two Nile tilapia populations in Burkina Faso, a total of 34 variables were recorded, including 25 metric variables (Fig. 2), 3 weight-related variables, and 6 meristic variables (Table 4). The selected metric and meristic variables were based on those previously used for the morphological discrimination of Nile tilapia and their hybrid in West Africa (Konan et al., 2017; Nicolas et al., 2013). The meristic variables were counted using a magnifying glass. Metric variables were measured with a digital caliper (Stainless Hardened) with a precision of 0.01 mm and ponderal variable with a precision balance (KERN) of 0.0001 g. The measured weight-related variables were used to calculate two indices: the gonadosomatic index (GSI) and the hepatosomatic index (HIS) following the formula:
The growth relationships between length and weight were determined using standard Le Cren (1951) formula: P = aLb, where P is the total weight of the fish in grams, and L is the total length in centimeters. The parameters a and b represent the proportionality constant and the allometric coefficient, respectively. These two parameters were determined after logarithmic linearization; a = ex, where x represents the logarithmic constant of the regression curve, and b represents the slope of this curve.
The statistical analyses were performed using R software version 4.3.3. To eliminate the effect of individual size, head morphometric data were standardized as a percentage of head length, while body measurements were standardized as a percentage of standard length. The entire dataset was subjected to the Shapiro-Wilk normality test. A one-way analysis of variance (ANOVA) was used to identify mean differences in morphological variables between the genetic males of the two populations. The Newman-Keuls test was used for pairwise mean separation of normally distributed parameters, while the Duncan rank test was applied to separate the means of parameters that did not follow a normal distribution. A principal component analysis (PCA) and discriminant factor analysis (DFA) were conducted with variables presented a highly difference (p < 0.01) to identify different groupings and correlations between the variables and the sexual genotype of the males. The FactoMineR, MASS and Stats R packages were respectively used to PCA, DFA and ANOVA.
Results
A total of 21 XY males, 8 XX males, and 1 YY male were identified in the Kou population (Table 3). In contrast, all males in the Tengrela population exhibited an XX sexual genotype based on these markers (Fig. 3). The only YY male in the Kou population was considered an outlier for following statistical analyses.
The variability analysis of metric parameters (Table 5) revealed that 15 metric variables showed significant differences (p < 0.05) between XY males from the Kou population and XX males from either the Kou or Tengrela populations. Among these 15 variables, total length (TL), head height (HH), eye diameter (ED), pre-pectoral distance (PrPcD), pre-pelvic distance (PrPeD), dorsal fin base length (DFBL), pelvic-anal distance (PeAD), pectoral-pelvic distance (PcPeD), pectoral-anal distance (PcAD), pelvic-pelvic distance (PePeD), and interorbital diameter (IOD) displayed highly significant differences (p < 0.01).
| Populations | XY males | XX males | YY males |
|---|---|---|---|
| Kou population |
21 70% |
8 26.67% |
1 3.33% |
| Tengrela population |
0 0% |
30 100% |
0 0% |
Regarding meristic variables, the mean values recorded in Table 6 did not indicate significant differences between XY and XX males in the Kou population. However, the number of soft rays on the dorsal fin (dedicated short-range communications [DFSRC]) and the number of scales on the upper lateral line were significantly lower in XY males from the Kou population compared to XX males from the Tengrela population (p < 0.05).
Mean values in the same line followed by different superscript letters indicate significant difference at 5% level.
TL, total length; SL, standard length; HH, head height; HL, head length; SnL, snout length; ED, eye diameter; PrDD, pre-dorsal distance; PrAD, pre-anal distance; PrPcD, pre-pectoral distance; PrPeD, pre-pelvic distance; DFBL, dorsal fin base length; AFBL, anal fin base length; DPD, dorso-peduncular distance; PeAD, pelvic anal distance; PAD, peduncle-anal distance; CPH, caudal peduncle height; PcPeD, pectoral-pelvic distance; PcAD, pectoral-anal distance; PcOD, pectoral-orbit distance; DAD, dorso-anal distance; PcPeH, pectoral-pelvic height; BH, body height; FSR, first spine ray height of anal fin; PePeD, pelvic-pelvic distance; IOD, inter-orbital diameter.
Similar to the meristic variables, the mean values of the GSI (Table 7) did not show significant differences between XY and XX males in the Kou population. However, the mean values of both indices were significantly lower (p < 0.001) in XY males from the Kou population compared to XX males from the Tengrela population (Table 8).
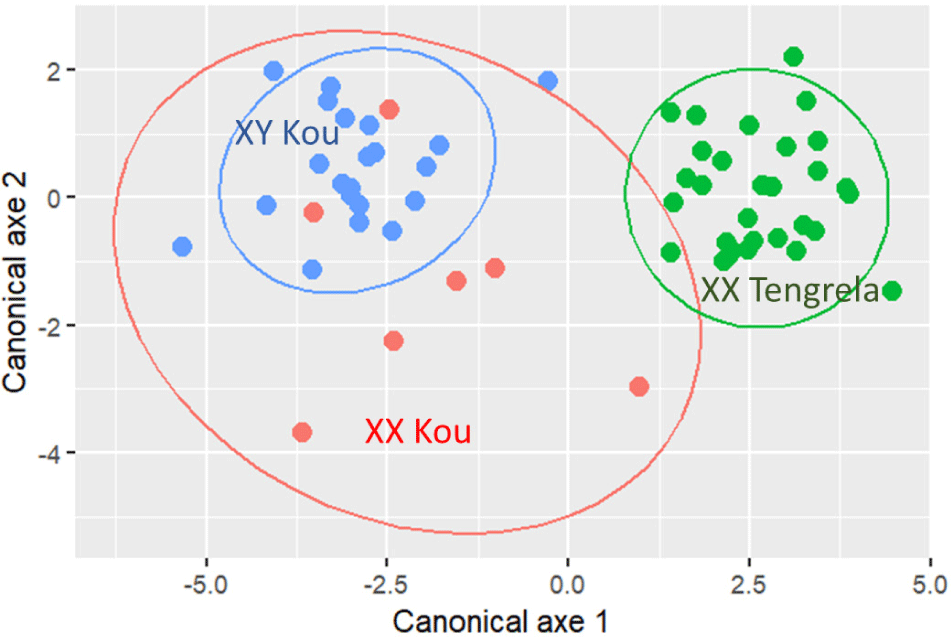
The two-dimensional factorial plane formed by Dim 1 and Dim 2 accounted for 51.4% of the total variance in the PCA. This plane was thus selected for the projection of variables and individuals (Fig. 4A and 4B). The Dim 1 (32.7% of total inertia) was primarily influenced by the HSI, PrPeD, PcPeD, pectoral-pelvic height (PcPeH), TL, and GSI. The Dim 2 (18.7% of total inertia) was mainly shaped by IOD, PrPcD, ED, PcPeD, and HH.
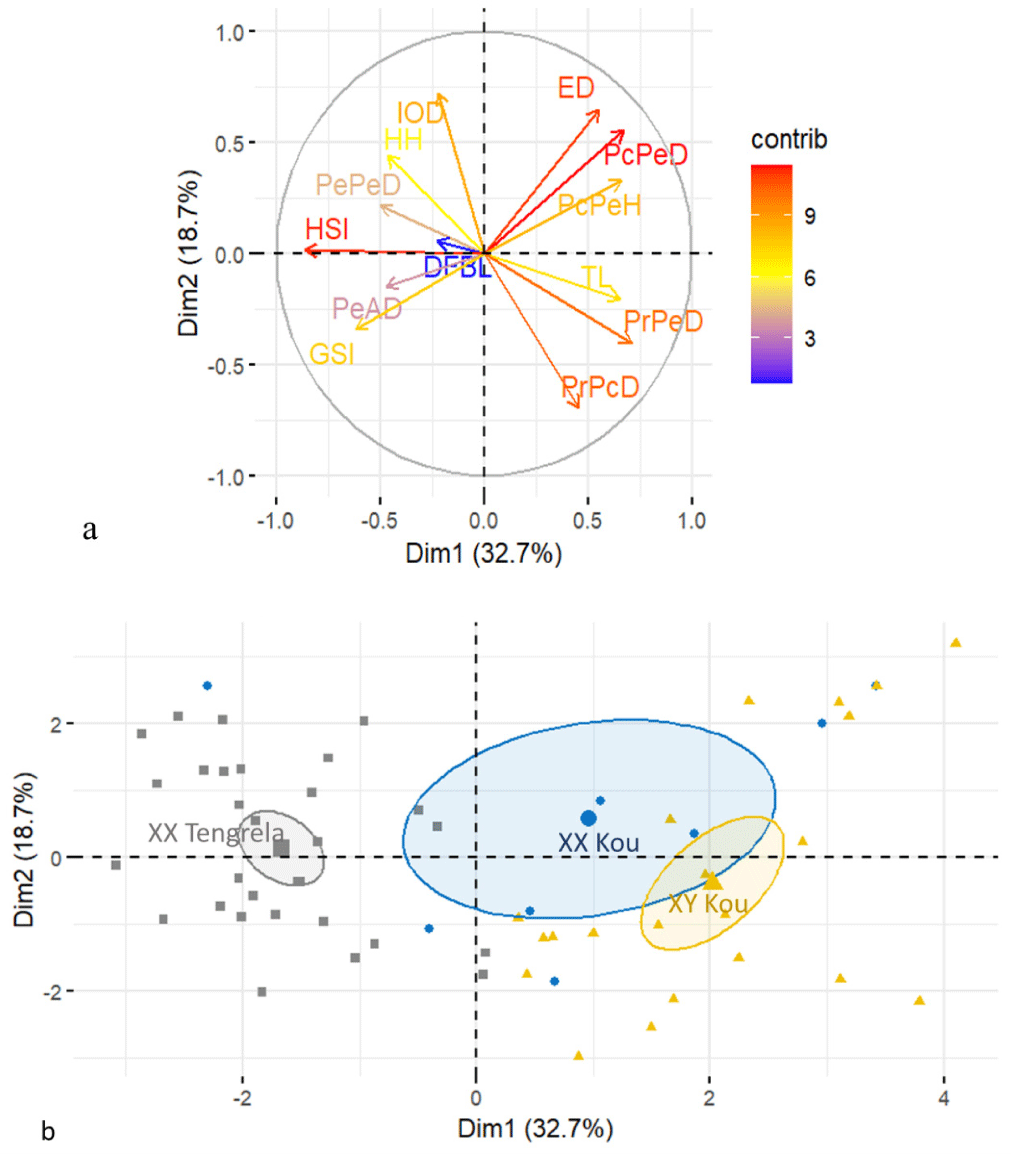
The projection of individuals on Dim 1 and Dim 2 revealed two distinct groups along Dimension 1. The first group, consisting of XX males from Tengrela, was relatively homogeneous and clustered toward the negative coordinates of this axis. These individuals were positively correlated with HSI, GSI, scales of the lateral lin (SULLC), IOD, and HH. The second group, comprising XY and XX males from the Kou population, was distributed along the positive coordinates of Axis 1 and showed a high degree of dispersion. The PCA did not reveal clear discrimination between XX and XY males from the Kou population, but some individuals (positioned toward the positive coordinates of Dim 2) formed a distinct subgroup. These individuals were positively correlated with ED, PcPeD, and PcPeH.
The ordination of individuals on the first two canonical axes of the DFA also confirms the discrimination between males of the Kou population and those of the Tengrela population (Fig. 5). The XX Tengrela males are distributed in the positive part of Axis 1 while the XX and XY males of the Kou population are distributed in the negative part of this axis.
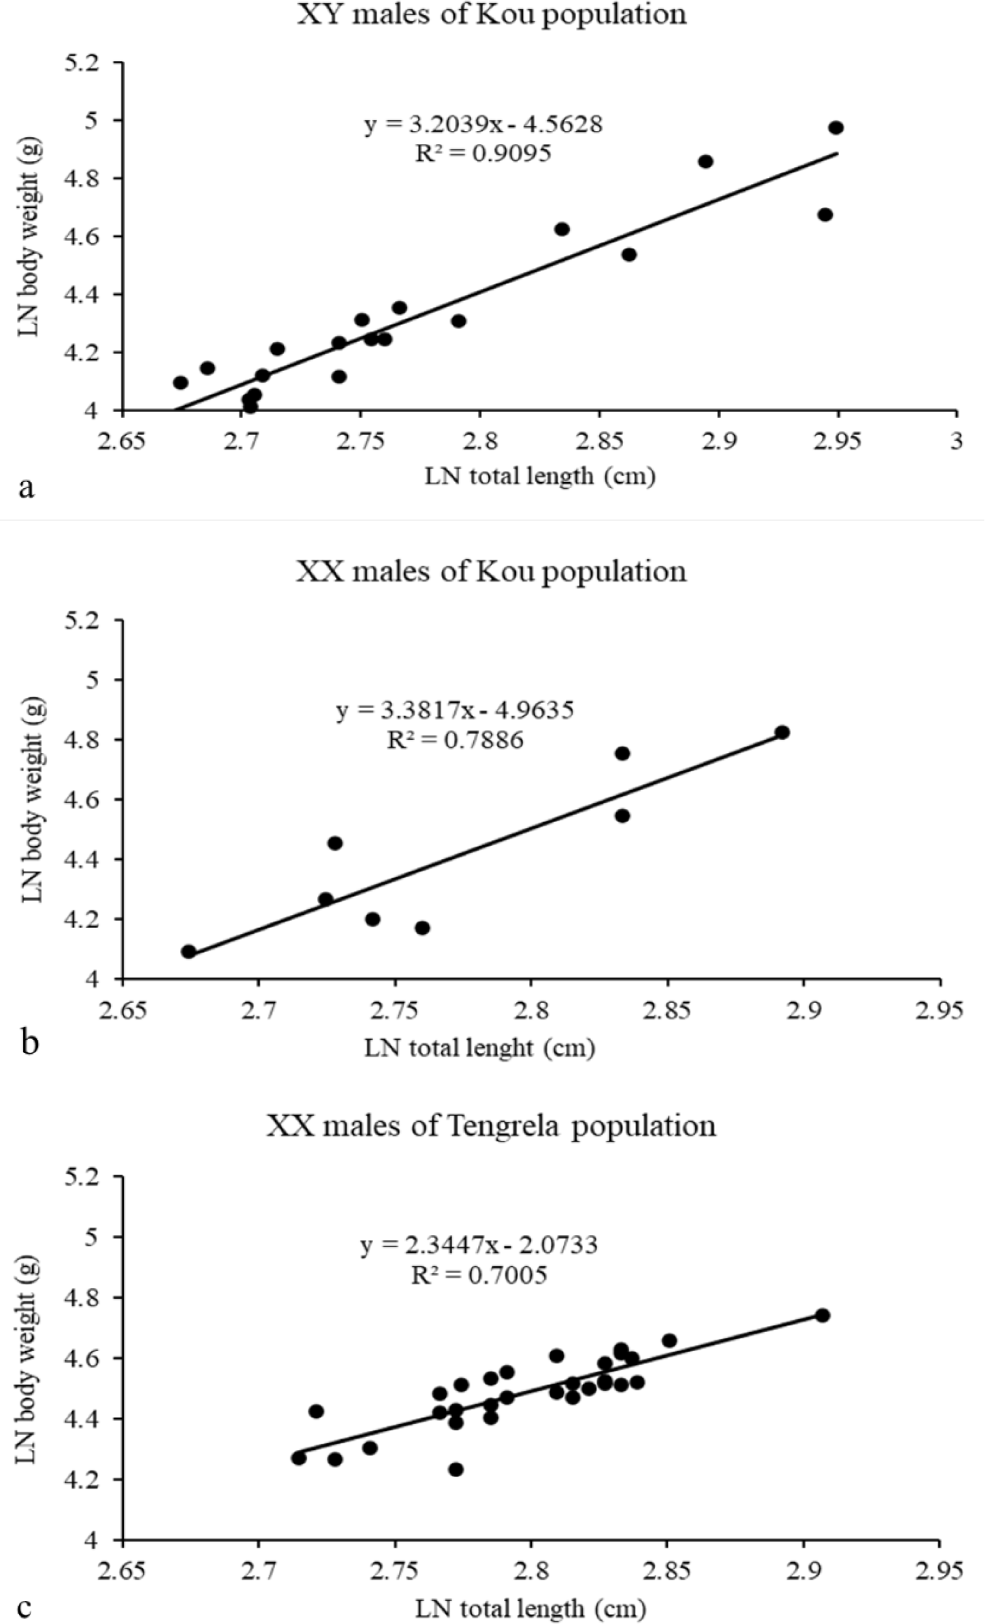
The a and b parameters of the length-weight relationships for XY and XX males from the Kou and Tengrela populations are summarized in Table 9. These parameters were derived from the regression curves shown in Fig. 6A–6C. All regressions were highly significant, with a coefficient of determination (R2) between 0.70 and 0.90. The allometric coefficient (b) was greater than 3 for XX and XY males from the Kou population, indicating positive allometric growth. The coefficient was less than 3 for XX males from the Tengrela population, suggesting negative allometric growth in these males.
Discussion
Morphological parameters, including metric and meristic variables, have been widely used for intra-and inter-population discrimination of different teleost species (Adedeji et al., 2024; Ben Labidi et al., 2021; Boussou et al., 2024; Fagbuaro et al., 2015; Jawad et al., 2022; Solomon et al., 2015). In our study, the univariate analysis (ANOVA) reveals morphological differences between XY and XX males within the same population (Kou population) or between the two populations (Kou and Tengrela populations). The metric variables showing highly significant (p < 0.01) differences (HH, ED, PrPcD, PrPeD, DFBL, PeAD, PcPeD, PcPeH, PePeD, IOD, TL) are mainly distributed in the head and fins. The meristic variables, namely SULLC and weight indices (GSI and HSI), also revealed highly significant differences (p < 0.01) between XY and XX males. These morphological differences may arise from sexual genotype effects or ecological conditions at the study sites.
Indeed, since the genetic males of the Kou population are subject to the same environmental conditions, the morphological differences could be attributed to the sexual genotype of these males. Morphological differences within populations reflect physiological or reproductive adaptations, such as the need to defend a territory, dig a nest, or attract females (El-Zaeem et al., 2012; Salinas et al., 2022). Sexual inversions affect brain expression in reversed Nile tilapia individuals (Gennotte et al., 2017), leading to behavioral modifications, including increased aggression in farmed conditions (Gennotte et al., 2017). Such changes in aggressive behavior could likely exist in natural populations, resulting in morphological modifications in XX males particularly to adapt to combat, as Nile tilapia is a territorial species. Indeed, Fleming et al. (1994) reported that in competitive situations, some Atlantic salmon males develop broader heads, giving them an advantage in fights. Salinas et al. (2022) also reported that physiological differences (steroid concentration) between neo-males and normal males of O. mykiss could lead to different phenotypic modifications among these males when exposed to different breeding temperatures. In our study, XX males of Nile tilapia have a greater HH than XY males within the same population, which could hypothetically confer them an advantage in fights. However, an ethological study related to the sexual genotype of genetic males in the natural environment would be interesting to better understand the level of aggressiveness or reproductive behavior of different genetic males.
Moreover, the sexual genotypic difference alone between males cannot explain the morphological differences between XY and XX males in this study. Indeed, PCA did not reveal discrimination between XY and XX males of the Kou population. However, discrimination is observed between males of the two populations. These results could be explained by genetic differences between the Kou and Tengrela populations of Nile tilapia. Indeed, morphological variations are the first indicators of genetic differences within populations (Ikpeme et al., 2017). Lake Kou and Lake Tengrela belong to the Volta and Comoe river basins respectively, and genetic differences between Nile tilapia populations from these two basins have been reported (Lind et al., 2019). These genetic differences could translate into morphological differences between the populations of the two basins. Adedeji et al. (2024) and Boussou et al. (2024) also reported that geographical distribution could be the source of genetic divergences between different populations leading to morphological divergences in Nile tilapia.
Also, the results of the genotypic sex ratio could also confirm this divergence between these two populations. Indeed, the genotypic sex ratio shows the presence of 26.33% XX males in the Kou population, which is similar to that obtained by Sissao et al. (2019) in the same lake. On the other hand, in Lake Tengrela, the sex ratio was 100% XX males with the amh gene markers. These unexpected results in Lake Tengrela highlight the complexity of sex determination in wild Nile tilapia populations as previously reported by Sissao et al. (2019) and Triay et al. (2020). Indeed, we performed genotyping based on the polymorphism of the amh gene while this polymorphism does not exist in some populations such as the KoKa population of Ethiopia (Triay et al., 2020). This could be the case for the Tengrela population where the absence of polymorphism of the amh gene on the Y chromosome does not allow the amplification of amh∆Y and amhY. Furthermore, environmental factors such as temperature or xenobiotics (from fields located near the lake) could also be at the origin of the sexual inversions (Bezault et al., 2007; Brown et al., 2015; Sissao et al., 2019) that resulted in these XX males in this population. These two plausible hypotheses that could explain these results would deserve to be refined in the context of specific work on the sex determinism of Tengrela population.
Furthermore, PCA reveals significant heterogeneity among males in the Kou population. These results could be explained by a possible mixture of multiple wild Nile tilapia populations and/or the unintentional introduction of domesticated strains into Lake Kou. Lake Kou is interconnected with the tributaries of the Mouhoun River, and these interconnections may have led to the mixing of different populations in this lake. Previous studies reported that interconnections between the Nile River, Lake Victoria, and Lake Kyoga were responsible for the population diversity observed in these water bodies (Tibihika et al., 2023). Additionally, significant introductions of domesticated strains have been made near Lake Kou for aquaculture purposes, and a possible contamination of wild genetic material by these strains could explain this heterogeneity. Indeed, Tibihika et al. (2020) reported that voluntary or involuntary introductions (escapes) of domesticated Nile tilapia strains into Lake Victoria could be one of the causes of population heterogeneity in this lake. Such mixing between wild and domesticated populations has harmful genetic consequences, as it can lead to genetic introgression (Tibihika et al., 2020) and result in the loss of alleles adapted to local conditions (Roberts et al., 2010). The ability of Nile tilapia to form interspecific hybrids may also be one of the causes of morphological divergences within natural populations (Tibihika et al., 2023). However, an inventory of the different tilapia species in Lake Kou and an assessment of their ability to hybridize with Nile tilapia would be necessary to verify this hypothesis.
The estimation of the length-weight relationship provides information on fish growth and the environmental factors that may influence it (Kwikiriza et al., 2023). When the allometric coefficient (b) equals three (3), body growth is proportional to length (isometric growth) (Asmamaw & Tessema, 2021; Coulibaly, 2008; Kwikiriza et al., 2023; Minoungou et al., 2020). In our study, XX and XY males of the Kou population exhibit positive allometric growth (b greater than 3), indicating that these fish gain weight as they grow in length (Asmamaw & Tessema, 2021; Coulibaly, 2008; Kwikiriza et al., 2023; Minoungou et al., 2020). Conversely, XX males of the Tengrela population show negative allometric growth (b less than 3), revealing that these fish become increasingly slender as they grow in length (Coulibaly, 2008; Kwikiriza et al., 2023; Minoungou et al., 2020). Our results therefore reveal allometric growth differences between the two populations, regardless of sexual genotypes. These findings support previous studies that reported that the length-weight relationship provides more insight into ecological conditions and is significantly influenced by environmental variations or anthropogenic factors (Asmamaw & Tessema, 2021; Kwikiriza et al., 2023; Minoungou et al., 2020). The negative allometric growth observed in the Tengrela population could be explained by a recent deterioration of ecological conditions in this lake due to overfishing which is a potential factor needing further investigation. According to local fishermen, overfishing is increasingly observed in the lake due to the arrival of displaced populations, some of whom have turned to fishing. This could also justify why these males have the highest reproductive indices (gonado-somatic and hepato-somatic indices), as under difficult conditions (food availability, pollution) Nile tilapia prioritizes reproduction over growth (Toguyeni et al., 2002). Similar findings were reported in the Samendeni dam in Burkina Faso, where nighttime poaching led to negative allometric growth in Nile tilapia (Minoungou et al., 2020). Montchowui et al. (2009) also reported that the allometric coefficient value was low in ecosystems degraded by overexploitation of fish resources. These results highlight the need to preserve the Nile tilapia population in Lake Tengrela, which seems to be less genetically introverted.
Conclusion
This study aimed to conduct a morphological characterization of the genetic males from the natural populations of Lake Kou and Tengrela using metric, meristic, and weight-related variables. The results revealed, for the first time, intra- and inter-population morphological differences between XX and XY males of Nile tilapia in their natural environment. The males from both populations were found to be morphologically distinct. The males from the Kou population exhibited significant morphological heterogeneity, likely due to hybridization with wild populations or domesticated strains. The Tengrela population appeared to be the least genetically affected, but it seems to be threatened by anthropogenic activities such as overfishing, pollution or habitat degradation. Without immediate conservation measures, the unique genetic diversity of these populations, particularly Tengrela’s, risks irreversible decline. Given the high percentage of XX males observed, further research on major genes of sexual differentiation or how environmental factors (temperature, xenobiotics) influence sex determination in Tengrela’s population is warranted. A study on sex determination in relation to environmental variations would also be necessary for this population, given the high percentage of XX males observed in this study. Overall, these findings highlight the genetic diversity within natural Nile tilapia populations in Burkina Faso and underscore the importance of establishing selection and conservation programs for these populations.