

Introduction
Seaweed is an aquaculture commodity with high economic value and a strategic role in coastal area development. Indonesia is the world’s leading producer of seaweed, contributing more than 50% to the global supply (Basyuni et al., 2024; Kambey et al., 2020). This commodity functions not only as a raw material for the food, pharmaceutical, and cosmetic industries but also contributes substantially to national foreign exchange earnings through export activities (Rathod et al., 2020). In addition, seaweed is a primary source of livelihood for coastal communities, especially in eastern regions of Indonesia such as South Sulawesi, Nusa Tenggara, and Maluku (Adhawati et al., 2024; Hardiana et al., 2024; Rimmer et al., 2021; Spillias et al., 2023). At the national level, the development of seaweed farming aligns with the sustainable development agenda and supports government initiatives aimed at strengthening maritime economic resilience. This commodity holds comparative advantages by utilizing the vast potential of coastal waters, contributing to the improvement of community welfare, and supporting the achievement of the Sustainable Development Goals (SDGs), particularly goals 1 (no poverty), 2 (zero hunger), and 14 (life below water) (Ferreira et al., 2021; Sampantamit et al., 2020).
Nonetheless, seaweed farming in Indonesia faces various challenges. From a biophysical perspective, growth success is heavily influenced by environmental quality, including the availability of nutrients (nitrate [NO3−] and phosphate [PO4³−]), stability of salinity, temperature, water clarity, and carbon dioxide (CO2) content (Bullen et al., 2024; Kelly et al., 2020). Unstable water conditions, such as those around river estuaries or mangrove areas, can reduce thallus growth rates owing to high sedimentation and fluctuating salinity. Conversely, open sea waters are generally more stable and clearer but pose risks, such as strong currents and the presence of harmful organisms.
However, the socio-economic factors of farmers also play an important role. Education level, experience, family dependents, access to capital, and the intensity of extension services all determine farmers’ ability to manage their operations effectively (Aghazadeh et al., 2024). Weaknesses in farmer group institutions, limited market access, and scarce formal financing hamper efforts to increase productivity. Thus, seaweed productivity is influenced not only by the technical aspects of cultivation but also by the socio-economic capacity of coastal communities as the primary actors.
Previous studies have focused more on the biophysical aspects of cultivation, such as water quality, site selection, and maintenance. Meanwhile, studies highlighting the socio-economic dimensions of farmers, including education, experience, access to capital, and the role of institutions, remain relatively limited. The success of seaweed cultivation results from a complex interaction between the ecological conditions of the waters and the socio-economic capacity of the communities managing them (Spillias et al., 2023).
A comprehensive research approach that integrates biophysical and socio-economic analyses within practical management models is. This limitation results in seaweed development strategies tending to be partial, emphasizing only technical or, conversely, only socioeconomic aspects. This study aims to examine the socio-economic characteristics of seaweed farmers in Bone Regency, assess the level of cultivation productivity in various water types (estuary, mangrove area, middle waters, and offshore), and develop a management model appropriate to local environmental and socio-economic conditions. The findings of this study are expected to provide a clearer understanding of the interaction between socioeconomic and biophysical factors in influencing seaweed productivity, as well as practical recommendations to support the development of more competitive and sustainable aquaculture.
Materials and Methods
The research was conducted in Bone Regency from June to October 2025 in South Sulawesi Province (119o42’-120o30’ E and 04o13’-05o06 S), one of the main centers of seaweed production in Indonesia. Three sub-districts were selected as research locations: Awangpone, Tanete Riattang Timur, and Sibulue (Fig. 1).
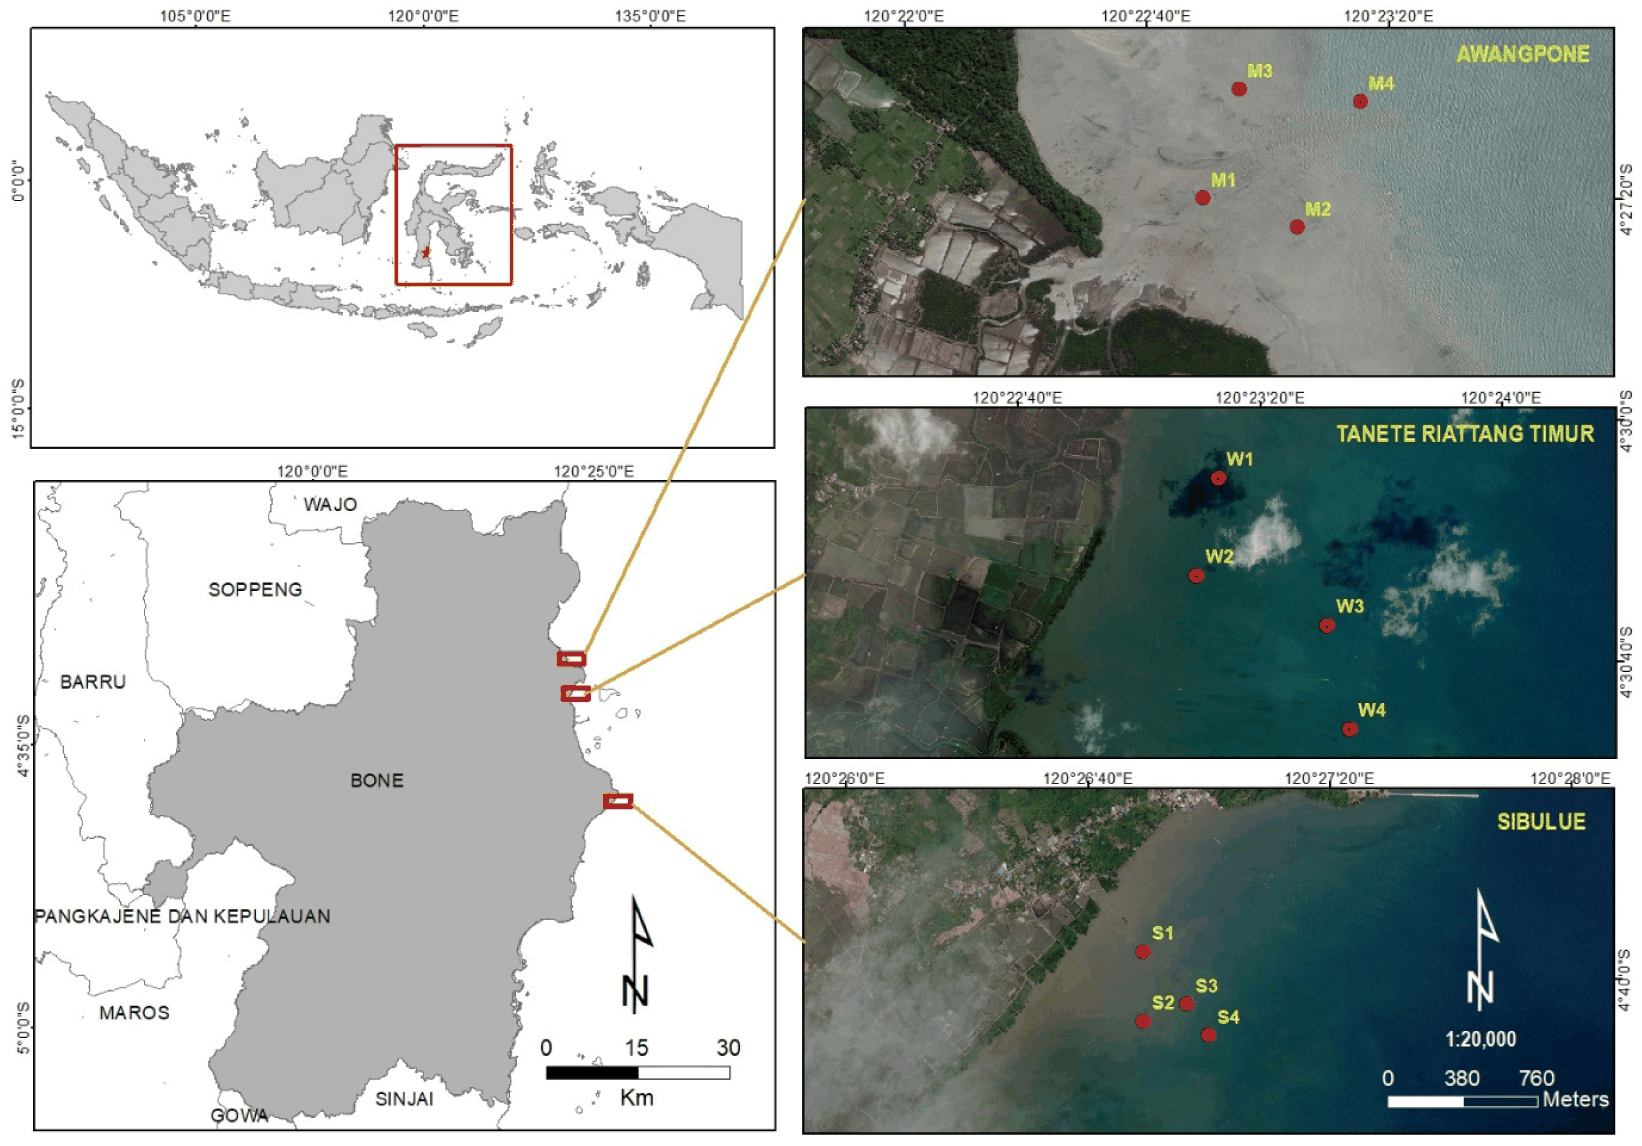
This research was conducted in four different cultivation environments in Bone Regency, South Sulawesi, representing coastal ecological gradients, estuaries, mangrove areas, middle waters, and offshore areas. Estuaries are characterized by high sediment input and salinity fluctuations, mangroves are rich in organic matter and nutrients, middle waters have relatively stable physicochemical conditions, and offshore waters are characterized by higher water clarity but are exposed to hydrodynamic forces and pest organisms. These variations in environmental conditions were chosen to obtain a comparative overview of the influence of water characteristics on the growth performance of seaweed. The species cultivated in this study was Kappaphycus alvarezii.
The study consisted of three phases: (1) preparation stage (June 2025) which includes location identification, sampling design, and preliminary interviews; (2) socio-economic survey stage (July 2025); and (3) main field research stage (August–October 2025) which includes one cultivation cycle for 45 days with growth measurements on days 0, 15, 30, and 45 (harvest), according to the optimal growth phase of K. alvarezii, where biomass increases steadily on days 15 to 45 before the growth rate slows down (Yahya et al., 2024).
This study used two data categories: primary and secondary. The primary data include the socio-economic characteristics of the cultivators, such as age, education, family dependents, farming experience, extension access, and cultivation attributes collected through structured questionnaires and interviews. Biophysical data were obtained through in situmeasurements of NO3−, PO4³−, and CO2. The parameters NO3, PO4, and CO2 were analyzed because these three are the main nutrients and chemical components that directly affect the photosynthesis and growth of K. alvarezii(Narvarte et al., 2025), and site conditions across estuaries, mangroves, middle waters, and offshore habitats.
Seaweed growth data were derived from individual thallus wet-weight measurements on days 0, 15, 30, and 45 to compute absolute growth and specific growth rate (SGR). Secondary data were sourced from the official statistics of Bone Regency and South Sulawesi Province, reports from technical agencies, publications of Statistics Indonesia (BPS), and relevant scientific literature to contextualize and strengthen the analysis.
The study population comprised all seaweed-farming households in three districts (Awangpone, Tanete Riattang Timur, and Sibulue). Socio-economic data were collected using pre-tested structured questionnaires administered via direct interviews. Respondents were selected using purposive sampling, targeting farmers who were actively cultivating during the study period. A total of 204 respondents were included in the study, proportionally distributed across the four cultivation environments. Field observations were conducted over the 45-day cultivation period, including thallus weight measurements and water sampling for nutrient and CO2 analyses. Environmental attributes, such as current velocity, turbidity, and fouling organisms, were documented for contextual assessment.
It was used to describe the socio-economic characteristics of respondents (age, education, number of dependents, experience, extension, and institutions) and the distribution of cultivation ventures. The results are presented as frequencies, percentages, and averages.
SGR calculations were performed using the initial weight (Wo) and final weight (Wt) of the seaweed thallus. Wo and Wt were measured as wet weight in grams. Each thallus was weighed individually before planting and at harvest after 45 days of cultivation.
The strengths·weaknesses·opportunities·threats (SWOT) analysis was conducted to identify internal and external factors influencing seaweed cultivation, with analytical items selected based on empirical field observations, socio-economic survey results, water quality measurements, and supporting evidence from relevant literature. These items were subsequently organized into internal factors analysis summary (IFAS) and external factors analysis summary (EFAS) matrices and plotted to determine the strategic positioning. Strategy prioritization was carried out using the analytical hierarchy process (AHP), in which pairwise comparisons produced weighted priorities (eigenvectors), and model consistency was verified using the consistency ratio (CR < 0.1).
Multiple linear regression was applied to quantify the influence of socio-economic and biophysical variables on seaweed productivity, as this method provides a robust approach for explaining the relationship between the dependent variable (productivity) and multiple predictors.
Multiple linear regression allows researchers to test the significance of variables that play a dominant role and measure their contribution to improving cultivation productivity. This analysis is not only useful for understanding the relationship between technical and socioeconomic factors, but also serves as a foundation for formulating more precisely targeted management strategies.
Results
Based on a survey of 204 respondents, seaweed farmers in Bone Regency display socio-economic characteristics typical of coastal communities. The key demographic variables included age, educational attainment, number of dependents, and farming experience. In addition, socio-economic aspects include cultivators’ access to extension activities (Table 1).
Most seaweed farmers are in their productive age range (30–50 years), representing an active workforce capable of adopting new technology. Their educational attainment is generally low, with the majority having completed only elementary or junior high school, and relatively few possessing secondary or higher education, which is an important factor limiting their technical and managerial capacity. Number of family dependents: on average, there are 3–4 people per household, indicating a considerable economic burden on the household. Farming experience: most respondents had been engaged in cultivation for more than five years, showing practical skills, although not always matched by technological innovation. Extension services: approximately half of the respondents have participated in extension activities, but their frequency and quality are still limited. Institutional factors: although seaweedh seaweed farmer gro been formed,ir roles are not yet optimal in terms of access to capital, marketing, or seed provision.
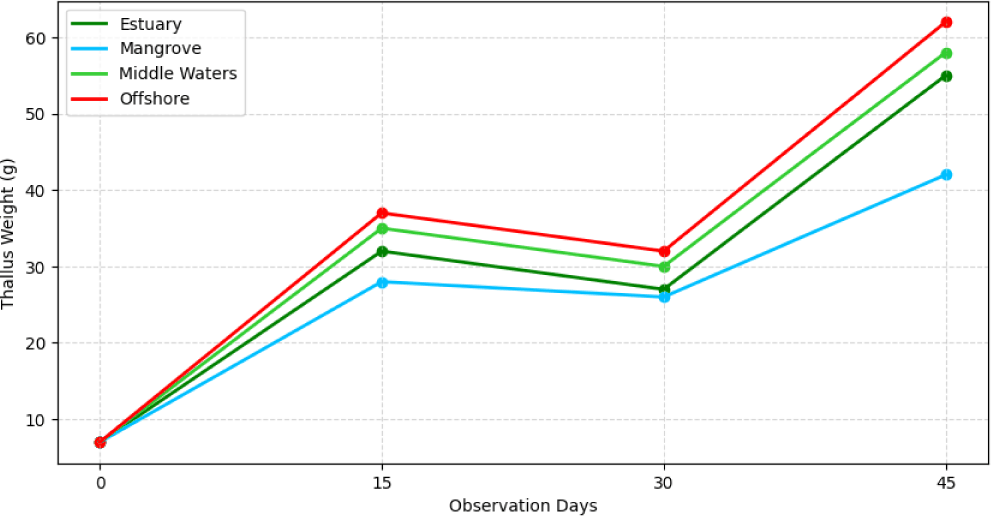
Observations over the 45-day cultivation cycle indicated that thallus growth increased across all locations, although the magnitude and pattern of change differed among sites. From day 0 to day 15, all locations exhibited a marked increase in biomass, with the offshore site showing the highest early growth. Between days 15 and 30, a slight decrease in thallus weight was observed at every site, suggesting a temporary slowdown rather than a continued rapid growth phase. This deviation from the expected pattern highlights the location-specific responses to environmental fluctuations during this period. Growth resumed strongly from day 30 to day 45, with offshore achieving the highest final biomass, followed by midwaters, estuary, and mangrove. Overall, these trends demonstrate that although biomass increases over the full cultivation cycle, the intermediate decline at day 30 indicates that environmental conditions were not uniformly stable, resulting in distinct growth dynamics across the locations. Fig. 2 accurately represents these variations in the data.
The SGR data showed a more diverse pattern across districts than previously described. In Awangpone, offshore areas recorded the highest SGR (4.46%), followed by estuary and middle waters. This pattern aligns with the general assumption that offshore environments provide more optimal conditions for seaweed growth. However, a different pattern was observed in Tanete Riattang Timur, where the highest SGR was found in mid-water areas (3.55%), whereas offshore areas recorded the lowest (2.51%). This indicates that the local environmental conditions in Tanete Riattang Timur influence growth differently than in other districts. Meanwhile, in Sibulue, which has distinctive coastal characteristics, the highest SGR was again found in the middle water (5.16%), surpassing both the estuary (4.11%) and offshore (4.65%) waters. This variation indicates that growth patterns do not always follow the order of offshore, mid-water, mangrove, and estuary but are strongly influenced by the specific ecological conditions of each district. Considering these differences, particularly in Sibulue and Tanete Riattang Timur, statistical analysis is needed to determine whether the differences in SGR between estuarine and offshore locations are significant. However, because the currently available datasets are only averages without replication, formal statistical tests such as analysis of variance (ANOVA) or t-tests cannot be performed on them. Table 2 presents the average SGR values for each district and cultivation site.
Overall, the analysis results show the productivity ranking of the locations as follows, based on SGR: offshore > central waters > mangrove > estuary. These findings emphasize the importance of selecting cultivation sites based on water characteristics. Locations with stable water quality (sufficient nutrients, controlled CO2, and low sediment) tend to yield higher productivity.
To determine the factors that influence seaweed cultivation productivity, multiple linear regression analysis was conducted with the dependent variable being dry yield per cultivation line (kg) (Table 3). The independent variables included age, education, number of dependents, cultivation experience, extension services, cultivation location, and water quality parameters (CO2, NO3, and PO4).
Education (X2) significantly and positively affects productivity. This indicates that the higher the formal education level of cultivators, the better their business management capacity and technology adoption. NO3− (X8) and PO4³− (X9) had significant positive effects, emphasizing the importance of nutrient availability in supporting thallus growth. CO2 (X7) has a significant negative effect, indicating that excessive CO2 levels can disrupt the water pH and reduce the photosynthetic efficiency of seaweed. Other variables, such as age, number of dependents, experience, extension services, and cultivation location, were not statistically significant, although they remained relevant in the socioeconomic context. Thus, increased seaweed cultivation productivity in Bone Regency is largely determined by a combination of socio-economic factors (especially education) and the biophysical conditions of the waters (nutrients and CO2).
The identification of internal and external factors yielded several strengths (S), weaknesses (W), opportunities (O), and threats (T) for the development of seaweed cultivation in Bone Regency (Table 4).
The weighting results of the IFAS matrix (internal factors) and EFAS matrix (external factors) showed an IFAS score of 2.16 (S > W) and an EFAS score of 2.12 (O > T). This position places seaweed cultivation in Bone Regency in quadrant I (aggressive), which means that the development strategy is directed at utilizing internal strengths to seize external opportunities (SO strategy).
AHP was used to determine strategy priorities. Table 5 shows the results of weighting the strategic alternatives for the automotive industry.
| Alternative strategy | Priority weight | Rank |
|---|---|---|
| SO (strength–opportunity) | 0.34 | 1 |
| WO (weakness–opportunity) | 0.28 | 2 |
| ST (strength–threat) | 0.22 | 3 |
| WT (weakness–threat) | 0.16 | 4 |
The CR was below 0.1; therefore, the AHP results were considered valid. Therefore, the SO strategy is the top priority for managing seaweed cultivation in Bone Regency.
Based on the SWOT and AHP analyses, an integrative management model was developed. Fig. 3 shows the integration of socio-economic and biophysical factors of the waters, which is directed towards the SO strategy, thus producing outcomes such as increased productivity, global competitiveness and business sustainability.
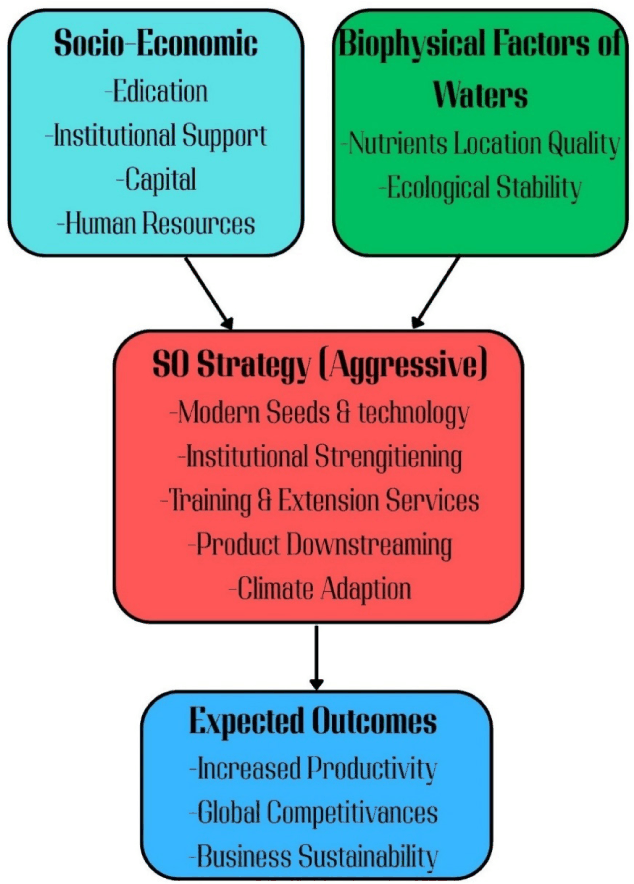
This model emphasizes socio-economic factors: improvement of education, institutional strengthening, access to capital, and enhancement of human resource capacity. Biophysical factors of water bodies: selection of optimal locations, control of CO2 and availability of nutrients (NO3− and PO4³−). SO strategy (aggressive): implementation of superior seeds and modern technology, integrated training, institutional strengthening, downstream product development, and adaptation to climate change. Outcomes: increased productivity, global competitiveness, and guaranteed sustainability of the business.
The recommended SO strategies include (1) improving seed quality and implementing modern cultivation technology, (2) strengthening farmer institutions and improving access to capital and markets, (3) enhancing human resource capacity through integrated training and practical extension programs, and (4) developing post-harvest and downstream products to increase added value. Adapting to climate change and controlling pests and diseases are important.
Discussion
The research shows that the majority of farmers are of productive age (30–50 years) with considerable cultivation experience, but their level of formal education is relatively low (Table 1). This is consistent with the characteristics of seaweed farmers in the coastal areas of Indonesia, where the business is still based on generational experience. Education has been proven to have a significant effect on productivity (Table 3) (Rimmer et al., 2021; Spillias et al., 2023). This strengthens the existing literature, which states that education enhances the ability to adopt technology, manage businesses, and understand sustainable cultivation practices. The low role of institutions and limited access to extension services explain why other socioeconomic variables are not significant (Ehigiamusoe & Samsurijan, 2020; Masanja et al., 2023).
Thallus growth followed a three-phase biological pattern: adaptation (0–15 days), moderate growth (15–30 days), and rapid growth reaching the optimal phase during (30–45 days), as shown in Fig. 2. This pattern was consistent across all locations, although the growth rates differed. Table 2 shows that productivity patterns differed across districts and were not always the highest at offshore locations. In Awangpone, the offshore location recorded the highest SGR (4.46%), whereas in Tanete Riattang Timur, the highest value was found in midwater (3.55%), while the offshore area showed the lowest SGR (2.51%). A similar pattern was observed in Sibulué, where midwater again showed the highest SGR (5.16%), surpassing both estuarine and offshore locations. This variation confirms that productivity is strongly influenced by the specific environmental conditions at each location rather than following a uniform pattern. Middle water and offshore areas generally benefit from more stable hydrological conditions and better water clarity, whereas estuaries and mangrove areas are affected by sediment loads, salinity fluctuations, and higher organic matter content. These spatial differences highlight the importance of interpreting the characteristics of each district when evaluating seaweed growth performance (Lian et al., 2024; Racine et al., 2021; Visch et al., 2023).
The regression analysis in Table 3 shows that education, as well as NO3 and PO4 concentrations, were positively correlated with seaweed productivity, while CO2 concentrations were negatively correlated. This pattern of relationship was not uniform across the survey area, indicating significant spatial variation. The differences in productivity responses across districts confirm that nutrient influences are contextual and are influenced by local environmental characteristics. These findings emphasize the importance of site-based interpretations rather than universally concluding that nutrients are the primary limiting factor. Variability in water stability, hydrodynamics, and organic matter content appears to mediate productivity responses to nutrients, resulting in varying site sensitivities to nutrient availability (Roleda & Hurd, 2019; Xiao et al., 2019). These findings support the existing literature that, besides socioeconomic factors, water quality conditions are also a critical determinant of productivity. Variables such as age, experience, dependents, extension services, and location were not statistically significant. This means that long experience without increased formal capacity does not automatically improve productivity, and non-intensive extension services also have less impact (Kalogiannidis & Syndoukas, 2024; Maake & Antwi, 2022).
The SWOT analysis (Table 4) shows that seaweed cultivation in Bone Regency is positioned in quadrant I (aggressive), meaning that development strategies are directed toward leveraging internal strengths to capture external opportunities (Ghaleb, 2024; Sugumaran et al., 2022). The AHP results (Table 5) confirm that the SO strategy has the highest priority weight (0.34). This strategy emphasizes the application of superior seeds and modern technology, institutional strengthening, enhancement of human resource capacity, downstream product development, and adaptation to climate change. The resulting integrative management model (Fig. 3) combines socio-economic factors (education, institutions, capital, and human resources) with biophysical water factors (nutrients, CO2, and cultivation location). Implementing the SO strategy is expected to increase productivity, strengthen global competitiveness, and at the same time, ensure the sustainability of seaweed farming in Bone Regency.
Conclusion
This study shows that seaweed farmers in Bone Regency are generally in their productive years with adequate experience but still have low formal educational levels. Education has been proven to have a significant positive effect on productivity, whereas other variables do not show a substantial influence. Cultivation productivity displayed a gradual growth pattern, with the best results at offshore and middle water locations with more stable water quality. The SWOT and AHP analyses confirm the need for an integrative management model that combines socio-economic and biophysical water factors to improve productivity, strengthen competitiveness, and ensure the sustainability of seaweed farming.


