

Introduction
Mystus (Scopoli, 1777) is one of the most important genera of catfishes (Teleostei: Bagridae) found in the Brahmaputra drainage system of Northeast India. The three species of bagrid catfishes of the genus Mystus, viz., Mystus cavasius (Hamilton, 1822), Mystus vittatus (Hamilton, 1822) and Mystus tengara (Bloch, 1794) are commercially important as food fishes throughout the region for their nutritionally rich and tasty flesh. Besides, they are also well adapted to captive environment and traded as prominent aquarium fishes along with other catfishes from this part of the globe. These three Mystus spp. are native to the India and other Southeast Asian countries (Pakistan, Bangladesh, Nepal, Sri Lanka, Burma and Thailand).
M. cavasius (Gangetic mystus) is mainly a riverine species, found to inhabit the mighty Brahmaputra, its tributaries and associated streams, while M. vittatus (Striped dwarf catfish) and M. tengara (Tengara mystus) are mostly found in floodplain wetlands or ‘beels’ and other seasonal water bodies like low-lying paddy fields. M. cavasius is known for its grayish, elongated and compressed body with a well-defined mid-lateral longitudinal line while M. vittatus has an elongated and somewhat compressed body shape closely allied with M. tengara. Body colouration of M. vittatus varies with age; however, it generally has a silvery gray to golden colour with five longitudinal stripes. On the other hand, colouration pattern of M. tengara has a greenish to bright yellow colour with 4 to 5 wavy dark brown to green-black longitudinal stripes. The young of M. vittatus and adults of M. tengara are often difficult to separate; however, a distinct, dark tympanic spot above the pectoral fin is the characteristic feature of M. tengara, while it is diffused in the case of M. vittatus. M. tengara has longer adipose fins and maxillary barbels as compared to M. vittatus (Darshan et al., 2013). Though all these species have been placed in the Least Concerned (LC) category as per the International Union for Conservation of Nature (IUCN) Red List in the global context (Froese & Pauly, 2025); their wild populations in this region have been declining over the years. Unsustainable modes of exploitation coupled with habitat degradation or alteration contributed heavily towards such a population decline, and it requires better management approaches for enhancing the sustainability of their natural stock.
Adequate knowledge of different biological aspects of a fish species is highly essential for sustainable management of its wild population and in formulating effective conservation strategies for a depleted stock. Length-weight relationships (LWRs) enable effective estimation of fish biomass in given environments. They also allow prediction of fish lengths from weights, thereby supporting assessment of biomass and population growth (Azrita et al., 2024). LWRs of fish species are one such crucial aspect that holds manifold importance in fishery biology and fisheries management, being widely used in studies of fish’s growth and age structure, population dynamics, stock assessment, yield assessment, evaluation of well-being index, as well as other associated life history traits (Ragheb, 2023; Yin et al., 2022). On the other hand, condition factor is an important index primarily used for assessment of the over-all health of a fish at various life stages. The condition factor reflects how the physiological state of a fish species is being affected by the interaction of different abiotic and biotic components of its natural habitat (Le Cren, 1951). Thus, studies on the condition factor of a fish species, both at the individual and population levels, are highly useful for a variety of purposes ranging from depicting fish’s health and resilience to better understanding of their life cycle and sustainable species management.
The Brahmaputra river is a transboundary river and has been considered as the virtual lifeline for the people of Northeast India. The upper reaches of the mighty Brahmaputra along with its tributaries, and associated streams and wetlands in the floodplains provide major habitats for distinctive ichthyofaunal resources, sustaining livelihoods for millions of poor fisher folks (Abujam & Biswas, 2022). Fish species native to this region may have different growth conditions because of some highly variable environmental attributes like occurrence of floods, fluctuating flows, sediment loads and other water quality parameters. Mystus species, being small indigenous freshwater fishes, are likely to be sensitive indicators of ecosystem health and may reflect broader ecological changes. Local communities who depend on these fishes for nutrition and livelihood should know how well the species are doing, to set sustainable catch limits and to understand population size. Despite the study of Kalita et al. (2017) on M. tengara in the northern Brahmaputra valley and Nath et al. (2019) on M. vittatus from central Brahmaputra, there remains little or no published baseline data on the length-weight relationships and condition factors for M. cavasius,especially from the upper Brahmaputra drainage of Assam. In fact, there is no comprehensive dataset that covers these three Mystus spp. (i.e., M. tengara, M. vittatusand M. cavasius) in the same region or across multiple habitat types and seasons. Thus, the present study addresses a significant knowledge gap by generating the first such baseline information on LWRs and condition factors of these three Mystus spp. from the upper Brahmaputra drainage of Northeast India.
Materials and Methods
The present study was conducted in the districts of Dibrugarh and Sivasagar in the upper Brahmaputra valley region (extending between 26.9891° N to 27.4705° N latitude and 94.6394° E to 94.9125° E longitudes) in the state of Assam, Northeast India. A drainage map of the study area showing the stretch of the Brahmaputra, its major tributaries, viz., Burhidihing (in Dibrugarh district), Dikhow and Disang (in Sivasagar district) and the major floodplain wetlands (Maijan, Lorua, Borbeel, Merbeel in Dibrugarh district and Panidihing in Sivasagar district) are given in Fig. 1.
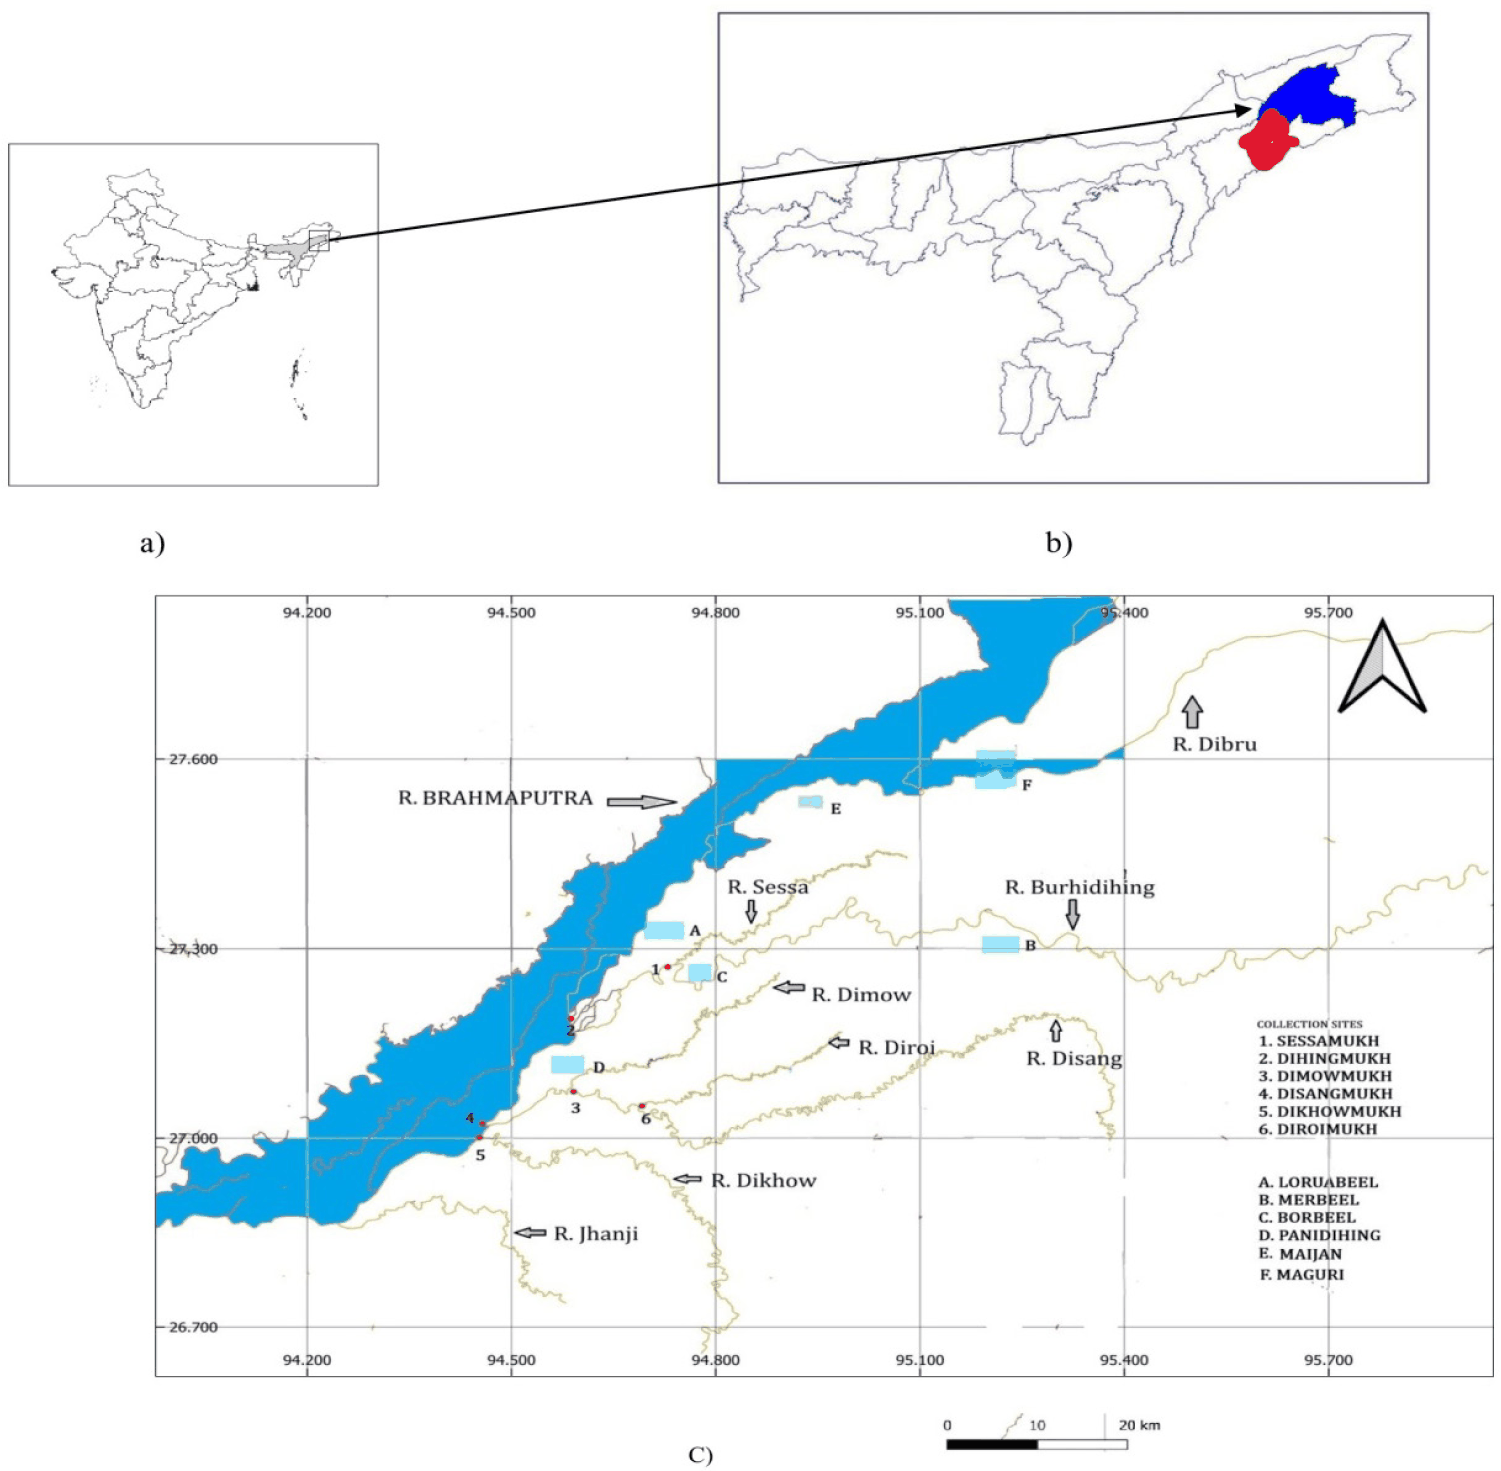
The study was carried out for over a period of 13 months, from June 2024 to July 2025.
During the course of study, a total of 885 individuals comprising M. cavasius, M. vittatus and M. tengara were collected randomly at monthly intervals from the major commercial fish landing sites (viz., Sessamukh, Dihingmukh, Demowmukh, Disangmukh, Dikhowmukh and Diroimukh), all are located in various river confluences in Dibrugarh and Sivasagar districts of Assam. The local fishermen usually used different types of fishing nets (gill nets, lift nets, cast nets, etc.) having different mesh sizes and indigenous fishing traps to capture the Mystusspp. from riverine as well as wetland habitats of this region. The collected samples were immediately preserved in ice and brought to the laboratory for further studies. All the specimens were identified following available literature (Talwar & Jhingran, 1991).
In the laboratory, after proper identification, the total length (L) and body weight (W) for each individual fish were measured to the nearest 0.1 cm and 0.01 g using a measuring ruler and digital balance, respectively. Each individual specimen was dissected afterward and segregated sex-wise by observing the nature of the gonad. Sex ratios for all the species were obtained, and chi-square analyses (p = 0.05) were done to test the significance of deviation from the 1:1 ratio.
The data thus recorded was used to evaluate the LWR by using the equation W= a Lb, where L is the total length (cm) and W is the body weight (g), and the coefficient ‘a’ and ‘b’ are the intercept and the exponent, respectively. The Linear regression equation is transformed into logarithmic form, log W= log a + b log L (Le Cren, 1951). Linear regression on log-transformed data makes it easier to estimate b accurately and compare across species or conditions. The correlation coefficient (R2) and confidence interval (CI) at 95% for parameters ‘a’ and ‘b’ also were calculated separately for males and females as well as for combined sex in all three species. A two-tailed t-test was performed [t = (b value –3)/standard error of regression slope] to deduce the growth pattern for each species. A ‘b’ value equal to 3 indicates isometric growth, whereas any considerable deviation from 3 indicates allometric growth (i.e., positive growth when b> 3 or negative growth when b < 3).
The relative condition factor was determined using the formula, Kn = W/ (aLb) (Le Cren, 1951), whereas Fulton’s condition factor was estimated using the formula K = (100 × W)/ L3 (Froese, 2006). t-tests (p = 0.05) were performed to analyze the significant differences between sexes for both K and Kn.
Results
The results obtained based on the study of a total of 885 fish individuals of the three species of Mystus spp., viz., M. cavasius, M. vittatusand M. tengara are summarized in Tables 1–4.
During the study period a total of 342 numbers of M. cavasius, 335 numbers of M. vittatus and 208 numbers of M. tengara were collected. M. vittatus and M. tengara show significant female-biased sex ratios of 1:2.68 (M:F) (χ² = 69.52, p < 0.05) and 1:1.97 (χ² = 61.94, p < 0.05), respectively, both strongly deviates from the 1:1 ratio. In contrast, M. cavasius shows male dominance with sex ratio (M:F) of 1:0.70 (χ² = 10.52, p < 0.05) (Table 1).
The observed total length (L)for M. cavasius, M. vittatusand M. tengararanged between 6.5–18, 3.7–11 and 5.2–14 cm as well as the body weight (W) ranged between 2.55–21.61, 0.8–10.39 and 1.73–19.69 g respectively as provided in Table 2.
In the linear LWRs, the intercept ‘a’ varied between 0.0177 (for males of M. cavasius) and 0.0554 (for males of M. vittatus) (Table 2 and Fig. 2). The estimated ‘b’ value for M. cavasius (combined sex) was 2.454 while the same for M. vittatusand M. tengarawere found to be 2.410 and 2.277, respectively with little variation between the sexes. All values of b were well below 3, and CI did not include 3, which indicates negative allometric growth. A high t-test value and extremely low p-value (p < 0.05) confirm that the observed deviation from isometric growth is statistically highly significant. Likewise, the overall value of the coefficient of determination (R2) was found to be 0.768, 0.842 and 0.834 for M. cavasius, M. vittatusand M. tengara, respectively; indicating good fitness in the growth model. The established parabolic equations for combined sexes for M. cavasius, M. vittatus and M. tengara were:
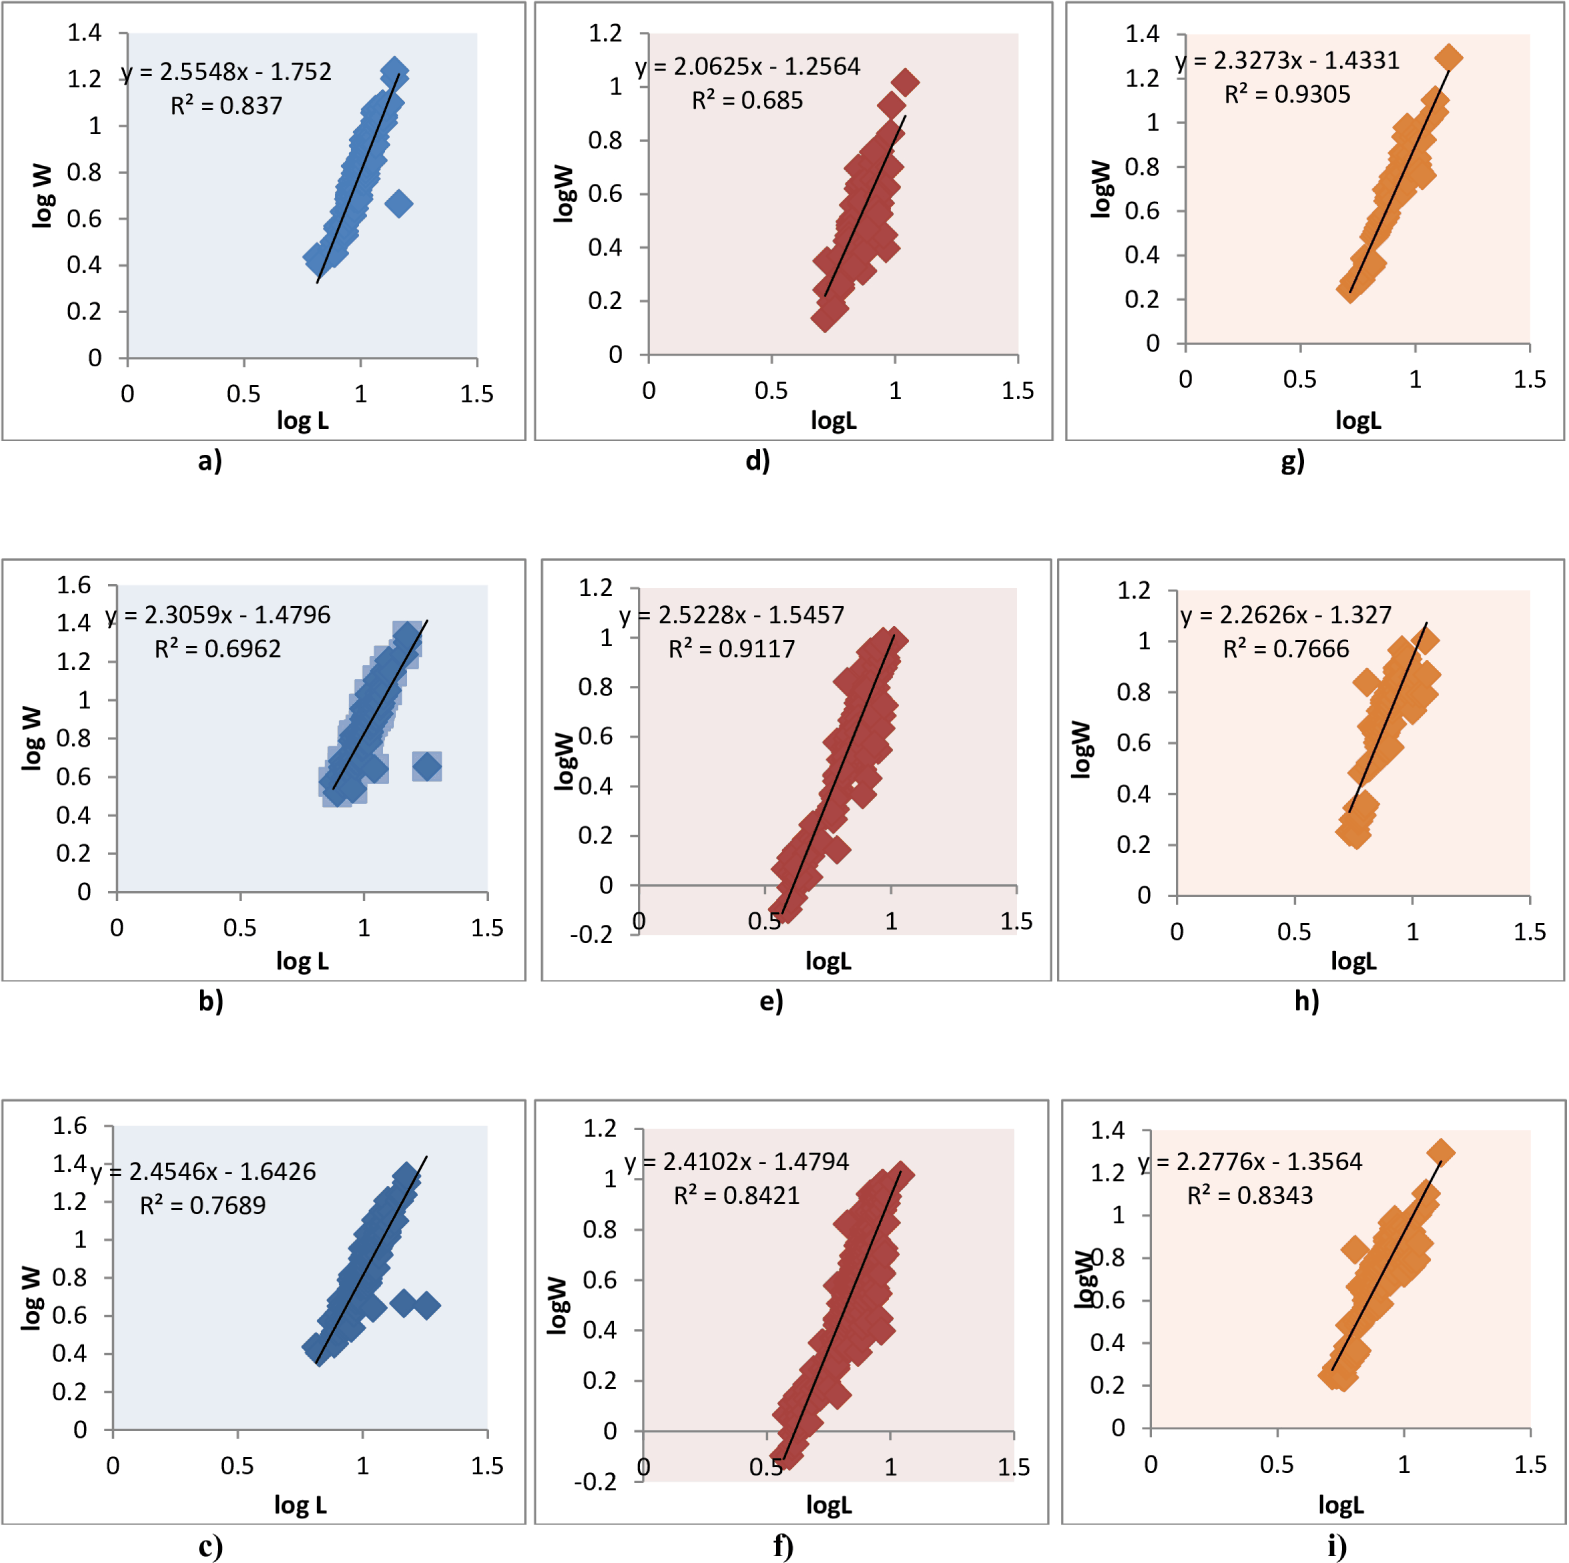
W = 0.0228 L2.454, W= 0.0331 L2.410 and, W = 0.0440 L2.277 respectively.
In addition, the linear regression equation in the form of log W = log a + b log L for the three Mystus species studied also established (Table 3).
Again, mean values for Fulton’s condition factor (K) and relative condition factor (Kn) have been calculated (for both sexes individually and combined) for the three Mystus species during the present study (Table 4). Species-wise the maximum mean ‘K’ value for combined sex was recorded for M. vittatus(1.07 ± 0.258) followed by M. tengara(1.00 ± 0.291) and M. cavasius (0.65 ± 0.872). Likewise, the calculated mean Kn value for the combined sex for these species is found to vary between 1.00 and 1.04. All three species show significantly higher ‘K’ values in females compared to males (p < 0.05 in all cases) indicating better physical condition, likely linked to reproductive development (more gonadal mass in females). However, Kn shows no significant sex difference (p > 0.05), meaning that despite females being heavier for their length, both sexes are close to expected length-weight relationships.
Discussion
During the present study, a comprehensive analysis was carried out on the LWRs and condition factors of three species of Mystus from the upper Brahmaputra drainage, Northeast India. A significant variation of gender distribution (or sex ratio) for all the species was observed throughout the period of study, indicating deviation from the expected ratio of 1:1 (p > 0.05). For M. vittatus and M. tengara, females were found to be dominant, representing about 2/3rd of the population (i.e., 72.83% and 66.34%, respectively, whereas for M. cavasius, males (58.77%) showed dominance over the females in their population (Table 1). In an ideal condition, the sex ratio of male and female in a fish population is expected to be 1:1. However, the sex ratio reported in the present study indicated a considerable dominance of females over males in both M. tengara and M. vittatus. Seasonal habitat preferences and schooling behaviour of mature females and gear selectivity of the local fishermen could be the reason for more abundance of females than their male counterparts. Both these species preferably inhabits weed infested wetlands of the region and are annual breeders, monsoon (July to August) being the peak spawning period coinciding with the heavy rainfall and flood. Following spawning, females used to move in schools and explore the marginal areas of the wetlands for feeding during receding flood, thereby become more susceptible to be caught than the male. Moreover, cast net is the most preferred fishing gear used by the local fishermen in the wetlands particularly during monsoon (July–August) and post-monsoon (September–November). Females, being larger and heavier (with larger gonads) than the males of the same size group during breeding season renders the females of both the Mystus species to be more easily caught by cast net. More abundance of females than males in commercial catch during those periods is likely to be the reason for such a deviation of sex ratio in favour of female. Use of selective gears during fishing and seasonal availability of different length and age groups also reported for unequal gender distribution in population of other Mystussp. (Syafrialdi et al., 2020).
In the present study, for M. cavasius(combined sex), the recorded total length ranged from 6.5 to 18 cm and weights from 2.55 to 21.61g and this range of total length and body weight are lower than some regional maxima but align with natural variability across its distributional range. For instance, Soomro et al. (2015) reported total length range from 7.5 to 23.5 cm in the lower Indus river (Pakistan) while Latif et al. (2018) documented a size range from 5.9 to 17.8 cm in total length and 2 to 42 g in weight.More recently, Das et al. (2025) recorded a maximum total length of 23.2 cm (range 5.1–23.2 cm) for the specimens of M. cavasius sampled from the lower Ganga river (India). Again, Ahirwal et al. (2025) found a maximum length of 20.5 cm and a maximum weight of 52.55 g from the same river in India. The asymptotic length for M. cavasius was estimated at 24.6 cm with a growth coefficient of 0.19 yr–1 in the central Brahmaputra basin of Assam (India), indicating that individuals may reach about 18 cm within 2 years (Nath et al., 2019). Moreover, available reports on M. cavasiusalso suggestthatthe speciesmay attain considerably larger sizes with standard length up to 40 cm (Talwar & Jhingran, 1991) likely represent exceptional or historical records rather than typical specimens of this species.
The maximum total length of M. vittatus recorded during the present study was 11.0 cm with corresponding maximum weight of 10.39 g, which is notably lower than those documented from other parts of India (Chakraborty et al., 2019; Nama et al., 2020; Tripathi et al., 2010; Victor et al., 2014) and the Ganges and Rupsha rivers of Bangladesh (Hossain et al., 2016) except Das et al. (2024) in West Bengal, India. In contrast, findings of the present study are in close accordance with those of Srivastava et al. (2013) from Lucknow (India) who recorded a maximum length and weight of 10.9 cm and 11 g, respectively for this species.
Again, the range of total length, i.e., 5.2–14.0 cm and weight 1.73–19.69 g recorded for M. tengara during the current study surpass the maximum values previously reported by other workers from India (11.7 cm and 14.88 g by Gupta & Banerjee [2013] and 11.56 cm and 12.84 g by Kalita et al. [2017]) and Bangladesh (11.6 cm and 15.1 g by Hossain et al. [2016]; 11.4 cm and 9.6 g by Mitu et al. [2019] and 11.19 cm and 13.67 g by Islam et al. [2024]). Exceptions to these, Talwar & Jhingran (1991) documented a maximum total length of 18 cm while Jana et al. (2022) recorded a maximum length of 17.3 cm and weight of 22.4 g for this species from India.
Fish’s length and weight are two of the most important indices employed for assessment of their growth. In this study, the linear LWRs for the three Mystus species were derived from the logarithmically transformed data of total length and body weight, and all the relevant parameters of the regression equation are shown in Tables 2 and 3, and Fig. 2. The linear LWR of the M. cavasius for both male and female as well as for combined sex shows a negative allometric growth pattern. Likewise, the observed linear LWR for M. vittatus suggests negative allometric growth for the species though variations are there between the male and female of the species. In case of M. tengara too, a negative allometric growth pattern was observed during the present study. Thus, all three Mystus species studied exhibited a negative allometric growth and tended to be thinner with increasing length.
Coefficient ‘a’ is related to body form, which determines the baseline weight of a fish for a given length. When both the sexes are combined together, ‘a’ values recorded in the range of 0.0228 (M. cavasius) to 0.0440 (M. tengara) serve as the baseline scale factors. Combined with the exponent b, they fully characterize the length-weight scaling for each species and sex grouping.
A high R2 value (> 0.8) indicates the LWR model offers a reliable and precise relationship between length and weight, making it useful for biomass estimation and ecological assessment. M. vittatus (0.842) and M. tengara (0.834) indicate a strong fit, suggesting length reliably predicts weight for this species. Such R2values imply relatively uniform growth patterns and limited variability within sampled populations. In contrast, M. cavasius (0.768) indicates a moderate fit, pointing toward more unexplained variability in LWRs. Such variability may be attributed to several interrelated factors. Sampling error arising from differences in fishing gear and time of sampling can significantly influence LWR estimates. During the present study, since the fish samples were captured from both rivers as well as wetland habitats by the local fishermen using different types of fishing gears, it is expected to have such errors. For instance, the use of gear with varying mesh sizes or selectivity depending upon the habitat and time of operation may disproportionately capture individuals of specific size classes, thereby increasing scatter in length-weight data. Additionally, uneven representation of juveniles and adults in the samples can further weaken the strength of the regression. Environmental heterogeneity may also play a crucial role in shaping the observed variability. Lotic or lentic nature of the habitat and differences with respect to other habitat characteristics such as food availability, water depth, current velocity, substratum and physicochemical parameters (e.g., temperature, dissolved oxygen, and nutrient levels) can directly affect growth rates of fish. Biological factors, including intraspecific variability in age structure, sex and reproductive status may further contribute to the moderate R2 value observed for M. cavasius.Overall,the comparatively lower R2 value for M. cavasiuslikely reflects the combined influence of sampling related biases, environmental and biological variability, emphasizing the need for standardized sampling protocols and season specific or habitat specific analyses to improve the predictive strength of LWR models for this species.
The coefficient ‘b’ value generally indicates the overall growth pattern of a fish species. In general, the somatic growth of a fish species follows the cube law and the same can be validated when the fish grows isometrically (when the exponential value or ‘b’ = 3). The observed ‘b’ values of this study shows negative allometry and fall under the usual range between 2 and 4 (Carlander, 1969). Among the three species studied, M. cavasius possesses the highest ‘b’ value (2.454) followed by M. vittatus (2.410) and M. tengara(2.277). Earlier works on M. cavasius reported both isometric growth (Akther et al., 2017; Hossain et al., 2016) and positive allometric growth patterns (Hossain et al., 2012) from other drainages of the subcontinent. However, the findings of the present study (i.e., negative allometric growth) for this species corroborate with the findings of other workers from India (Ahirwal et al., 2025; Nath et al., 2019; Sani et al., 2010), Pakistan (Latif et al., 2018; Muhammad et al., 2017; Soomro et al., 2015) and Bangladesh (Das et al., 2025; Ferdaushy & Alam, 2015) (Table 5).
| Species | Location or drainage | Slope (b) | Growth | References |
|---|---|---|---|---|
| Mystus cavasius | India (Ganga–Yamuna drainage) | 2.91 | A– | Sani et al. (2010) |
| Bangladesh | 3.21 | A+ | Hossain et al. (2012) | |
| Bangladesh | 2.65 | A– | Ferdaushy & Alam (2015) | |
| Pakistan | 2.54 | A– | Soomro et al. (2015) | |
| Bangladesh | 3.10 | I | Hossain et al. (2016) | |
| Bangladesh | 3.07 | I | Akther et al. (2017) | |
| Pakistan | 2.92 | A– | Muhammad et al. (2017) | |
| Pakistan | 2.718 | A– | Latif et al. (2018) | |
| India (Central Brahmaputra valley) | 2.42 | A– | Nath et al. (2019) | |
| India (Ganga drainage) | 2.84 | A– | Ahirwal et al. (2025) | |
| India (lower Ganga drainage) | 2.749 | A– | Das et al. (2025) | |
| Upper Brahmaputra basin, NE India | 2.454 (combined) | A– | Present study | |
| Mystus vittatus | Bangladesh | 3.05 | I | Hossain et al. (2006) |
| India (North India) | 2.992 | A– | Tripathi et al. (2010) | |
| India (North India) | 2.88 | A– | Srivastava et al. (2013) | |
| India (South India) | 2.732 | A– | Victor et al. (2014) | |
| Bangladesh | 2.77 | A– | Hossain et al. (2016) | |
| India (Eastern India) | 1.110–1.564 | A– | Chakraborty et al. (2019) | |
| India (NE India) | 2.997–3.046 | A– to I | Nama et al. (2020) | |
| India (Eastern India) | 2.72–3.12 | A– to I | Das et al. (2024) | |
| Upper Brahmaputra basin, NE India | 2.410 (combined) | A– | Present study | |
| Mystus tengara | India (Eastern India) | 3.07 | I | Gupta & Banerjee (2013) |
| Bangladesh | 2.80 | A– | Hossain et al. (2016) | |
| Bangladesh | 2.36 | A– | Akther et al. (2017) | |
| India (NE India) | 2.07 | A– | Kalita et al. (2017) | |
| Bangladesh | 3.08 | A+ | Mitu et al. (2019) | |
| Bangladesh | 2.70–3.01 | A– to I | Islam et al. (2024) | |
| India (Eastern India) | 2.00–3.29 | A– to A+ | Jana et al. (2022) | |
| Upper Brahmaputra basin, NE India | 2.277 (combined) | A– | Present study |
Again, previous studies on M. vittatus reported negative allometric growth for this species from India (Chakraborty et al., 2019; Srivastava et al., 2013; Tripathi et al., 2010; Victor et al., 2014) and adjacent countries (Hossain et al., 2016). Moreover, the females of this species exhibit higher ‘b’ values than males (Chakraborty et al., 2019; Das et al., 2024; Hossain et al., 2006; Nama et al., 2020). All these reports support the findings of the present study (Table 5).
On the other hand, earlier studies on M, tengara suggested variable growth patterns from this region. Gupta & Banerjee (2013) reported isometric growth, Mitu et al. (2019) and Jana et al. (2022) reported positive allometric growth while Hossain et al. (2016); Akther et al. (2017) and Kalita et al. (2017) observed negative allometric growth pattern from other river basins (Table 5). Many biological, environmental and sampling factors like those of sample size, maturity stages, and season are also responsible for variation of the ‘b’ value in fish species (Carlander, 1969). Physiological stress, unavailability of food, or even the condition of the fish may cause deviation of ‘b’ from its ideal value of 3 and could impact the LWR relationship.
Fulton’s condition factor (K) uses the cube law assumption (w ∝ L3) to infer fish well-being, but because many species grow allometrically, K can become size—dependent and potentially misleading (Wuenschel et al., 2018). In contrast, Le Cren’s relative condition factor (Kn) compares observed weights to expected weights from population-specific length-weight regressions, centering on 1.0 and offering a more reliable, size-adjusted condition index (Eckelbecker et al., 2023). According to Le Cren (1951), the deviation of the relative condition factor value from 1 can provide information about differences in food availability for each fish species. The Fulton condition factor can be used as a comparison of the health status of various fish species in the same habitat because the calculation does not require a and b values. In general, larger fish individuals tend to be in a healthier physiological state. Various biotic and environmental factors such as food availability, reproductive cycle and habitat conditions including variations in water temperature can affect the condition and growth of a fish species (Anene, 2005; Jisr et al., 2018). Analyzing both Fulton’s condition factor (K) and relative condition factor (Kn) reflects both the general condition and the condition relative to the species specific growth trajectory for a fish species and corrects for any length dependent biases in K values. M. vittatus had the highest combined K value (K ≈ 1.07) and consistent Kn values above 1, reflecting that individuals were generally heavier for their lengths and in better condition. Similarly, M. tengara displayed an average condition (K ≈ 1.00) coupled with a strong LWR fit, indicating that its growth conformed well to predicted length-weight scaling. By contrast, M. cavasius showed lower Kvalue (K ≈ 0.65) along with the lowest R2, suggesting more variability in body mass relative to length and potentially indicating less uniform growth and physiological condition among individuals. The calculated mean value of relative condition factor (Kn) fluctuated between 1.01 and 1.04, indicating a state of well-being as well as good growth condition for all the species of Mystusstudied. A value of Kn ≥ 1 implies a state in which individual fish are heavier than predicted for their length, reflecting adequate food resources and favorable living conditions. Conversely, Kn values less than 1 usually suggest that weight is below the expected norm for length, potentially due to suboptimal conditions. Taking into account both the comparison of R2and condition factor values together suggests that species with more predictable LWRs tended to be exhibit better condition, while more scattered in growth patterns was associated with lower condition. This coupling of LWR consistency and condition factor underscores how growth dynamics and body condition reflect both biological characteristics and environmental influences acting on different Mystus populations.
Conclusion
Despite the availability of few reports on LWRs and condition factor of Mystus species from across its distributional range, the findings of the present investigation provide useful baseline information on LWRs and condition factors of the three commercially important Mystus species from this part of the globe, which is otherwise lacking. All these information could be useful in better understanding of different aspects of the overall health, growth and relevant fisheries status of the species studied. Further studies on other eco-biological aspects and life history traits of these species are also suggested for species-specific culture practices, including captive breeding, their sustainable management and region-specific effective conservation initiatives.


