

Introduction
Zooplankton play a crucial role in aquatic ecosystems by mediating energy transfer between primary producers and higher trophic levels, regulating phytoplankton dynamics, and contributing to nutrient cycling (Bakhtiyar et al., 2020; Lomartire et al., 2021). Their community composition and functional structure are highly sensitive to environmental fluctuations, making them valuable bioindicators of ecosystem health and trophic status (Qi et al., 2025).
In West Africa, reservoirs are increasingly affected by anthropogenic pressures such as agriculture, domestic waste discharge, and aquaculture activities, which alter the physicochemical characteristics of the water and subsequently shape planktonic communities (Cecchi et al., 2020; Hamed et al., 2023). Understanding the functional organization of zooplankton under such environmental constraints is therefore essential for assessing ecological stability and the sustainability of reservoir ecosystems (Li et al., 2025). Many studies have examined the taxonomic composition of zooplankton in Ivorian inland waters (Camara et al., 2022; Fofana et al., 2020), but few have focused on their functional group structure and its relationship with environmental variability.
Functional group analysis provides an ecologically meaningful approach to assess community responses to environmental gradients (Thornhill et al., 2018). By grouping species according to shared morphological and trophic traits such as feeding mode, body size, and reproductive strategy, it becomes possible to infer ecosystem functioning and resilience to disturbance (Zhao et al., 2023). In tropical reservoirs, where environmental conditions vary markedly between rainy and dry seasons, functional group dynamics can reveal key ecological processes driving community shifts and energy flow (Ma et al., 2019; Zhu et al., 2025).
Taabo reservoir, located in central Côte d’Ivoire, is a major multipurpose water body supporting hydropower production, fisheries, and local livelihoods (Aliko et al., 2010; Kouassi et al., 2007). Like many tropical reservoirs in West Africa, it is subject to increasing anthropogenic pressures, including agricultural runoff, fish farming, and domestic waste discharge. These pressures, combined with marked seasonal variability, are likely to influence the structure and functioning of planktonic communities. Despite its ecological and socioeconomic importance, knowledge of the functional organization of zooplankton in Taabo reservoir remains limited.
This study aims to (i) analyze the spatio-temporal variations of zooplankton functional groups and (ii) identify the main environmental factors driving their distribution in Taabo reservoir.
Materials and Methods
Taabo reservoir (Fig. 1) is located in central Côte d’Ivoire (6°25’–6°56’ N, 5°07’–5°33’ W). Five sampling sites were selected along a seven-kilometer transect in the open waters of the reservoir. Sites S1 and S5 were located near the shore, while S2 and S4 were situated in the littoral transition zone. Site S3 corresponded to the deepest central area.
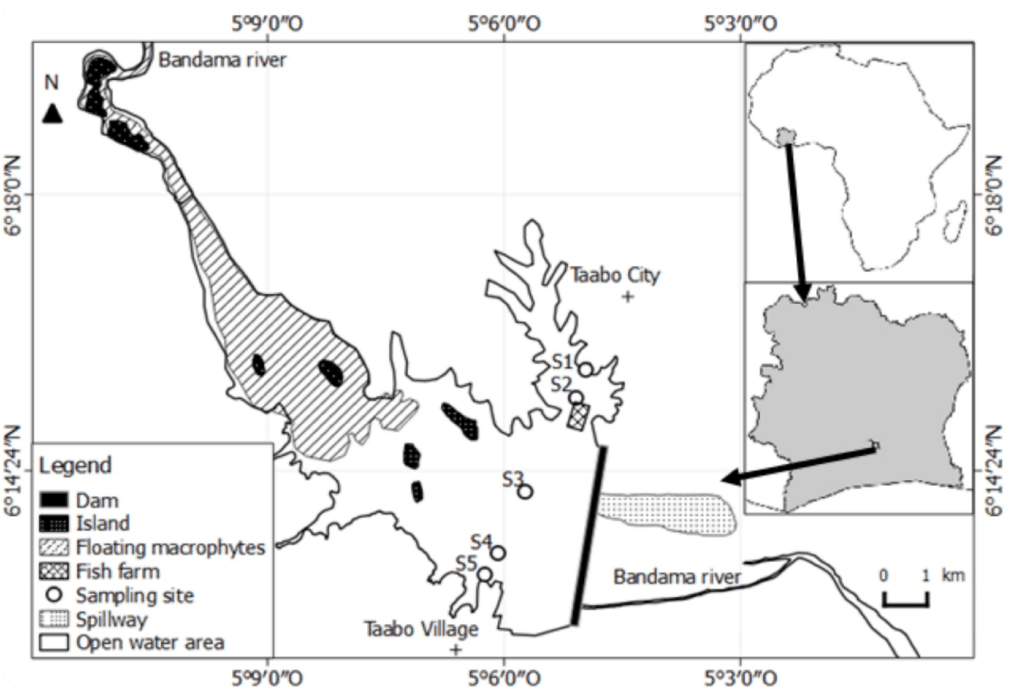
Samples were collected every 45 days from November 2017 to October 2018. Sites S1, S2, and S5 were influenced by anthropogenic activities such as agriculture, domestic waste discharge, and fish farming, whereas S3 and S4 were less impacted. Sampling site characteristics are summarized in Table 1.
Environmental variables measured included water temperature, conductivity, pH, dissolved oxygen (DO), depth, transparency, and nutrient concentrations (total nitrogen [TN] and total phosphorus [TP]).
Water samples were collected at two depths (0.5 and 1 m) using a Van Dorn bottle. Temperature and conductivity were measured using a conductivity meter (WTW COND 340-i, WTW, Weilheim, Germany), while pH was measured using a portable pH meter (HANNA Hi 991001, HANNA Instruments, Seoul, Korea).
DO was measured in situ using a portable oximeter (HANNA Hi 9146, HANNA Instruments) to prevent atmospheric contamination. Water transparency was determined using a Secchi disk (20 cm diameter), and depth was measured using a portable echo sounder (Echotest II, Plastimo, Lorient, France).
Nutrient concentrations were determined using a HACH DR 2010 spectrophotometer (Hach, Loveland, CO, USA) following standard methods (ISO, 2007). TN and TP were analyzed using standard colorimetric procedures.
Zooplankton samples were collected using a vertical haul from 1 m depth to the surface with a plankton net (34 cm diameter, 108 cm length, 20 µm mesh size) at each sampling site. The mesh size was selected to allow the collection of both microzooplankton and mesozooplankton, although smaller organisms may be underestimated.
The volume of filtered water (V) was calculated using the formula:
where r is the radius of the net opening and h is the sampling depth (1 m).
Samples were preserved in 5% formaldehyde solution. Zooplankton identification was performed under a microscope (Zeiss, 400× magnification) using standard taxonomic keys (Dussart, 1980; Pourriot & Francez; 1986; Rey & Saint-Jean, 1980).
For quantitative analysis, three subsamples of 1.5 mL were counted using a Sedgwick–Rafter chamber (100 mL) (Doulka & Kehayias, 2008). Zooplankton biomass was estimated as dry weight (mg) based on length–weight relationships and expressed per unit volume of filtered water (McCauley, 1984; Sun et al., 2010).
Zooplankton functional groups were defined based on mor pholo gical and trophic traits, including body size and feeding mode. Five functional groups were identified: rotifer filter feeders (RF), rotifer carnivores (RC), small copepod and cladoceran filter feeders (SCF; < 0.7 mm), medium copepod and cladoceran carnivores (MCC; 0.7–1.5 mm), medium-sized copepods and filter-feeding cladocerans (MCF), and large copepod and cladoceran carnivores (LCC; > 1.5 mm) (Zhao et al., 2023). Only taxa contributing more than 5% of total zooplankton biomass were included in the functional analysis.
Principal component analysis (PCA) was applied in the present study to ordinate both the sampling sites and months according to the measured environmental parameters. All analyses were conducted using R software (version 3.6.3), employing the ade4, FactoMineR, and factoextra packages to ensure robust statistical treatment and visualization of the data.
Variabilities of biotics and abiotics variables among sampling sites and months were assessed using the non-parametric Kruskal–Wallis test, followed by the Mann–Whitney test. Data normality was verified using the Shapiro test (p > 0.05 for all sites). All analyses were performed in RStudio (R version 3.1.3; R Core Team, 2013) with a significance level set at p < 0.05.
Relationships between zooplankton functional groups and environmental variables were analyzed using RDA. This analysis was performed using a data matrix of zooplankton functional group biomasses. Zooplankton functional group biomasses and environmental variables were log10 (X + 1) transformed prior to analysis. A Monte Carlo permutation test (499 permutations) was performed to identify a subset of environmental variables exerting significant and independent effects on the distribution of zooplankton functional groups (p < 0.05) (Van Tongeren et al., 1992). RDA was conducted using CANOCO 4.5 (Microcomputer Power, Ithaca, Nym USA).
Results
Physical and chemical parameters showed clear spatio-tem poral variations across sampling sites and seasons (Fig. 2). Water temperature was generally higher during the dry season (up to 31°C) and decreased during the rainy season (26.9°C). Conductivity (134 μS cm–1), total nitrogen (0.38 mg L–1), and total phosphorus (0.84 mg L–1) increased during the rainy periods, indicating enhanced nutrient inputs. Dissolved oxygen and pH showed moderate variations among sites.
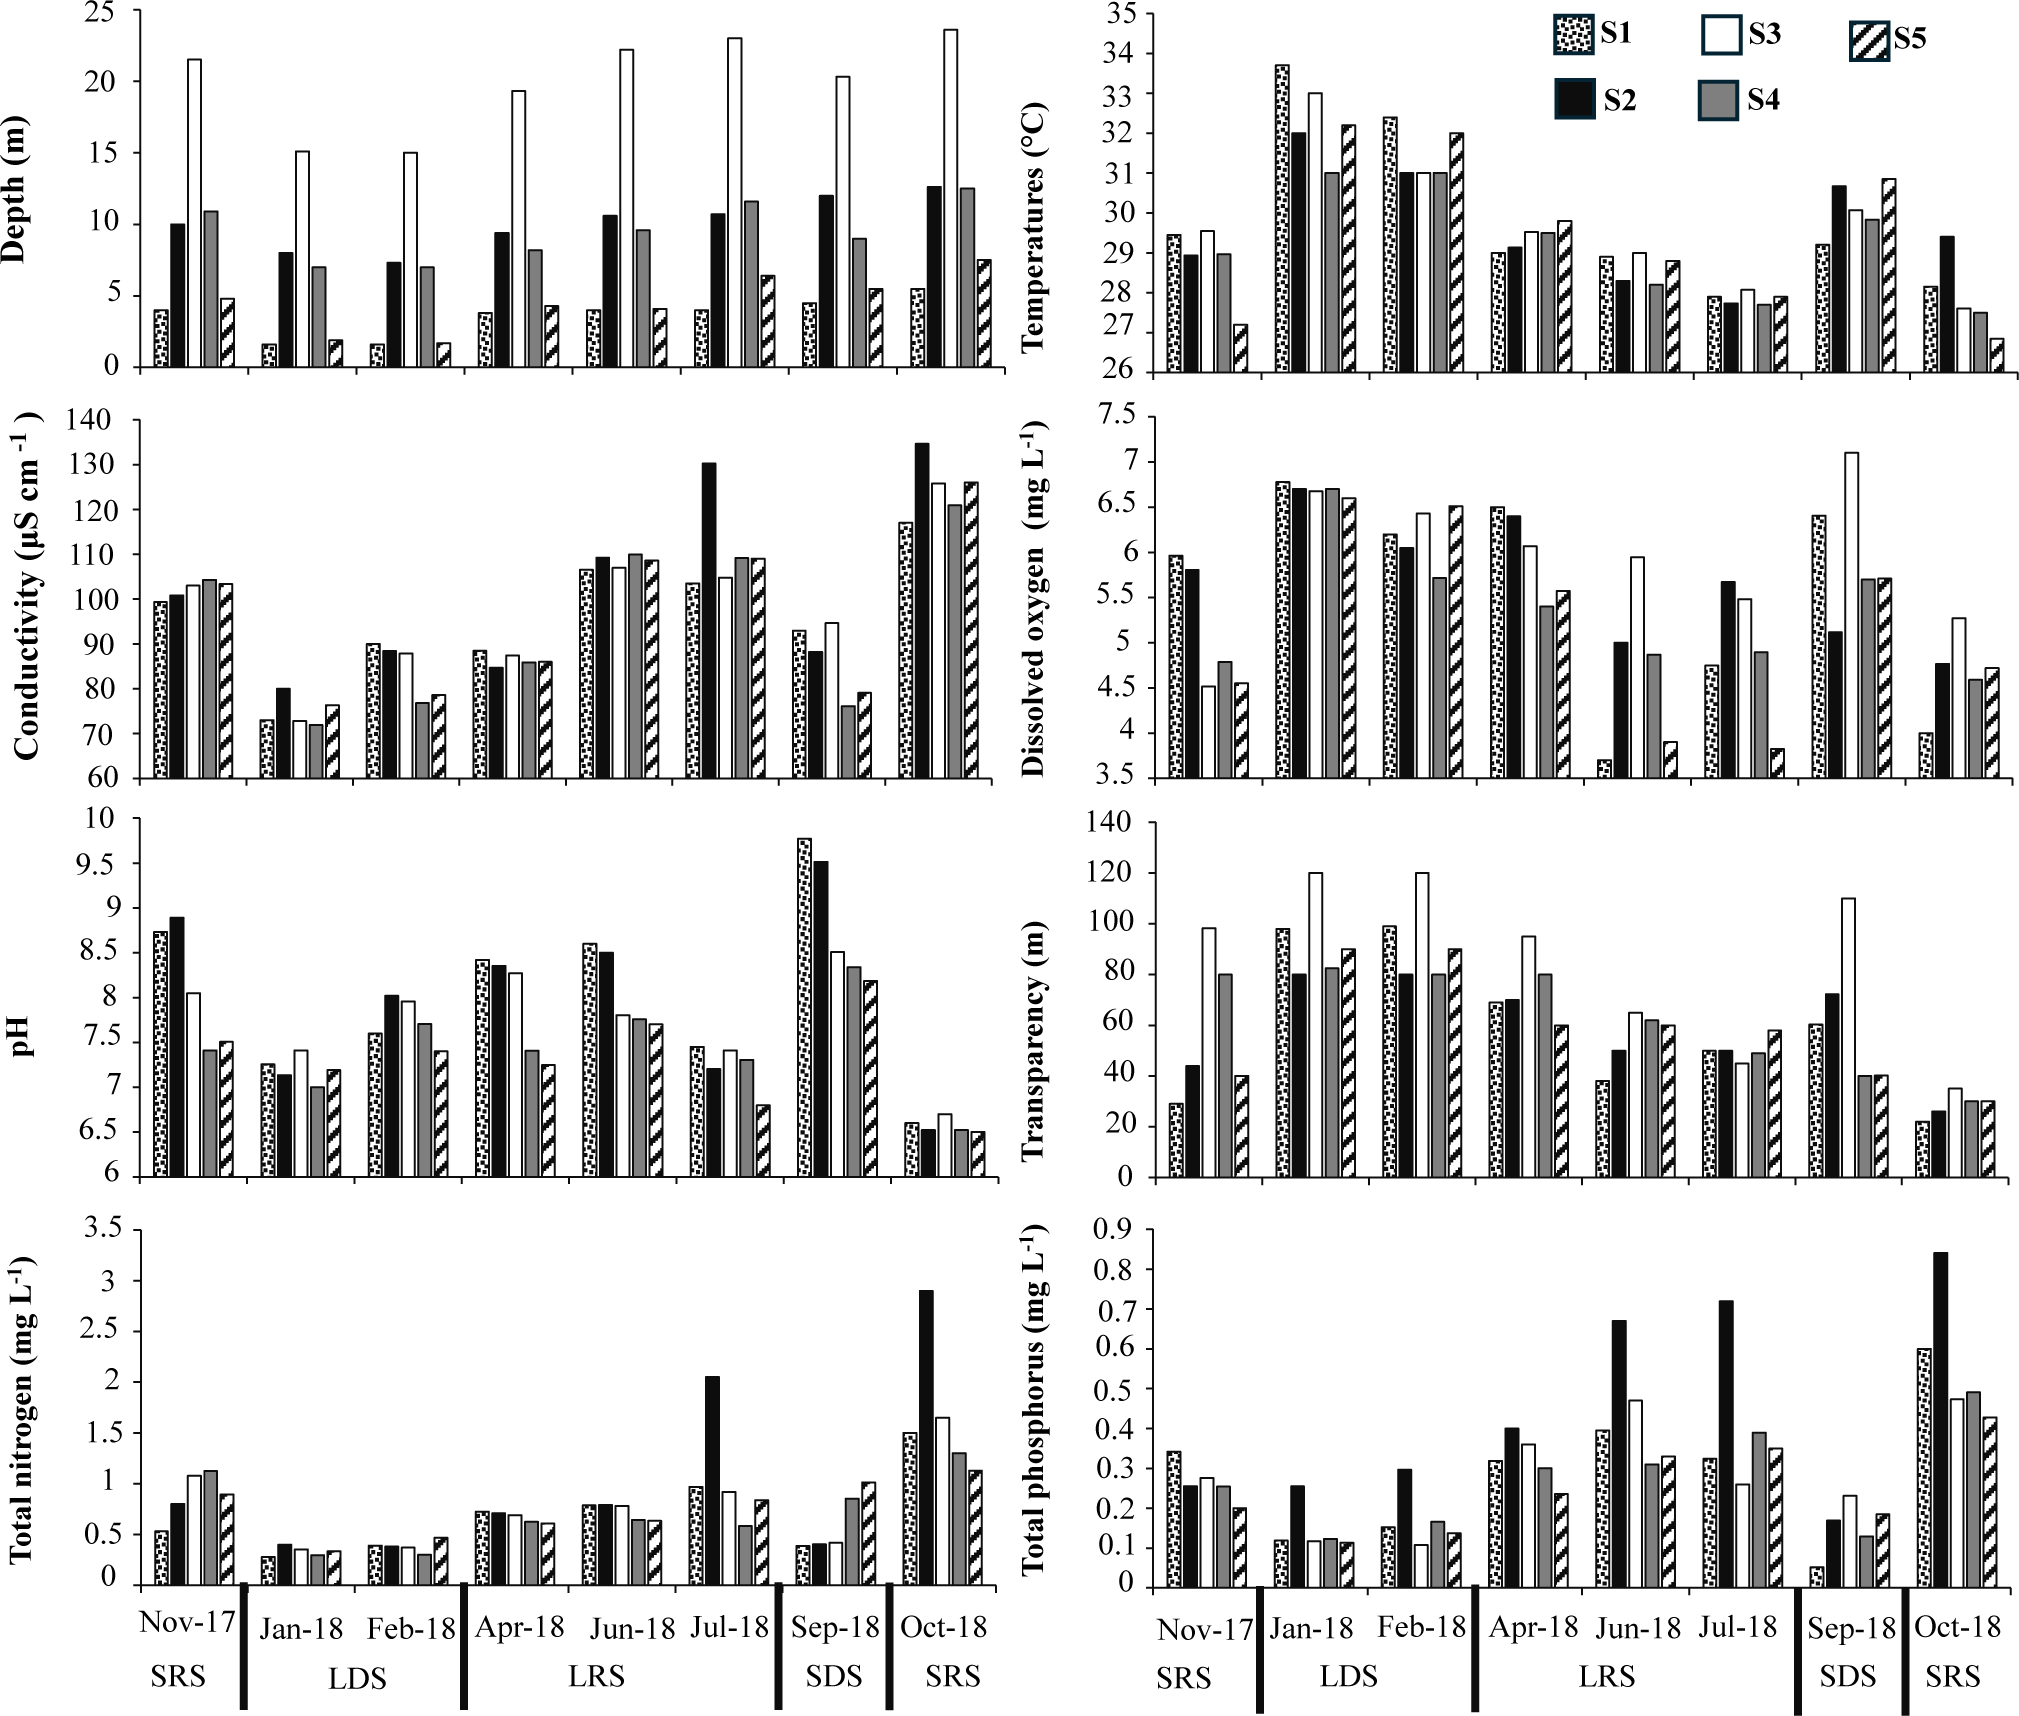
Despite slight variations in depth, no significant differences were observed among sampling sites (Kruskal–Wallis test;p > 0.05), whereas significant seasonal variations were recorded for all parameters (Mann–Whitney test;p < 0.05).
Environmental variables showed clear seasonal variations (Fig. 3). Temperature and transparency were higher during the dry seasons, whereas conductivity, total nitrogen, and total phosphorus increased during the rainy seasons. Dissolved oxygen remained relatively stable across sampling periods.
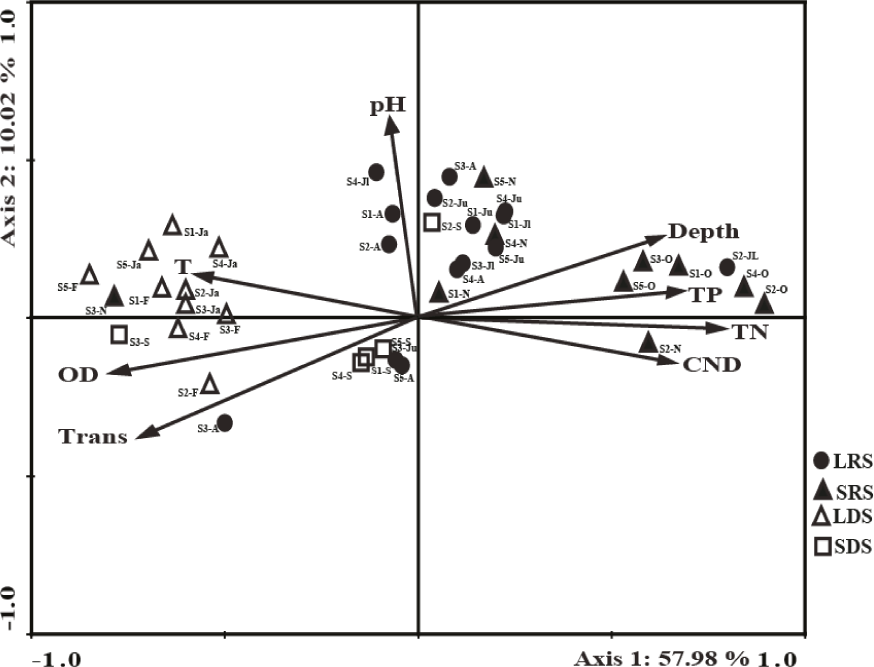
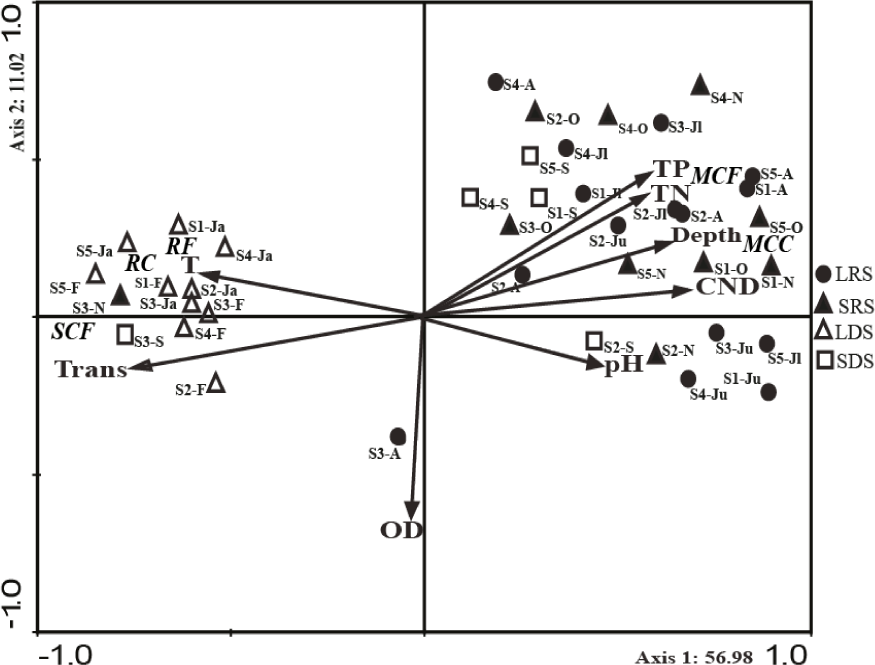
Long dry season (LDS) samples were negatively correlated with Axis 1 and characterized by high values of dissolved oxygen, temperature, and transparency. Samples of the short rainy season (SRS) were associated with the high-water period and were positively correlated with Axis 1. This axis is associated with greatest depth, and higher TP, TN, and conductivity. Long rainy season (LRS) samples were positively correlated with Axis 2 and characterized by high pH. Short dry season samples were located near the origin of both axes, indicating little influence from the measured abiotic parameters.
Qualitative analysis revealed 77 taxa across four groups: Rotifers, Cladocerans, Copepods, and other organisms. Rotifers were the most diverse group, with 59 taxa, followed by Cladocerans (10 taxa), Copepods (5 taxa), and other organisms (3 taxa).
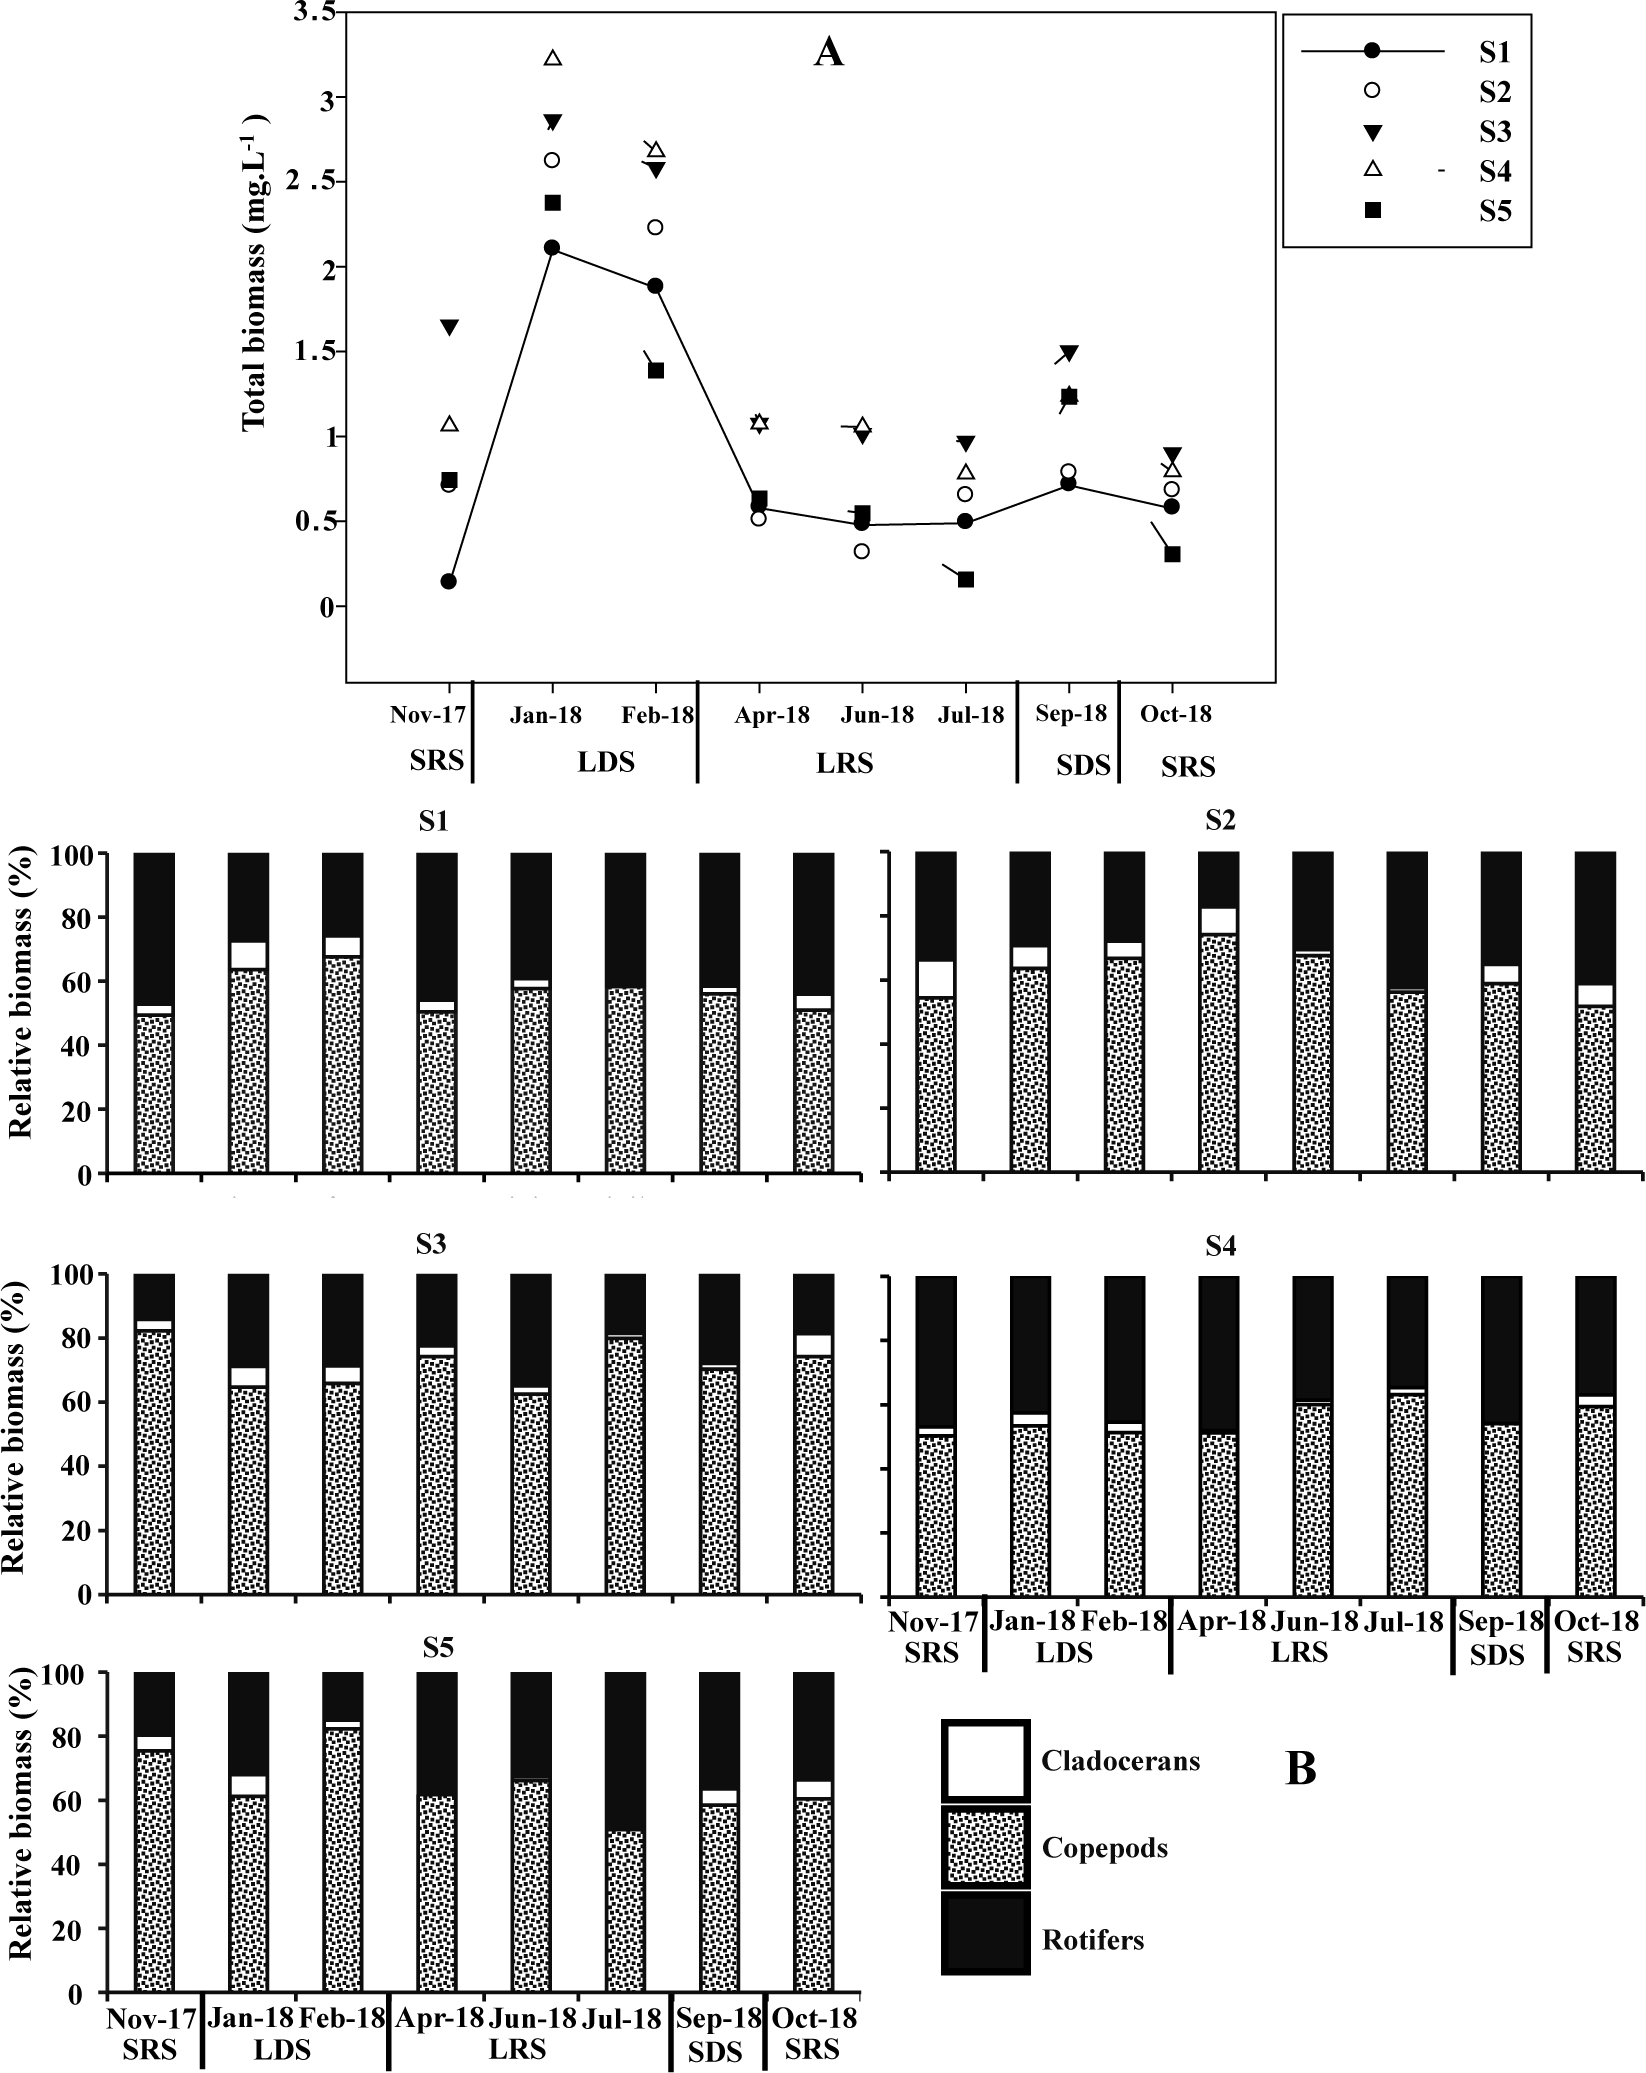
In quantitative analyses of biomass (Fig. 4A), the highest values were recorded at all the sampling sites in January during LDS: S1 (2.10 mg·L–¹), S2 (2.62 mg·L–¹), S3 (2.86 mg·L–¹), S4 (3.21 mg·L–¹), and S5 (2.37 mg·L–¹). The lowest values were observed at S1 (0.13 mg·L–¹) during the high-water period in November (SRS), at S2 (0.31 mg·L–¹) in June (LRS), and at S3 (0.89 mg·L–¹), S4 (0.77 mg·L–¹), and S5 (0.15 mg·L–¹) in July (LRS). Zooplankton biomass were dominated by Copepods at all sites across the different sampling periods (Fig. 4B). The dominance of Copepods was mainly due to Copepodites (16%–25%), Thermocyclops sp. (22%–37%), and Mesocyclops sp. (2%–34.64%). Zooplankton biomass displayed significant spatio-seasonal variability, being higher during the dry season and at site S4 (Mann–Whitney tests;p = 0.035 and p < 0.05, respectively).
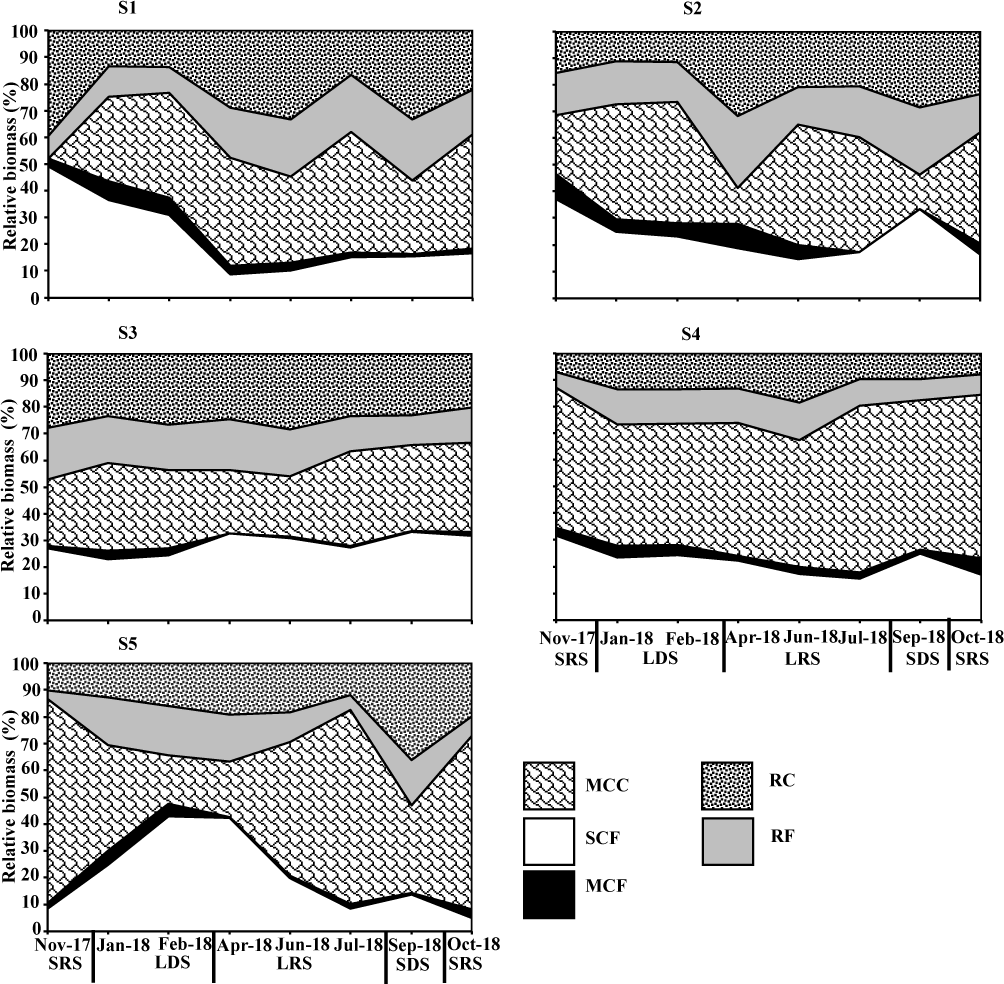
Twenty-seven (27) species accounting for more than 5% of the total biomass were distributed across three taxonomic groups and classified into five functional groups (MCC, MCF, SCF, RC, and RF) (Table 2). Spatial and temporal variations in zooplankton functional groups show MCC dominance throughout the study (Fig. 5). The highest biomass of group MCC were recorded at S1 (45%), S3 (35%), and S4 (62%) during the LRS (July); at S4 (46%) during the LDS (February); and at S5 (75%) during the SRS (November), mainly due to Mesocyclops sp. and Thermocyclops sp. MCC group was followed by group SCF at S1 (49%), S2 (37%), and S4 (31%) during the SRS (November); at S3 (33%) during the LRS (April); and at S5 (43%) during the LDS (February), mainly represented by Copepodites, Nauplii, and Bosmina longirostris. Functional groups RC and RF showed the lowest biomass values. RC group was minimal at S1 (13%) and S2 (10%) during the LDS, and at sites S3 (20%), S4 (8%) and S5 (10%) during the SRS. RF group showed low biomasses across sites, particularly at S1 (8%), S4 (8%), and S5 (7%) during the SRS. The MCF group was less represented at all sites throughout the seasons. The biomass of functional groups were generally higher during the dry seasons than during the rainy seasons (Mann–Whitney test;p < 0.05).
The influence of environmental variables on the biomass of zooplankton functional groups was assessed using RDA. The first two ordination axes explained 68% of the total variance (Fig. 6). Axis 1 (56.98%) delineated a pronounced seasonal gradient, with samples from the rainy season clustering on the positive side and those from the dry season on the negative side. Variables such as conductivity, water depth, pH, TP, and TN, shown strong and positive correlations with this axis. These variables were positively correlated with the biomass of MCC and MCF functional groups. However, water transparency and temperature were negatively associated with Axis 1, and positively related with the biomass of RC, RF, and SCF groups. Dissolved oxygen was negatively correlated with Axis 2 and was not associated with the biomass of zooplankton functional groups.
Discussion
PCA revealed marked seasonal variations in the physicochemical properties of the Taabo reservoir. Samples of the high-water period, particularly in the short rainy season, showed positive correlations with Axis 1 and characterized by high values of water depth, TP, TN, and conductivity. This elevated mineralization likely results from nutrient enrichment, high water levels, and inputs from domestic wastewater, laundry activities, and watershed runoff. Previous studies (Jin et al., 2025; Walton et al., 2024) have underscored the significant impact of anthropogenic activities on lake mineralization during the rainy season.
Copepods were the dominant zooplankton group in Taabo reservoir, with their significance highlighted by cell volume-based biomass estimates rather than density alone. The dominance of copepods may also reflect their competitive advantage under eutrophic conditions, where their omnivorous feeding strategy allows them to exploit a wide range of food resources (Fofana et al., 2020; Magouz et al., 2021; Mermillod-Blondin et al., 2025).
The higher zooplankton biomass observed at site S4 may be explained by reduced hydrodynamic disturbance and lower predation pressure compared to more anthropogenically impacted sites. Similar patterns have been reported in tropical reservoirs where stable habitats promote zooplankton development (Tuan et al., 2025).
Zooplankton exhibited consistent temporal patterns across sampling sites, with higher biomass during the dry season, likely due to more stable environmental conditions. Their life cycles are influenced by temperature, food availability, and photoperiod (Vieira et al., 2022), and community abundance positively correlates with environmental variables (Sobko et al., 2023).
In Taabo Reservoir, zooplankton biomass was dominated by MCC and SCF functional groups due to the ecological traits of their constituent taxa. The MCC group comprises carnivorous zooplankton (Mesocyclops sp. and Thermocyclops sp.) that feed on rotifers, cladocerans, chironomid larvae, and oligochaetes, and are minimally preyed upon by fish (Azani et al., 2023). The SCF group includes filter-feeding zooplankton (copepods and Bosmina longirostris) that consume bacteria, organic detritus, protozoans, and algae (Vieira et al., 2011). The low predation pressure and heterotrophic feeding habits of these groups likely explain their persistence in the reservoir. Moreover, the dominance of Thermocyclops sp., Mesocyclops sp., and Bosmina longirostris indicates a high trophic state of the environment (Beracko et al., 2025).
Canonical redundancy analysis indicated seasonal differentiation of zooplankton functional groups. The dry season was dominated by RC, RF, and SCF groups, likely due to reduced predation from carnivorous copepods and cladocerans, while the rainy season (high-water period) was characterized by MCC and MCF dominance. Increased temperature and water transparency positively influenced Rotifer biomass, consistent with findings from Tibet and Xingkai lakes (Ma et al., 2019). The ubiquity and r-strategy reproduction of Rotifers contribute to their tropical dominance (Zhao et al., 2022), and favorable dry season conditions may promote a more diverse zooplankton assemblage (Adandedjan et al., 2017). These findings support the study objectives by highlighting the key environmental drivers shaping the distribution of zooplankton functional groups in Taabo Reservoir, providing insights for sustainable management.
Conclusion
This study demonstrates that zooplankton functional group distribution in Taabo reservoir is strongly influenced by seasonal variability and environmental gradients. The dominance of copepods and specific functional groups reflects the trophic status and ecological functioning of the reservoir. These findings highlight the importance of functional approaches for understanding ecosystem dynamics and provide a scientific basis for monitoring and sustainable management of tropical reservoirs.


