

Introduction
Fishing has long been one of humanity’s oldest interactions with the ocean, historically conducted in shared-access, open-water systems. Fisheries are classic examples of common-property resources, where overexploitation and depletion occur under conditions of individualistic competition (Gordon, 1954). As the global population approaches 10 billion by 2050, marine systems are projected to provide 12%–25% of the additional edible meat needed, especially through sustainable practices in fisheries and aquaculture (Costello et al., 2020). However, this potential is jeopardized by overfishing, habitat loss, and illegal, unreported, and unregulated (IUU) fishing. In the South China Sea, despite technological advances like the Visible Infrared Imaging Radiometer Suite, Day/Night Band (VIIRS–DNB) and Automatic Identification System/Vessel Monitoring System (AIS/VMS), IUU activities persist (Yu & Liu, 2025).
Building on this global perspective, IUU fishing undermines sovereignty, damages ecosystems, and marginalizes small-scale fishers (Chen & He, 2025). While the FAO (2025) reports that 64.5% of stocks remain within sustainable limits, 35.5%, particularly in deep-sea and shark fisheries, are overexploited. Scholars warn that equating IUU solely with industrial crime ignores the complex realities of informal small-scale fishing. Trade-based anti-IUU measures may unintentionally penalize legitimate but undocumented practices (Auld et al., 2023; Bartlett et al., 2025; Song et al., 2020). Enforcement also remains weak, only 7% of IUU violations were detected in Chile (Oyanedel et al., 2025), prompting calls for smarter monitoring and inclusive governance under the Food and Agriculture Organization of the United Nations (FAO)’s “Blue Transformation” agenda (FAO, 2024).
Given these challenges, small-scale fisheries (SSF), which typically operate in coastal or nearshore waters with small vessels and manual gear, are particularly vulnerable to IUU fishing (Barboza et al., 2024). Globally, an estimated 492 million people depend partly or fully for livelihood on SSF (Basurto et al., 2025). In the Philippines, SSF communities rely heavily on key species such as tuna, sardines, scad, mackerel, and anchovies, which are critical both for local consumption and for national and regional economies through domestic trade and exports (DA–BFAR, 2024; SEAFDEC, 2022). However, increasing incidents of IUU fishing across coastal provinces continue to undermine ecological and socio-economic stability. Empirical studies in Zamboanga Sibugay, for instance, have documented that IUU fishing contributes substantially to the depletion of fish stocks, degradation of coral and seagrass habitats, and declining livelihood opportunities for fishing-dependent communities (Fernandez et al., 2025; Ogoc et al., 2025). These findings underscore that IUU fishing is not only an environmental concern but also a social and economic threat, highlighting the need for adaptive management and transformative strategies to maintain both ecological and societal resilience (Villasante et al., 2022).
In the Philippines context, a global marine biodiversity hotspot, destructive fishing persists due to weak enforcement and geographic challenges (Tahiluddin & Sarri, 2022). To counter this, the government developed the IUU Fishing Index and Threat Assessment Tool (I-FIT), a standardized framework institutionalized through Fisheries Office Orders and supported by the United States Agency for International Development (USAID) Fish Right (DA–BFAR, 2021, 2022). This tool follows the global prevalence-vulnerability-response framework to IUU fishing. National assessments reveal moderate IUU risk, prompting interagency cooperation and efforts to strengthen local government unit (LGU) engagement under Fisheries Management Area guidelines (DA–BFAR, 2024).
Crucially, governance mechanisms and policy frameworks play a critical role in mitigating IUU fishing and supporting sustainable SSF management. In the Philippines, instruments such as the Philippine Fisheries Code (republic act [RA] 8550 as amended by RA 10654), Executive order no. 154, and catch documentation and traceability (CDT) systems provide the legal and operational foundation for IUU enforcement, resource monitoring, and compliance with international maritime agreements (Barboza et al., 2024; SEAFDEC, 2022). Despite these frameworks, enforcement gaps and uneven local capacities continue to pose challenges, particularly in coastal communities dependent on SSF, underscoring the need for localized assessments like the present study.
Although a national IUU fishing risk framework exists, few studies have examined local capacities to address these challenges. The Philippine IUU fishing assessment report (DA–BFAR, 2023) further revealed that Region 9, also known as the Zamboanga Peninsula, had 0% I-FIT assessment coverage, highlighting a significant gap in localized governance and monitoring efforts. This is concerning because the Zamboanga Peninsula remains one of the country’s key fishing grounds, and weak enforcement capacities combined with unassessed risks may allow IUU practices to persist unchecked.
To respond to this gap, this study centers on the ATOM Alliance, composed of the municipalities of Alicia, Talusan, Olutanga, and Mabuhay in Zamboanga Sibugay Province, as the first endeavor to assess and compare the response to IUU fishing using I-FIT in Region 9, Philippines. The alliance’s active coordination efforts further contextualize the regional commitment to strengthening IUU fishing governance. Thus, this study aimed to evaluate and compare the responses to IUU fishing among ATOM municipalities, and identify strengths and gaps in local capacity to address IUU fishing.
Specifically, this study aimed to: (1) assess the IUU fishing risk; (2) compare the variations in management responses to IUU fishing among municipalities; and (3) identify strengths and gaps in local capacity to address IUU fishing. It was hypothesized that the ATOM Alliance municipalities would exhibit uneven response capacities, with stronger institutional mechanisms (e.g., operational enforcement teams, consistent information, education, and communication [IEC] programs, and compliance with national fisheries laws) associated with lower IUU fishing risks and higher data quality (DQ).
The findings from this study can contribute to global and national sustainability goals, including the United Nations Sustainable Development Goal (SDG) 14.4 target and the Philippine Fisheries Code (RA 8550 as amended by RA 10654), which aim to end overfishing, IUU fishing, and destructive fishing practices, and implement science-based management plans to restore fish stocks sustainably.
Materials and Methods
This study adhered to ethical standards for research involving human participants. Ethical clearance was obtained from the Mindanao State University–Iligan Institute of Technology (MSU–IIT) Ethics Review Board. Local government and community endorsements were secured to ensure transparency, field support, and safe access. Participants were informed of the study’s objectives, assured of voluntary participation, and guaranteed confidentiality. Data collection was conducted with cultural sensitivity, particularly regarding discussions of illegal fishing activities.
This study employed the Response component of I-FIT developed by Department of Agriculture–Bureau of Fisheries and Aquatic Resources (DA–BFAR) and USAID Fish Right. The response component measures what has been done to address IUU fishing under LGU jurisdiction using five indicators: (R1) presence of a fully operational enforcement team, (R2) implementation of targeted IEC activities, (R3) LGU compliance with national fisheries laws, (R4) systematic data collection to guide IUU fishing reduction strategies, and (R5) presence and implementation of an IUU Fishing Reduction Plan. Each IUU fishing response indicator was assessed using I-FIT’s four-point response scoring from 1, indicating low risk to IUU fishing to 4, denoting very high risk to IUU fishing. The scores are indications of IUU fishing risk exposure, as a guide for planning and operational decisions on the fight against IUU fishing, and as a baseline for monitoring progress towards IUU fishing reduction. This score reflects the actual level of response to IUU fishing based on the evidence collected for each indicator and is computed independently from DQ.
Moreover, there is a need to assess the data quality for each indicator to ensure a reliable basis for monitoring. This is crucial because the I-FIT tool will be repeatedly applied in the site in line with the Department of Interior and Local Government (DILG) memorandum circular 2024-116, which mandates all coastal municipalities to use the I-FIT tool to assess the status and monitor the progress of efforts against IUU fishing. Thus, I-FIT has the following data quality scoring: 1 = low reliability based on perceptions of limited person or opinions with no supporting documents available); 2 = medium quality based on perceptions derived from a systematic survey or focused group discussion; and 3 = high quality based on systematically collected and recorded observations and/or reports or well-documented data.
It is important to note that the response score and the DQ score serve different purposes in the I-FIT assessment. The response score reflects the level of governance response to IUU fishing, ranging from 1 (low risk) to 4 (very high risk), based on the available evidence for each indicator. The DQ score indicates how reliable that evidence is and does not alter the response score. Consequently, a high response score may occur even when the DQ score is low, signaling a potentially serious governance gap supported by limited evidence that should be interpreted with caution and prioritized for further data collection, while higher DQ scores indicate that the response score is supported by strong and well-documented evidence.
This study was conducted across four coastal municipalities that comprise the ATOM Alliance, Alicia, Talusan, Olutanga, and Mabuhay, located in the southern portion of Zamboanga Sibugay Province, Philippines (Fig. 1). The ATOM Alliance is an inter-local collaboration that collectively addresses critical challenges in coastal resource governance, including IUU fishing, overfishing, habitat degradation, and coordination gaps in fisheries management.
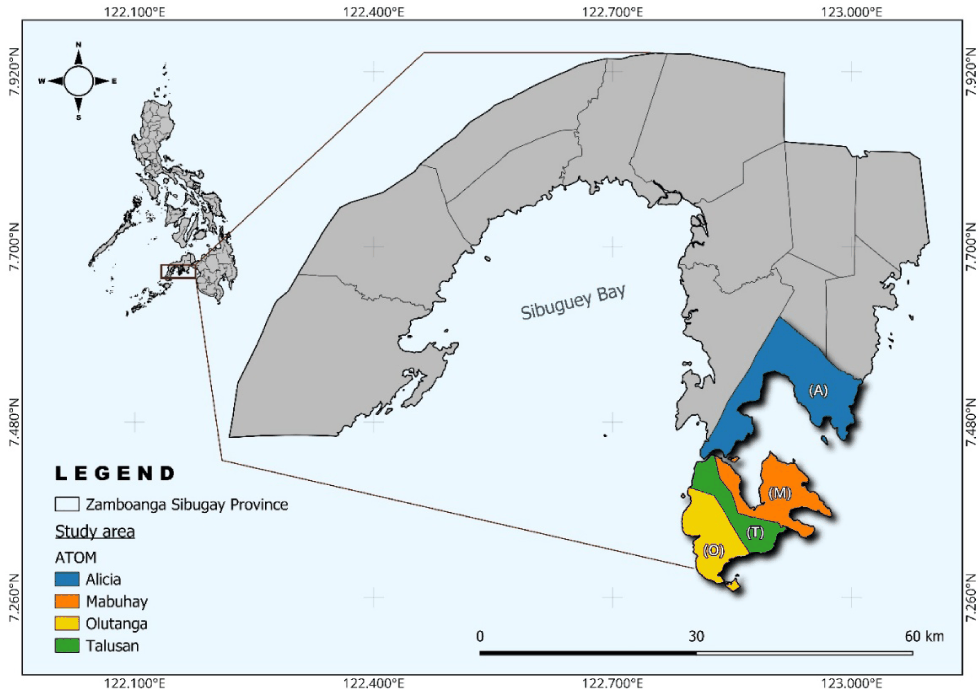
The four municipalities were purposively selected for two main reasons. First, they collectively represent the complete membership of the ATOM Alliance and encompass the ecological and governance diversity of Sibuguey Bay. Second, Region 9 had 0% I-FIT assessment coverage according to the Philippine IUU fishing assessment report (DA–BFAR, 2023), indicating a critical gap in localized monitoring and governance evaluation. Hence, they provide a suitable setting for conducting the first comparative assessment of municipal-level responses to IUU fishing using the I-FIT framework in Region 9.
All four municipalities are positioned along or around Sibuguey Bay, a biologically productive fishing ground within the Sulu–Celebes Sea marine ecosystem, where IUU fishing has been persistently documented (Fernandez et al., 2025; Ogoc et al., 2025). Alicia, situated along the southeastern coast of the province, spans approximately 72.5 km² and comprises 20 coastal barangays. Talusan, a smaller yet strategic municipality on the northeastern edge of Olutanga Island, covers about 34.6 km² and includes 10 coastal barangays. Olutanga, the largest and only island municipality, occupies 113.3 km² with a coastline stretching approximately 93.44 km and consists of 14 coastal barangays. Mabuhay, located southwest of Olutanga Island, has a land area of 51.6 km², a shoreline of 65.2 km, and coastal waters covering around 27,000 hectares, and consists of 16 coastal barangays.
Information on individual coastal barangays and population sizes was obtained from the Municipal Agriculture Offices (MAOs) of Alicia, Talusan, Olutanga, and Mabuhay (2024; unpublished internal documents), while general municipal characteristics were cross-checked using PhilAtlas (2024).
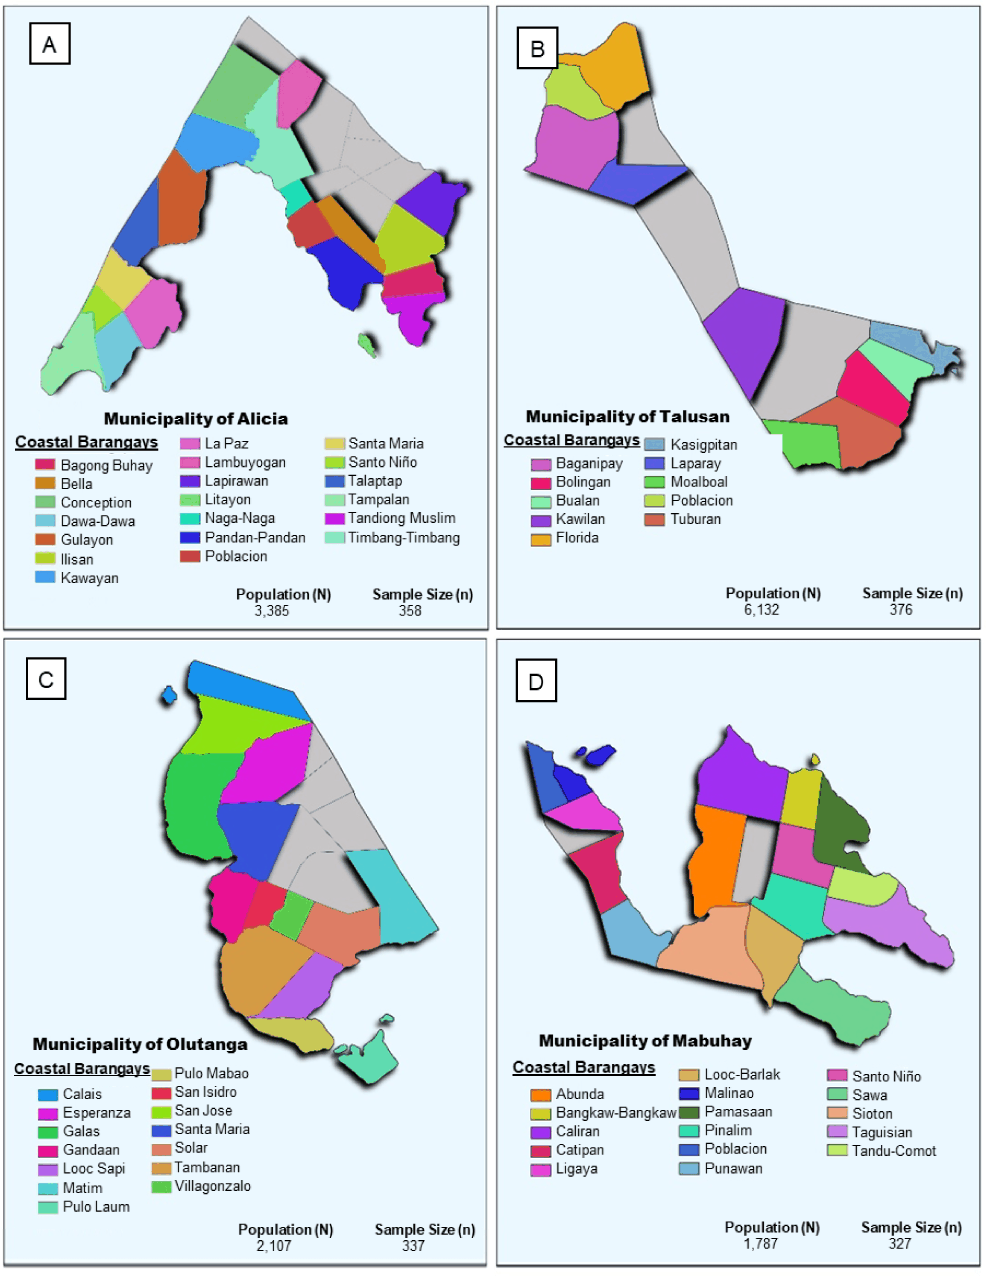
Fig. 2 provides a detailed depiction of the four municipalities, showing individual coastal barangays, their spatial boundaries, and population and sample sizes of registered fisherfolk included in the study. Altogether, these 60 coastal barangays constitute the spatial scope of the study, providing a representative landscape of SSF operations and local responses to IUU fishing pressures.
This study employed a comparative, mixed-methods design to assess local responses to IUU fishing across the four coastal municipalities of the ATOM Alliance. The comparative aspect focused on differences in I-FIT response indicators (R1–R5), response scores, and DQ among municipalities, while the mixed-methods approach integrated quantitative I-FIT assessments with qualitative insights from key informant interviews (KIIs), focus group discussions (FGDs), workshops, and secondary data review to provide a comprehensive evaluation of local governance and fisheries management practices.
All data collection activities were guided by the I-FIT framework and indicator structure described in the preceding section. Fieldwork was conducted from August 2024 to February 2025, employing both quantitative and qualitative techniques to ensure a comprehensive capture of response efforts. The study employed five primary methods to collect data: (1) stakeholder municipal workshops; (2) KIIs with municipal authorities and enforcement actors; (3) FGDs with fisherfolk and local stakeholders; and (4) secondary data reviews, which included enforcement reports, patrol logs, apprehension records, and registration databases. and (5) social surveys with fisherfolk to validate the data provided by LGUs, specifically on IEC initiatives. As documented in Supplementary Fig. S1, these data collection activities were implemented systematically across the four municipalities.
Data collection for this study was conducted across the four ATOM Alliance municipalities, Alicia, Talusan, Olutanga, and Mabuhay, between October 2024–February 2025 (Supplementary Fig. S2). Stakeholder workshops, FGDs, and KIIs were carried out independently in each municipality as one-day sessions held at the Municipal Agriculture Offices or municipal hall conference rooms. These sessions engaged purposively selected key local actors, including, (1) the IUU Fishing Reduction Focal, a local agriculture officer overseeing I-FIT implementation; (2) representatives from the Philippine National Police (PNP) and Philippine Coast Guard (PCG); (3) members of the Municipal Fisheries and Aquatic Resources Management Council (MFARMC); and (4) representatives from academe or locally accredited non-government organizations (NGOs). Additional stakeholders, such as Bantay Dagat volunteers and fisherfolk leaders, participated in some municipalities to provide context-specific insights. Participant numbers were as follows: 10 in Alicia, 5 in Talusan, 9 in Olutanga, and 8 in Mabuhay.
FGDs involved the same participants and utilized participatory tools, including threat mapping to identify IUU fishing risks in municipal waters and problem tree analysis to explore root causes, drivers, and impacts. KIIs were conducted with frontline enforcement personnel from each coastal barangay, including PNP and PCG representatives who also participated in the workshops, providing a deeper understanding of how local response mechanisms, such as patrol operations, apprehensions, and inter-agency coordination, varied across barangays.
A face-to-face social survey was administered among randomly selected respondents from the coastal barangays of the four municipalities, Alicia (20 barangays), Talusan (10 barangays), Olutanga (14 barangays), and Mabuhay (16 barangays). As shown in Supplementary Fig. S2, these social surveys complemented qualitative insights from stakeholder workshops, KIIs, and FGDs to provide a comprehensive assessment of community perspectives on IEC programs to address IUU fishing.
The sampling frame was limited to respondents engaged in fishing-related activities within the ATOM Alliance. Random samples were drawn from each municipality, with the required sample sizes calculated using Slovin’s formula at a 95% confidence level and a 5% margin of error (Yulinda et al., 2021). In this formula, N represents the total population of registered fisherfolk in each municipality, while n denotes the number of respondents selected for the survey. The population (N) and corresponding sample size (n) for each municipality are detailed in Fig. 2.
This sampling design minimized potential bias and ensured that the data were representative of the fisherfolk populations, enabling both descriptive and inferential comparison across municipalities.
The social survey used a questionnaire adopted from the I-FIT, administered consistently across all four ATOM Alliance municipalities. The core structure and themes were retained to allow valid cross-site comparisons. Minor adjustments were made only to improve clarity, cultural relevance, and accessibility for respondents, without altering the substantive content (Table 1).
The response scoring uses a four-point ordinal scale (1–4), where 1 represents low risk to IUU fishing, 2 indicates moderate risk, 3 denotes high risk, and 4 indicates very high risk to IUU fishing. These scores reflect the actual level of response to IUU fishing based on the evidence collected for each indicator and is computed independently from DQ.
The data-quality scoring uses a three-point scale (1–3) to indicate the reliability of data source or how the data were derived. DQ score 1 corresponds to low-reliability based on perceptions of less than 2 people or no information available, DQ score 2 represents medium-reliability based on perceptions from systematic survey or focused group discussion, and DQ score 3 corresponds to high reliability, well-documented evidence or systematically collected and recorded observations.
Each response indicator (R1–R5) was scored based on the type of evidence specified by I-FIT, and data sources were derived only from local government units (i.e., MAO and enforcement team) as prescribed by I-FIT. However, social survey was conducted to further validate the data from the local government units for the presence of IEC activities (R2). Thus, the computation of response scores for all indicators relied only on data sources as required by I-FIT tool (Table 1), excluding the social survey.
The response to IUU fishing was assessed by evaluating the measures implemented to address the issue. Each response indicator (R1 to R5) was scored individually. The scores for all five indicators were then summed, with a maximum possible total of 20 points, and divided by the number of indicators (5 indicators × 4 points = 20 ÷ 5) to calculate the average response score for each municipality. Similarly, the average DQ score was calculated based on the applicable indicators, with a component-specific maximum of 12 points, and divided by the number of applicable indicators (4 indicators × 3 points = 12 ÷ 4), excluding the score for R3 since the R3 score for data quality was not applicable.
This section compares the Response scores of Alicia, Talusan, Olutanga, and Mabuhay across the five response indicators (R1–R5), as shown in Table 2. Each municipality’s score per indicator was examined, followed by a comparison of their overall response scores and DQ scores. This analysis identifies which areas of response are strong or weak in each municipality and highlights response gaps within the ATOM Alliance.
Descriptive statistics, including frequencies, mean scores, standard deviations, and percentage distributions, were used to summarize governance responses to IUU fishing across the ATOM Alliance municipalities.
Inter-municipal differences in I-FIT response scores (R1–R5) and DQ scores were assessed using the Kruskal–Wallis H test, which is appropriate for ordinal data, multiple independent groups, and small municipal-level sample sizes (n = 4). The Kruskal–Wallis H test evaluates whether the distributions of scores differ significantly across independent groups, making it appropriate for examining inter-municipal variation in governance responses to IUU fishing.
Differences in community exposure to IEC programs were examined using a Chi-square test of homogeneity, with IEC exposure treated as a binary variable (yes/no). The test was applied to determine whether the proportion of respondents reporting IEC exposure differed significantly among municipalities. This approach is appropriate for comparing proportions across multiple independent groups with categorical outcomes and directly addresses variation in IEC implementation across the ATOM Alliance.
To explore patterns in enforcement capacity, a hierarchical clustering was performed using binary-coded enforcement criteria with Euclidean distance and Ward’s linkage method. Clustering was used as an exploratory tool to identify patterns of similarity among municipalities. The method utilized data from the enforcement team evaluation form, which contained ten criteria reflecting key aspects of enforcement readiness. Clusters were generated to identify similarities and disparities in operational enforcement capacity among Alicia, Talusan, Olutanga, and Mabuhay, as reported in the results. All analyses were performed in R version 4.3.1 (RStudio Team, 2024) using RStudio version 2024.09.1+394 (RStudio Team, 2024).
This study has several limitations. The number of municipalities assessed was small (n = 4), which limits statistical power and generalizability. I-FIT response and data quality scores are ordinal and index-based, constraining the use of parametric methods. Some indicators relied on administrative records and stakeholder reports, which may vary in completeness across municipalities. Finally, cluster analysis was exploratory and intended to identify patterns rather than establish inferential groupings.
Results
The operational capacity of enforcement teams across ATOM Alliance municipalities was assessed using the enforcement team evaluation form, which served as the primary data source for ten critical enforcement criteria. The results showed higher operational capacity in Mabuhay (9/10) and Alicia (8/10), partial capacity in Olutanga (5/10), and a near absence of operational capacity in Talusan (1/10), as presented in Table 5.
| Indicator scoring | χ 2 | p-value | Interpretation |
|---|---|---|---|
| R1–R5 response score | 4.88 | 0.181 | Not significant |
| R1–R5 rata quality score | 7.5 | 0.058 | Not significant |
| Indicator scoring | χ 2 | p-value | Interpretation |
|---|---|---|---|
| R2. Exposure to IEC (yes/no) | 490.3 | < 0.001 | Significant; exposure differs significantly among municipalities |
When translated to I-FIT response scores (Table 8), Alicia and Mabuhay each scored 2 (moderate risk), reflecting relatively strong operational capacity but with some gaps. Talusan and Olutanga both registered 3 (high risk), indicating significant enforcement challenges. DQ was rated 3 (high reliability) for Alicia, Talusan, and Mabuhay, but 1 (low reliability) for Olutanga (Table 9), suggesting the need for improvement in its enforcement data recording.
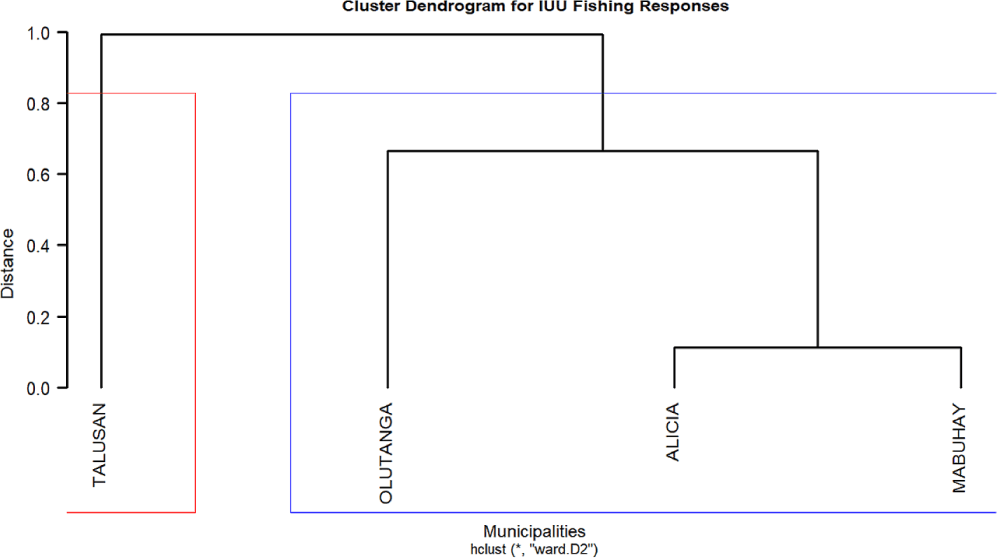
Hierarchical cluster (Fig. 3) revealed a two-cluster structure that reflects both the operational strength and the potential for inter-municipal collaboration within the ATOM alliance. The first cluster, comprising Alicia and Mabuhay, fused at the lowest distance, indicating strong similarity in their enforcement performance and institutional maturity. The second cluster consisted of Olutanga and Talusan, with Talusan emerging as a distinct outlier due to its minimal enforcement capacity and weak coordination mechanisms.
Assessment of IEC activities across the four municipalities revealed marked differences in scope, frequency, and thematic coverage. Effective IEC extends beyond the dissemination of legal provisions, incorporating messages on the ecological, social, and economic benefits of avoiding IUU fishing and offering platforms for fisher engagement.
Exposure to IEC programs differs significantly among ATOM Alliance municipalities based on Chi-square test of homogeneity (χ² = 490.3; p < 0.001) as shown in Table 4. The key IEC activities in each municipality are shown in Table 6. Mabuhay implemented a consistent, integrated program combining legal education, livelihood training, financial literacy, monitoring and reporting, and community dialogue, whereas Alicia implemented a slightly narrower set of activities. Talusan’s IEC efforts were sporadic, reaching only a few households, and Olutanga reported no IEC activities in 2024. Some households had prior exposure in earlier years, leaving a critical gap in preventive compliance measures.
Response score (Table 8) indicates that Alicia and Mabuhay scored 1 (low risk), reflecting active engagement of fishers and the community through IEC campaigns, forums, and participatory meetings. Talusan and Olutanga scored 4 (very high risk), indicating absence of regular IEC initiatives. DQ was rated 3 (high) for Alicia, Talusan, and Mabuhay, but 1 (low) for Olutanga, (Table 9), reflecting reliance on perception and limited verifiable documentation.
The comparison of LGU compliance with national fisheries laws under response indicator R3 reveals differences in available Fisheries Compliance Audit (FCA) results shown in Table 7. Talusan and Mabuhay recorded scores of 83.33% in the 2024 FCA, reflecting relatively strong compliance, particularly in areas such as updated fisher registries, functional Fisheries and Aquatic Resources Management Councils (FARMCs), and licensing systems. However, gaps remain, including the absence of municipal water delineation, comprehensive CRM plans, and cold storage facilities.
In contrast, Olutanga and Alicia had no FCA records during the assessment, highlighting gaps in documented compliance. Based on the scoring scale, Talusan and Mabuhay’s 83.33% corresponded to score 1 (low risk), while Alicia and Olutanga, with absent or very low compliance data, scored 4 (very high risk) (Table 8).
As shown in Table 8, Systematic data collection on IUU fishing across the ATOM Alliance is uneven in both structure and application. All four municipalities registered an IUU Fishing response score of 3 (high risk), indicating that data were collected but not consistently analyzed or applied in strategic decision-making, and some datasets were gathered irregularly. Underlying capacities varied across municipalities: Alicia, Talusan, and Mabuhay were rated 3 (high) based on recent and well-documented records, whereas Olutanga received a score of 1 (low), reflecting reliance on perceptions and incomplete documentation (Table 9).
I-FIT scoring indicates high risk (3) for Alicia, Olutanga, and Mabuhay, reflecting enforcement measures in place but no fully approved or implemented IUU fishing reduction plans. Table 8 shows that Talusan scored very high risk (4) indicating the absence of an approved reduction plan and reliance on general enforcement. From Table 9, DQ scores were high (3) for Alicia, Olutanga, and Talusan, based on draft plans or verified enforcement records, while Mabuhay scored low (1), reflecting reliance on stakeholder perceptions without supporting documents.
The average response scores (Fig. 4A), highlight clear differences among the ATOM Alliance municipalities. Mabuhay recorded the lowest response score of 2.0 (SD), indicating moderate risk ot IUU fishing. This is followed by Alicia with a score of 2.6 (SD), indicating moderate risk, and Talusan with a score of 3.0 (SD =) and Olutanga with a score 3.4 (SD), both indicating high risk to IUU fishing. Kruskal–Wallis H test indicated χ² = 4.88, p = 0.181 (Table 3), indicating no statistically significant difference in the distribution of response scores among municipalities; however, mean ± SD show variations in risk profiles and consistency across indicators.
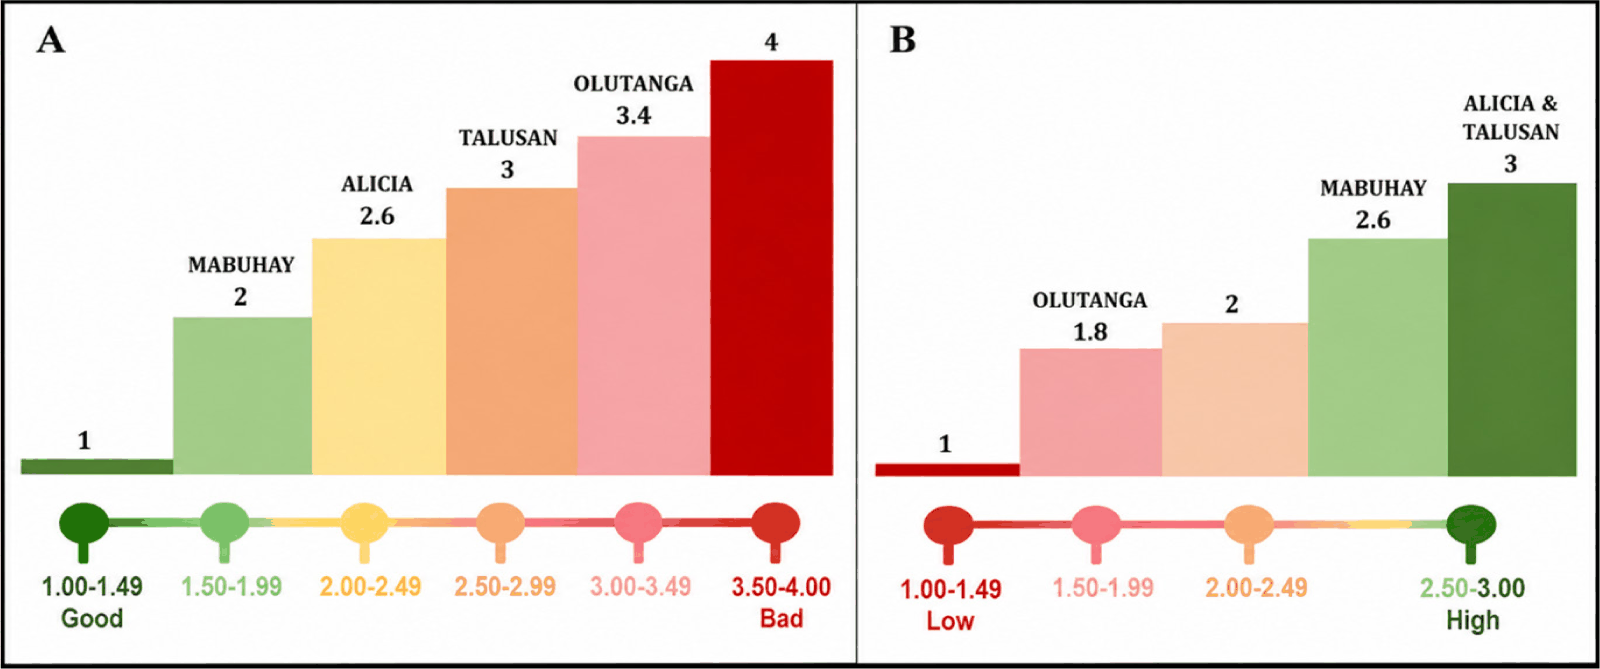
In terms of data quality (Fig. 4B), Talusan consistently achieved the highest score of 3.0, reflecting more reliable and verifiable records. Alicia also scored 3.0, while Mabuhay registered 2.6, and Olutanga scored the lowest at 1.8. These variations indicate differences in data reliability, which affect the comparability and strength of IUU fishing assessments across municipalities. Kruskal–Wallis H test yielded χ² = 7.5, p = 0.058 (Table 3), No statistically significant difference in the distribution of response scores among municipalities indicating that differences in the distribution of distribution of DQ scores approached but did not reach statistical significance.
Discussion and Conclusion
The present study highlights the diverse management responses to IUU fishing across the ATOM Alliance municipalities, illustrating that local capacities are unevenly distributed. These differences support the study hypothesis, indicating that variations in enforcement strength, IEC implementation, fisheries law compliance, data collection, and planning collectively influencing IUU reduction outcomes.
In terms of enforcement capacity across the ATOM Alliance, Alicia and Mabuhay exhibit stronger operational systems compared to Talusan and Olutanga. Talusan records both high risk and high reliability of DQ, indicating critical gaps in enforcement constrained enforcement resources, sporadic IEC efforts, limited municipal coordination, and socio-political factors affecting municipal capacity. In contrast, Olutanga shows high risk and low reliability of DQ, reflecting weak monitoring systems, under-resourced management, and inconsistent patrols, which collectively reduce confidence in compliance outcomes. SSF actors in Talusan reported higher exposure to illegal fishing practices, affecting their catch volume and income stability, whereas Alicia and Mabuhay communities’ benefit from stronger patrol presence and rapid response to IUU activities.
Practical interventions to address these gaps include capacity-building programs for enforcement teams, integration of community patrols such as Bantay Dagat, and adoption of technological tools like Fish SHIELDS (Sevillano, 2024), which have improved detection and response in under-resourced municipalities. Deployment of Fish SHIELDS has been associated with nationwide improvement in I-FIT scores (from 2.58 in 2021 to 2.36 in 2023), indicating enhanced monitoring and reporting capabilities (DA–BFAR, 2023; Sevillano, 2024). These enforcement differences also interact with other response components, particularly IEC and LGU compliance. Municipalities with stronger patrol presence generally show better community engagement and adherence to fisheries regulations.
The hierarchical cluster results indicate differences in operational capacity among the ATOM municipalities. The cluster pattern indicates differences in operational capacity among the ATOM municipalities. Alicia and Mabuhay share similar enforcement strengths, whereas Talusan and Olutanga demonstrate weaker and more varied capacity. These findings highlight opportunities for regional coordination and knowledge sharing. Transferable strategies such as technology adoption, joint training programs, and coordinated patrol scheduling from Alicia and Mabuhay could help strengthen enforcement capacity in Olutanga and Talusan.
Variations in IEC implementation across the ATOM Alliance influences the effectiveness of enforcement and overall compliance, with Mabuhay’s integrated program and Alicia’s narrower initiatives suggest that consistent IEC contributes to better community engagement and compliance. In contrast, Talusan’s sporadic IEC and Olutanga’s absence of activities demonstrate critical gaps in preventive compliance measures, consistent with national reports that about a third of LGUs do not conduct regular IEC campaigns (DA–BFAR, 2022). Weak IEC can reduce community awareness, making enforcement efforts less effective and further complicating compliance.
Talusan and Mabuhay demonstrate relatively strong compliance, whereas Alicia and Olutanga lack FCA data, limiting comparability and highlighting gaps in monitoring. The absence of FCA constrains the interpretation of compliance performance and reduces the reliability of cross-municipal comparisons, as unassessed LGUs may underperform or remain unrecognized for existing efforts. SSF in municipalities with strong FCA compliance experience greater regulatory certainty, while those lacking FCA data face uncertainty and reduced planning capacity. To address this, regular FCA implementation can be incentivized through capacity-building, performance-based awards (e.g., Seal of Good Local Governance [SGLG]) and inter-LGU collaboration.
Beyond compliance, systematic data collection is necessary to support effective IUU reduction strategies. The uneven application of IUU fishing data indicates operational and analytical gaps. Even when data are well-documented, they are not systematically transformed into actionable intelligence. Addressing these gaps requires standardization of data collection, digital monitoring tools, and training for personnel and fish wardens to translate data into operational strategies, strengthen enforcement, and reduce IUU risk. Grantham et al. (2022) reported that analog catch recording and low digital adoption contribute to underreporting, highlighting the need for consistent application of data in local governance.
The results suggest that all municipalities are at early stages of developing formal IUU fishing reduction plans. Alicia’s draft plan includes enforcement, sustainable fishing, livelihood diversification, and awareness initiatives but remains unapproved. Olutanga relies mainly on alliance coordination, Mabuhay implements enforcement without formal documentation, and Talusan’s actions are largely reactive. Similar trends are observed in other Philippine coastal areas, where formalized IUU reduction planning remains slow despite its importance. Globally, effective IUU fishing reduction requires coordinated, multi-agency strategies and integrated plans addressing social, economic, and ecological factors (Auld et al., 2023).
When considered collectively, R1–R5 indicators demonstrate that municipalities such as Alicia and Mabuhay, with stronger enforcement, sustained IEC, documented compliance, and emerging planning capacity exhibit lower IUU fishing risk. Municipalities should prioritize formal approval and implementation of IUU reduction plans aligned with ATOM Alliance objectives, including clear enforcement protocols, community engagement programs, livelihood interventions, and monitoring mechanisms.
Overall, the ATOM Alliance achieved an average response score of 2.75, nearly identical to the 2021 national average of 2.76 (DA–BFAR, 2022). The findings indicate that exposure to IUU fishing risk in Alicia (2.4) and Mabuhay (2.0) is lower compared to national response average, whereas Talusan (3.0) and Olutanga (3.4) lag behind and face higher levels of IUU fishing risk. The Kruskal–Wallis H test confirmed no significant difference in the distribution of response scores among municipalities (χ² = 4.88, p = 0.181; Table 3).
DQ averaged 2.6 across municipalities, with Talusan exhibiting the most reliable documentation (Mean = 3.0, SD = 0.0) and Olutanga the lowest (Mean = 1.8, SD = 1.1). The Kruskal–Wallis H test (χ² = 7.5, p = 0.058; Table 3) showed that differences in distribution of DQ did not reach statistical significance, indicating that some high response scores may be based on limited-quality evidence. Consistent with the I-FIT framework, DQ reflects the reliability of underlying data; thus, municipalities with higher DQ, such as Talusan, inspire greater confidence in their scores, while lower DQ, as observed in Olutanga, suggests weaker monitoring systems. Although some municipalities, such as Alicia and Mabuhay, recorded moderate response scores alongside lower or variable data quality, these results should not be interpreted as definitive evidence of effective governance. Consistent with the I-FIT framework, high response scores supported by limited or low-quality documentation likely reflect perceived implementation, partial records, or informal practices rather than fully verified institutional performance. Such patterns indicate potential governance gaps in monitoring, documentation, and validation processes that require further verification. Accordingly, these findings should be interpreted cautiously and viewed as indicative rather than conclusive, underscoring the need for future studies to strengthen verification through official records, geotagged patrol logs, standardized reporting systems, and community validation workshops.
The 2023 national IUU fishing report (DA–BFAR, 2023) indicates a gradual reduction in IUU fishing risk from 2.58 in 2021 to 2.36 in 2023, consistent with national improvements. However, the persistence of high-risk municipalities within the ATOM Alliance suggests uneven progress. Practical implications include prioritizing targeted capacity-building, standardized monitoring protocols, and alignment with alliance-wide strategies. Municipalities such as Olutanga require intensified interventions, whereas Mabuhay and Alicia may serve as models for scaling best practices.


