Introduction
Fishery product consumption has increased steadily over the past 50 years as public awareness of healthy and diversified diets has increased (FAO, 2016). According to the Food and Agriculture Organization (FAO) of the United Nations, global food fish consumption per capita increased from 9 kg in 1961 to 20.2 kg in 2015 (FAO, 2018). Per capita fish consumption is expected to increase from 20.5 kg in 2015–17 to 21.3 kg by 2027 (OECD & FAO, 2018). According to statistics in Korea, the annual consumption of fishery products per person increased from 56.5 kg in 2007 to 65.9 kg in 2017 (KOSTAT, 2019). In particular, the consumption of raw sea squirt has gradually increased in South Korea (Kim et al., 2013).
Vibrio parahaemolyticus (V. parahaemolyticus) is a gram-negative, aerobic, halophilic, and non-spore forming rod bacterium that is frequently isolated from river and ocean areas (FDA, 2017). V. parahaemolyticus has been reported to cause enteritis when fishery products are ingested raw or after low temperature cooking (Feldhusen, 2000; Newton et al., 2012).
According to the foodborne illness statistics by the Ministry of Food and Drug Safety (MFDS, 2021) from 2010 to 2020, the number of cases of foodborne illness caused by V. parahaemolyticus was 225 and the number of patients was 1,524. Raw foods, such as sashimi and sushi, may be the primary cause of V. parahaemolyticus foodborne illness in South Korea (MFDS, 2015). A large-scale V. parahaemolyticus foodborne illness occurred due to raw oysters in 2003, resulting in a total of 91 patients (MFDS, 2013) and in 2017, at a bazaar of the Seoul Welfare Center in South Korea, cross-contamination occurred by cutting boards and knives from squid contaminated with V. parahaemolyticus, resulting in 273 patients (Jung, 2018).
In 2004, the 62 cases of V. parahaemolyticus infection in Alaska were caused by oysters, and the 177 cases of this infection in New York, Oregon, and Washington in the USA were caused by shellfish (McLaughlin et al., 2005; MMWR, 2006). Although no cases of V. parahaemolyticus foodborne illness have been reported from sea squirt consumption, there is a high likelihood of infection by it because sea squirt is eaten raw, like oysters.
Fishery products are those that are produced in seawater, which is inhabited by a mix of various microbial species. Additionally, these products are often exposed to a humid environment for a long time during processing and distribution, which actively maintains the growth and metabolism of contaminating microorganisms (Gram & Dalgaard, 2002). Sea squirts ingest viruses and bacteria from seawater by filter-feeding, and thereby accumulate these pathogens (Cliver, 1988; Grimes, 1991). Therefore, the standard growth conditions of sea squirts allow for V. parahaemolyticus contamination, posing a risk of foodborne illness upon consumption without sufficient washing. However, this risk has not been analyzed quantitatively.
Quantitative microbial risk assessment (QMRA) involves four stages: hazard identification, exposure assessment, hazard characterization, and risk characterization and is used to estimate the risk of foodborne illness (CAC, 1999). However, there have been very few studies that have assessed the risk of V. parahaemolyticus infection in fishery products, particularly tunicate.
Therefore, the objective of this study was to evaluate the risk of V. parahaemolyticus contamination in sea squirts by developing a Monte Carlo simulation model.
Materials and Methods
Sea squirt (Halocynthia roretzi) samples were purchased from online markets and markets in Seoul, Guri, Mokpo, and Tongyeong, South Korea. Twenty-five grams of sea squirt was placed into a sample bag purchased from 3M (Maplewood, MN, USA), and 225 mL alkaline peptone water (APW) purchased from Becton, Dickinson and Company (BD) (Franklin Lakes, NJ, USA) was placed in the same bag. The samples were then homogenized for 1 min (Wang et al., 2019) using a homogenizer purchased from Interscience (St. Nom-la-Bretèche, France). Homogenates were serially diluted with 9 mL APW, and 0.1 mL of the diluents were plated on thiosulfate citrate bile salt sucrose (TCBS) agar purchased from BD (Franklin Lakes) and incubated at 35°C for 24 h. The number of V. parahaemolyticus positive samples was fitted using Beta distribution to evaluate the prevalence of V. parahaemolyticus in sea squirt and estimate the initial contamination level (Vose, 1997).
Four V. parahaemolyticus strains, ATCC17802, ATCC27519, ATCC33844, and ATCC43996, that have toxin-producing genes (Lee et al., 2018) were cultured in 10 mL marine broth purchased from BD (Franklin Lakes) at 37°C for 24 h (Kim et al., 2019). Subcultures were prepared by adding 0.1 mL of the culture to 10 mL fresh marine broth at 37°C for 24 h. The subcultured strains were mixed and centrifuged at 1,912×g and 4°C for 15 min. The cell pellet was washed twice with phosphate-buffered (PBS pH 7.4: NaCl 8.0 g, NaHPO4 1.5 g, KH2PO4 0.2 g, KCl 0.2 g in 1 L distilled water). The pellet was then diluted with PBS to 3.0–3.5 Log CFU/mL and served as the inoculum. One hundred and twenty sea squirt samples purchased from online markets were immersed in 2 L of the inoculum for 3 min, and the samples were then drained on a wicker tray for 10 min. The homogenization and enumeration steps of the samples were the same as the section of “Examination of V. parahaemolyticus in sea squirt”.
The cell count data were fitted to the Baranyi model (Baranyi & Roberts, 1994) to calculate maximum specific growth rate (μmax; Log CFU/g/h), lag phase duration (LPD; h), initial bacterial cell count (N0; Log CFU/g), final bacterial cell count (Nmax; Log CFU/g), initial physiological state of the cells (h0), and storage time (t), using the following formula:
To analyze the effect of temperature on the kinetic parameters, μmax values were analyzed using a square root equation [Y = {aμ × (Temp – Tempmin)}2], and LPD values were analyzed using a polynomial equation [Y = (a / Temp) + (b / Temp2) + c].
To evaluate model performance, V. parahaemolyticus was inoculated in sea squirt as described above, and samples were stored at 10°C and 23°C. During storage, the V. parahaemolyticus concentration in sea squirts was quantified as described above. These values were compared with the predicted values calculated using the models developed at 10°C and 23°C, and the difference was analyzed by calculating the root mean square error (RMSE) (Baranyi et al., 1996).
μmax and LPD values from primary models were analyzed using the general linear procedure with SAS® version 9.3 purchased from SAS Institute (Cary, NC, USA). Least square means among temperature data were compared using the t-test at α = 0.05.
The data for distribution temperature, time spent in transit to market, and time spent in home storage were collected by personal communication with a market employee. The data for food storage temperature at home was acquired from a study by Lee et al. (2015).
To estimate the average amount of sea squirts consumed in Korea and to determine appropriate probability distributions, raw data from the Korea National Health and Nutrition Examination Surveys (KNHANES; KDCA, 2016) 2016 were inputted into @RISK version 6.0 software purchased from Palisade (Ithaca, NY, USA). To estimate the frequency of sea squirt consumption, the number of consumers was divided by the number of total respondents.
To determine the appropriate dose-response model for V. parahaemolyticus, all dose-response models in published literatures were reviewed.
To estimate the probability of foodborne illness per person per day for sea squirt consumption, a simulation model was developed in an Excel® spreadsheet purchased from Microsoft (Redmond, WA, USA) using data collected regarding prevalence, contamination level, duration and temperature of storage and transportation; predictive models; amount and frequency of consumption; and the dose-response model. The Monte Carlo simulation was generated using @RISK version 6.0, with 10,000 iterations.
Results and Discussion
V. parahaemolyticus contamination was detected in 6 of 35 samples (17.1%). Due to the low detection frequency and levels of V. parahaemolyticus, the initial contamination level at the production stage was estimated by Beta distribution modeling [Beta (7, 30)] using the equation described by Sanaa et al. (2004). The initial contamination level of V. parahaemolyticus in sea squirt was calculated to be –2.1 Log CFU/g.
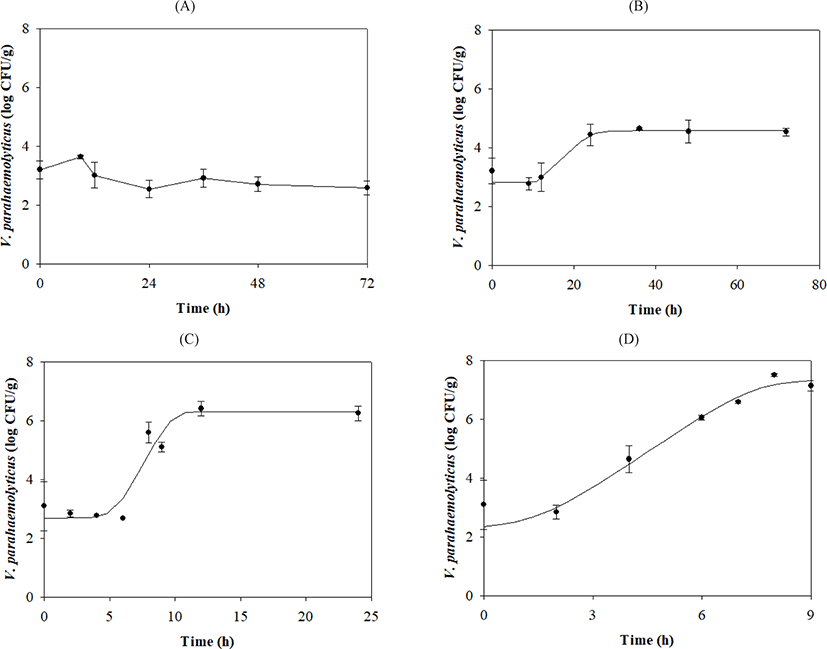
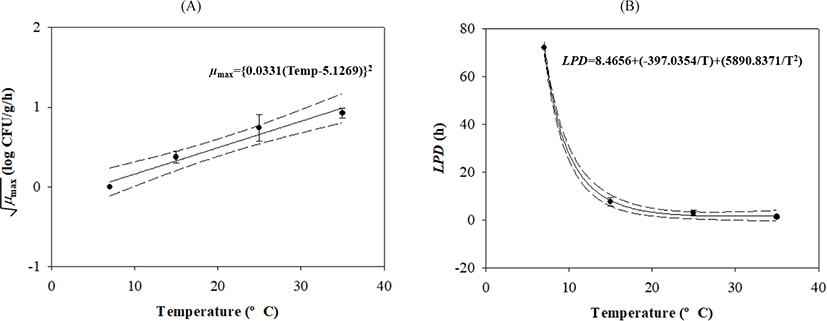
V. parahaemolyticus growth gradually increased after lag phases, which decreased as the temperature increased (Table 1 and Fig. 1). Secondary models were developed to describe how temperature affects growth kinetic parameters during transport, display, and storage. The μmax value was calculated as {0.0331 × (Temp – 5.1269)}2 with R2 = 0.839, and the LPD of the model was calculated as 8.4656 + (–397.0354 / Temp) + (5,890.8371 / Temp2) with R2 = 0.997 (Fig. 2).
Surveys revealed that the average time taken for freshly harvested sea squirts to be transported to markets was 3.339 h or 5 h, depending on the distance. A time of 0 h was also observed in cases where sea squirts were carried directly to the market without additional transportation. Thus, an appropriate probability distribution was determined using Pert distribution using the following parameters: (0, 3.339, 5). Temperatures measured during transportation to markets were fitted with @RISK, and the Weibull distribution {Weibull [1.3219, 2.8404, Shift (3.1093), Truncate (1, 40)]} was used to generate a probability distribution.
Sea squirt samples were immediately displayed once they arrived at the market instead of being first stored in a warehouse. They were displayed for 0–48 h; thus, uniform distribution modeling (0, 48) was used. The display temperature ranged between –5.4°C and 18.1°C, and the probability distribution was calculated using Weibull distribution modeling {Weibull [2.2708, Shift (–8.4157), Truncate (–6, 18.1)]}.
Sea squirts were consumed immediately or within 72 h after purchase. Therefore, we used uniform distribution (0, 72) for analysis. The probability distribution for home storage temperature was modeled using the LogLogistic distribution {LogLogistic [–29.283, 33.227, 26.666, Truncate (–5, 20)]}, as indicated by Lee et al. (2015).
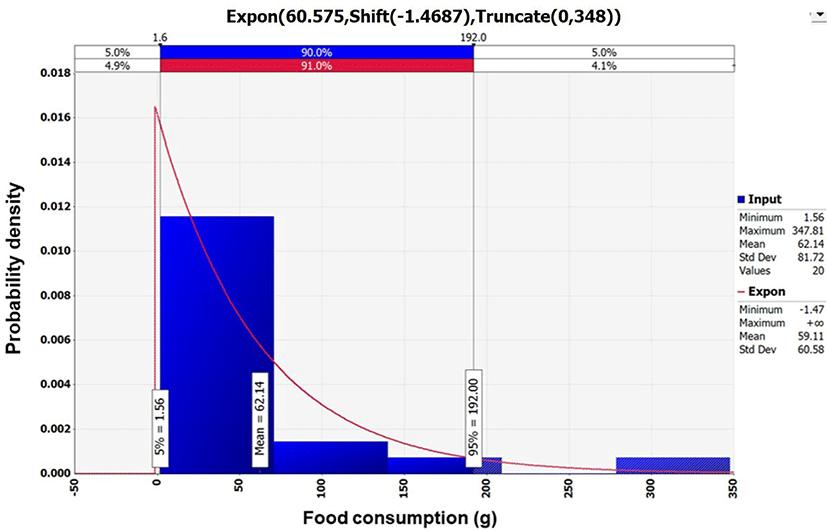
Data collected regarding the amount of sea squirt consumed were analyzed using @RISK, and Exponential distribution {Expon [60.575, Shift (–1.4687), Truncate (0, 348)]} was selected to generate a probability distribution (Fig. 3). According to the analysis by KNHANES, the average daily amount of sea squirt consumed was 62.14 g per day. Out of 7,042 total respondents, only 22 consumed sea squirts; therefore, the frequency of consumption was 0.28% in South Korea (KDCA, 2016).
To estimate the dose-response of V. parahaemolyticus, the Beta-Poisson model [Pillness = 1 – (1 + D / β)–α, α = 0.17, β = 1.18 × 10⁵] developed by Iwahori et al. (2010) and FAO & WHO (2011) was used. D is the number of ingested bacterial cells (CFU) and is calculated as 10final V. parahaemolyticus cell counts (Log CFU/g) × daily amount of sea squirt consumed (g). α and β are fixed values representing the probability of a single V. parahaemolyticus cell causing foodborne illness.
The final V. parahaemolyticus cell count (Log CFU/g) was calculated as the total concentration from the initial contamination level through the transportation, display, and storage of sea squirt samples. The change in cell count was predicted using the developed predictive models.
To calculate the probability of V. parahaemolyticus foodborne illness, a simulation model was prepared as shown in Table 2 using probability distributions for V. parahaemolyticus prevalence, temperature, time and quantity of consumption, and consumption frequency, as well as the predictive models and the dose-response model. The simulation indicated that the probability of V. parahaemolyticus infection following sea squirt consumption was 4.03 × 10⁻⁹ per person per day in Korea. This estimated risk is lower than that reported for raw oysters (Crassostrea gigas) in Brazil (4.7 × 10⁻⁴, 6.0 × 10⁻⁴, 4.7 × 10⁻⁴, and 3.1 × 10⁻⁴ per person per serving for spring, summer, fall, and winter, respectively) and for raw blood clams (Anadara broughtonii) in southern Thailand (5.6 × 10⁻⁴ per person per year) (Sobrinho et al., 2014; Yamamoto et al., 2008).
| Input model | Unit | Variable | Formula | References |
|---|---|---|---|---|
| PRODUCT | ||||
| Pathogens contamination level | PR | = RiskBeta (7, 30) | This research; Vose (1997) | |
| V. parahaemolyticus concentration | CFU/g | C | = –LN (1–PR) / 25 g | Sanaa et al. (2004) |
| Initial contamination level | Log CFU/g | IC | = Log (C) | This research |
| TRANSPORTATION TO MARKET | ||||
| Transportation | ||||
| Transportation time | h | Timetrans | = RiskPert (0, 3.339, 5) | Personal communication; This research |
| Food temperature during transportation | °C | Temptrans | = RiskWeibull (1.3219, 2.8404, RiskShift (3.1093), Risktruncate (1, 40)) | Personal communication; This research |
| Growth | ||||
| h0 | = average (growth rate × lag phase duration), Fixed 1.14 | This research; Baranyi & Roberts (1994) | ||
| Log CFU/g | Y0 | = average (Y0i), Fixed 3.1 | This research; Baranyi & Roberts (1994) | |
| Log CFU/g | Yend | = average (Yendi), Fixed 5.6 | This research; Baranyi & Roberts (1994) | |
| ln(q) | = LN (1 / (EXP (h0) – 1)) | This research; Baranyi & Roberts (1994) | ||
| Growth rate | Log CFU/g/h | GRtrans | = IF (Temptrans > 4.9515, 0.0330 × (Temptrans–4.9515))2), 0) | This research; Baranyi & Roberts (1994) |
| V. parahaemolyticus growth model | Log CFU/g | C1 | = IC + 1 / (1 + EXP (–ln(q))) × (1 – 10−|Y0–Yend| / LN(10)) × GRtrans × Timetrans | This research; Baranyi & Roberts (1994) |
| MARKET | ||||
| Market display | ||||
| Display time | h | TimeMark-dis | = RiskUniform(0,48) | Personal communication; This research |
| Food temperature during display | °C | TempMark-dis | = RiskWeibull (2.2708, 21.394, RiskShift (–8.4157), RiskTruncate (–6, 18.1)) | Personal communication; This research |
| Growth | ||||
| h0 | = average(growth rate × lag phase duration), Fixed 1.14 | This research; Baranyi & Roberts (1994) | ||
| Log CFU/g | Y0 | = average(Y0i), Fixed 3.1 | This research; Baranyi & Roberts (1994) | |
| Log CFU/g | Yend | = average(Yendi), Fixed 5.6 | This research; Baranyi & Roberts (1994) | |
| ln(q) | = LN (1 / (EXP(h0) – 1)) | This research; Baranyi & Roberts (1994) | ||
| Growth rate | Log CFU/g/h | GRMark-dis | = IF(TempMark-dis > 4.9515, 0.0330 × (TempMark-dis – 4.9515))2), 0) | This research; Baranyi & Roberts (1994) |
| V. parahaemolyticus growth model | Log CFU/g | C2 | = C1 + 1 / (1 + EXP (-ln(q))) × (1 – 10−|Y0–Yend| / LN(10)) × GRMark-dis × TimeMark-dis | This research; Baranyi & Roberts (1994) |
| HOME | ||||
| Home storage | ||||
| Storage time | H | TimeHome-st | = RiskUniform (0, 72) | Personal communication; This research |
| Food temperature during storage | °C | TempHome-st | = RiskLogLogistic (–29.283, 33.227, 26.666, RiskTruncate (–5, 20)) | Lee et al. (2015) |
| Growth | ||||
| h0 | = average (growth rate × lag phase duration), Fixed 1.14 | This research; Baranyi & Roberts (1994) | ||
| Log CFU/g | Y0 | = average (Y0i), Fixed 3.1 | This research; Baranyi & Roberts (1994) | |
| Log CFU/g | Yend | = average (Yendi), Fixed 5.6 | This research; Baranyi & Roberts (1994) | |
| ln(q) | = LN (1 / (EXP (h0)–1)) | This research; Baranyi & Roberts (1994) | ||
| Growth rate | Log CFU/g/h | GRHome-st | = IF (TempHome-st > 4.9515, 0.0330 × (TempHome-st – 4.9515))2), 0) | This research; Baranyi & Roberts (1994) |
| V. parahaemolyticus growth model | Log CFU/g | C3 | = C2+1 / (1 + EXP (–ln(q))) × (1–10−|Y0–Yend| / LN(10)) GRHome-st × TimeHome-st | This research; Baranyi & Roberts (1994) |
| CONSUMING | ||||
| Daily consumption amount | g | Consump | = RiskExpon (60.575, RiskShift (–1.4687), RiskTruncate (0, 348)) | KDCA (2016) |
| Daily consumption frequency | % | ConFre | Fixed 0.28 | KDCA (2016) |
| CF(0) | = 1 – 0.28 / 100 | KDCA (2016) | ||
| CF(1) | = 0.28 / 100 | KDCA (2016) | ||
| CF | = RiskDiscrete ({0, 1}, {CF (0), CF (1)}) | KDCA (2016) | ||
| Amount | = IF (CF = 0, 0, Consump) | KDCA (2016) | ||
| DOSE-RESPONSE | ||||
| V. parahaemolyticus amount | CFU | D | = 10C3 × Amount | |
| Parameter of α | α | Fixed 0.17 | Iwahori et al. (2010); FAO & WHO (2011) | |
| Parameter of β | β | Fixed 1.18 × 10⁵ | Iwahori et al. (2010); FAO & WHO (2011) | |
| RISK | ||||
| Probability of illness/person/day | Risk | = 1 – (1 + D/β)−α | Iwahori et al. (2010); FAO & WHO (2011) | |
According to Lee et al. (2015) and Lee et al. (2016) studies, the mean probability of Clostridium perfringens and Staphylococcus aureus foodborne illness for processed cheese were 3.58 × 10⁻¹⁴ and 2.24 × 10⁻⁹ per person per day, respectively. As described in Jung et al. (2017), the mean probability of Campylobacter foodborne illness in raw beef offal for home consumption was 1.56 × 10⁻⁵ per person per day.
Therefore, the probability of foodborne illness by consuming sea squirt contaminated with V. parahaemolyticus is higher than that of C. perfringens and S. aureus foodborne illness from having processed cheese, and lower than that of Campylobacter foodborne illness from consuming raw beef offal.
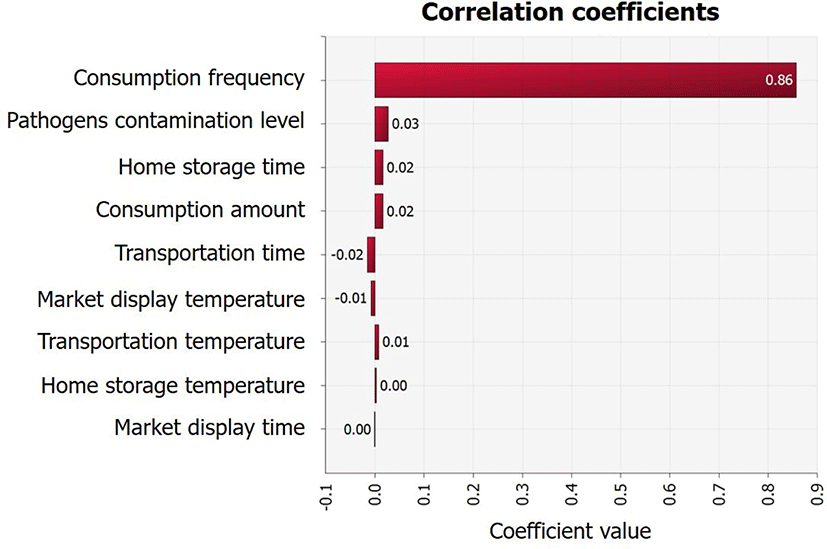
Although the average initial V. parahaemolyticus contamination level in sea squirts was as low as -2.1 Log CFU/g, the probability of infection was calculated separately because the contamination levels were found to increase from the initial concentration (IC) stage to stages C1 (V. parahaemolyticus concentration from producer to market), C2 (V. parahaemolyticus concentration from during market display), and C3 (V. parahaemolyticus concentration from market to home) (Fig. 4). This increase was influenced by temperature and duration of transit, as demonstrated by the correlation coefficient (Fig. 5). In addition, the correlation coefficient indicated that the amount and frequency of consumption, as well as pathogen contamination levels increase the probability of foodborne illness (Fig. 5).
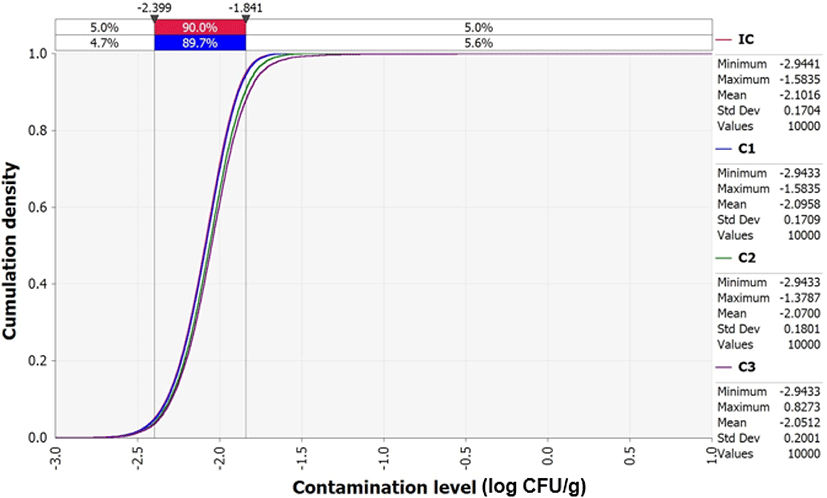
In conclusion, sea squirt samples had relatively low levels of V. parahaemolyticus contamination. The low amount and frequency of sea squirts consumption in South Korea were the main factors that decreased the probability of V. parahaemolyticus foodborne illness. However, according to the predictive models developed in this study, cell counts of V. parahaemolyticus also increased over time, which may in turn increase the probability of V. parahaemolyticus infection if the contaminated sea squirts are distributed or stored for long periods and at elevated temperatures. According to the results of this study, –2.1 Log CFU/g of V. parahaemolyticus contamination level was consumed immediately after harvest of sea squirt, and –1.8 Log CFU/g of V. parahaemolyticus contamination level was consumed approximately 63 h after harvest. Therefore, it is recommended to consume sea squirt as soon as possible as the risk continues to increase immediately after exposure to V. parahaemolyticus.
