Introduction
Shrimp production continues to increase with a rate of approximately 5.4% increase for 2017 to 2021, reaching more than 5.5 million tons in 2021 (Anderson et al., 2019). The Pacific white shrimp (Litopenaeus vannamei) is one of the most important aquaculture species, accounting for about 90% of the total shrimp production (FAO, 2022). In Vietnam, the white leg shrimp was introduced in 2001 and has quickly become a main farmed species due to its faster growth rate and shorter culturing period than the tiger shrimp (Penaeus monodon). In 2020, the white shrimp farming area in Vietnam was approximately 100,000 ha, with a production of > 632,000 tons, accounting for ~67% of the total Vietnamese shrimp production. In shrimp farming, environmental conditions (McGraw et al., 2002), food (Chanratchakool, 2003), and stocking density (Markey et al., 2010; Sookying et al., 2011) are three main factors affecting shrimp growth. Among them, artificial feed (fishmeal products) accounts for 60% of the production cost (Tan et al., 2005). However, fishmeal based on fish exploitation from the ocean has reached its maximal capacity of supply while shrimp farming is expanding (Sasidharan & Venugopal, 2020). Therefore, finding alternative sources for shrimp feed is crucially important and timely for the expansion of shrimp aquaculture.
In recent years, the replacement of fishmeal in shrimp feed formulation has been investigated due to the increasing demand for feed and the limited supply (Leduc et al., 2018; Soares et al., 2020). A few investigations have been conducted to replace fishmeal with animal by-product meals, such as meat and bone meal, blood meal, feather meal, and poultry by-product meal in diets for L. vannamei (De Dios, 2001; Forster et al., 2003; Sasidharan & Venugopal, 2020). However, proteins from terrestrial animal sources in diets are predicted to be reduced substantially in the coming year due to the limited raw materials supply, non-renewability, and other environmental issues (Hodar et al., 2020). The increasing demand and decreasing supply will also increase shrimp feed prices and reduce animal-based protein in commercial shrimp feeds (Davis & Arnold, 1998).
In Vietnam, about 900 thousand tons of catfish by-products, including heads, viscera, trimmings, frames, skin, liver, and roes, could be annually discharged (Nam et al., 2020). This huge amount of protein- and lipid-rich materials can cause serious environmental issues, but can be reused in aquaculture feed production. Indeed, the use of these low-value by-products to produce high-value products such as rich-amino acids and calcium phosphate is essential and timely to replace the fishmeal from wild-caught small fishes, many of which are nearly depleted from the seas and oceans (Han et al., 2018), including in Vietnam (Tran et al., 2022). Alternatively, catfish by-products from industrial processing can provide a vast amount of excellent ingredients such as many amino acids and calcium phosphate, which can be used as supplements in animal feeds (da Silva Bambirra Alves et al., 2021), especially in shrimp feed because the protein content, especially protein amino acids and calcium phosphate are the main nutritional components with a large amount. Fish protein hydrolysate (FPH) from fish by-products can have many applications as a protein source for nutrition in aquaculture (Roslan et al., 2014) because FPH is natural, safe, has high protein content, is non-replaceable amino acids, and is easily absorbed and digested. In addition, it provides an alternative protein source to replace fishmeal partly in aquaculture feed to reduce imported fishmeal. Catfish by-products also contain calcium phosphate compounds (also called hydroxyapatite, HA) that can provide bio-calcium and phosphate sources for shrimps in growth and molting processes (Nam et al., 2019), which can be valuable additives to shrimp feed.
Based on the above considerations, we prepared different mixtures of FPH and HA combined with the commercial diets in this study. These mixtures were evaluated for Pacific white shrimp L. vannamei to assess the suitability, create sources, increase quantities, and diversify protein sources for shrimp feed production. The supplement of these combinations is considered an alternative and increases amounts of protein and minerals. Furthermore, this FPH with rich amino acids and calcium content, phosphorus obtained from catfish by-products is a potential source of nutrients, and can be used to provide alternatives for formulating shrimp diets (Zamora-Sillero et al., 2018). Therefore, we hypothesized that the additives of FHA and HA will increase the growth and survival and harvesting of shrimp culture. Finally, we assessed whether FPH and HA may have antimicrobial activities in the shrimp culture water as bacterial diseases, particularly from Vibrio bacteria have been a key issue in shrimp aquaculture (Aguilera-Rivera et al., 2019).
Materials and Methods
The experimental protocol was performed according to the Guidelines of the Vietnamese Legislation (33/2005/ND-CP and Law 79/2015/QH13) for the use of laboratory animals.
Alcalase was purchased from Novozymes Vietnam Branch. Sera test kits were purchased from the Ministry of Science and Technology, Vietnam. Sulfuric acid (H2SO4, 99%), hydrochloric acid (HCl, 99%), sodium hydroxide (NaOH, 99%), 2,4-dinitroflourobenzene (DNFB: C6H3FN2O4, 99%) were purchased from Sigma-Aldrich (St. Louis, MO, USA). Other chemicals used in this experiment were all of the analytical grades and used as received. FPH and HA were prepared by enzymatic hydrolyzed and then calcined from catfish by-products using the optimum conditions of our previous reports (Nam et al., 2019, 2020). The properties of FPH and HA are shown in Supplementary Figs. S1 and S2, and Table 1. FPH has a high protein content (over 38%), with many essential amino acids shown in Table 2, in which most peptides have an Mw of less than 1,000 Da. The FPH contains eight essential amino acids as well as 12 non-essential amino acids (Table 2). HA nanoparticles have an average size of ca. 150 nm with high porosity and uniformity (Supplementary Fig. S2). The main elemental components in the HA sample, including calcium and phosphorus, with a Ca/P ratio of 1.83. This ratio is quite close to the Ca/P ratio in animal and human bones (Ca/P ratio of 1.67). Besides, there are many trace elements, including Na, Mg, Zn, and Al. Heavy elements such as Cd, Hg, and Pb were not found in the HA sample (lower than the detection threshold ICP-MS) (Nam et al., 2019), indicating that the HA produced is high purity and safe.
Healthy postlarvae L. vannamei were obtained from a local company (Ninh Hoa, Khanh Hoa, Vietnam) and transferred to the hatchery in Nha Trang. Twelve-day-old postlarvae (PL12) had a mean weight of 0.19 ± 0.01 g and a mean length of 16.85 ± 0.34 mm. They were cultured in a hatchery for eight days in a semi-closed recirculating system with a 20% daily water exchange. During this period, shrimps were fed on a commercial feed (Charoen Pokphand Group (CP), 38% protein, and 6.5% lipid, see more details below). In addition, healthy postlarvae 20 days old (PL20) were randomly selected for the experiment.
The mixture of FPH and HA obtained from catfish by-products was added into commercial feeds (pellets for PL20–PL55, CP, Bangkok, Thailand). We used the commercial feeds as the control treatment and the additives of FPH and HA to this to standardise the feed for shrimps. Using artificial feeds for studying the effects of additives of nutrients, exogenous enzymes, probiotics, prebiotics, phytogenics, and immune-stimulants (Chaabani et al., 2020; Encarnação, 2016) is a common method in aquaculture studies. The experimental tank system is shown in Supplementary Fig. S3. Five diets (Table 3) were formulated to contain 38%, 38.5%, 40%, 43%, and 44% crude protein, corresponding to an addition of 0%, 1%, 3%, 5%, and 7% FPH and HA mixture levels into the commercial feeds, respectively. A commercial diet (CP, 38% protein, and 6.5% lipid) was used as a reference (the control treatment or Treatment 1). Practically, HA was first distributed into FPH at a concentration of 60 mL/L. The mixture of FPH and HA was put into a sprayer, well shaken, and sprayed into commercial shrimp feed to reach 38.5%, 40%, 43%, and 44% crude protein, respectively (Treatments 2, 3, 4, and 5; Table 3). The pellets were dried to 11% moisture content before being delivered to experimental tanks for shrimps.
Each treatment had three replicates, which were 250 L fiberglass tanks filled with seawater at a salinity of 30–33 PSU and temperature of 29°C–30°C, tanks were arranged randomly. The stocking density was 250 shrimps/tank.
The seawater was collected from Nha Trang Beach, Khanh Hoa province, and had a salinity of 30–33 PSU. Living organisms, including viruses and pathogens in saltwater, were removed by chlorination at a concentration of 50 g/m3. Chlorinated seawater was aerated vigorously until all chlorine in the water was removed. Subsequently, water was filtered through a microfiltration tube of 1 µm before use.
Seawater in tanks was siphoned and exchanged daily at a rate of 5% of total volumes. Shrimps were fed four times/day throughout the experimental duration. For the first 15 days, shrimps were provided with two hatched Artemia (equivalent to 4 g/m3/time), two times Frippak-150 commercial feed (equivalent to 2–6 g/m3/time). At the age of 20–55 days, shrimps were fed with commercial feed (No. 1 of manufacturer CP, Bangkok, Thailand), and an addition of a mixture of FPH and HA from by-product catfish.
The environmental treatment conditions, including temperature, pH, alkalinity, NO2–, NH4+, dissolved oxygen (DO), total bacteria (TPC), Vibrio bacteria, were monitored. The tank system for shrimp culture is described in Fig. 1.
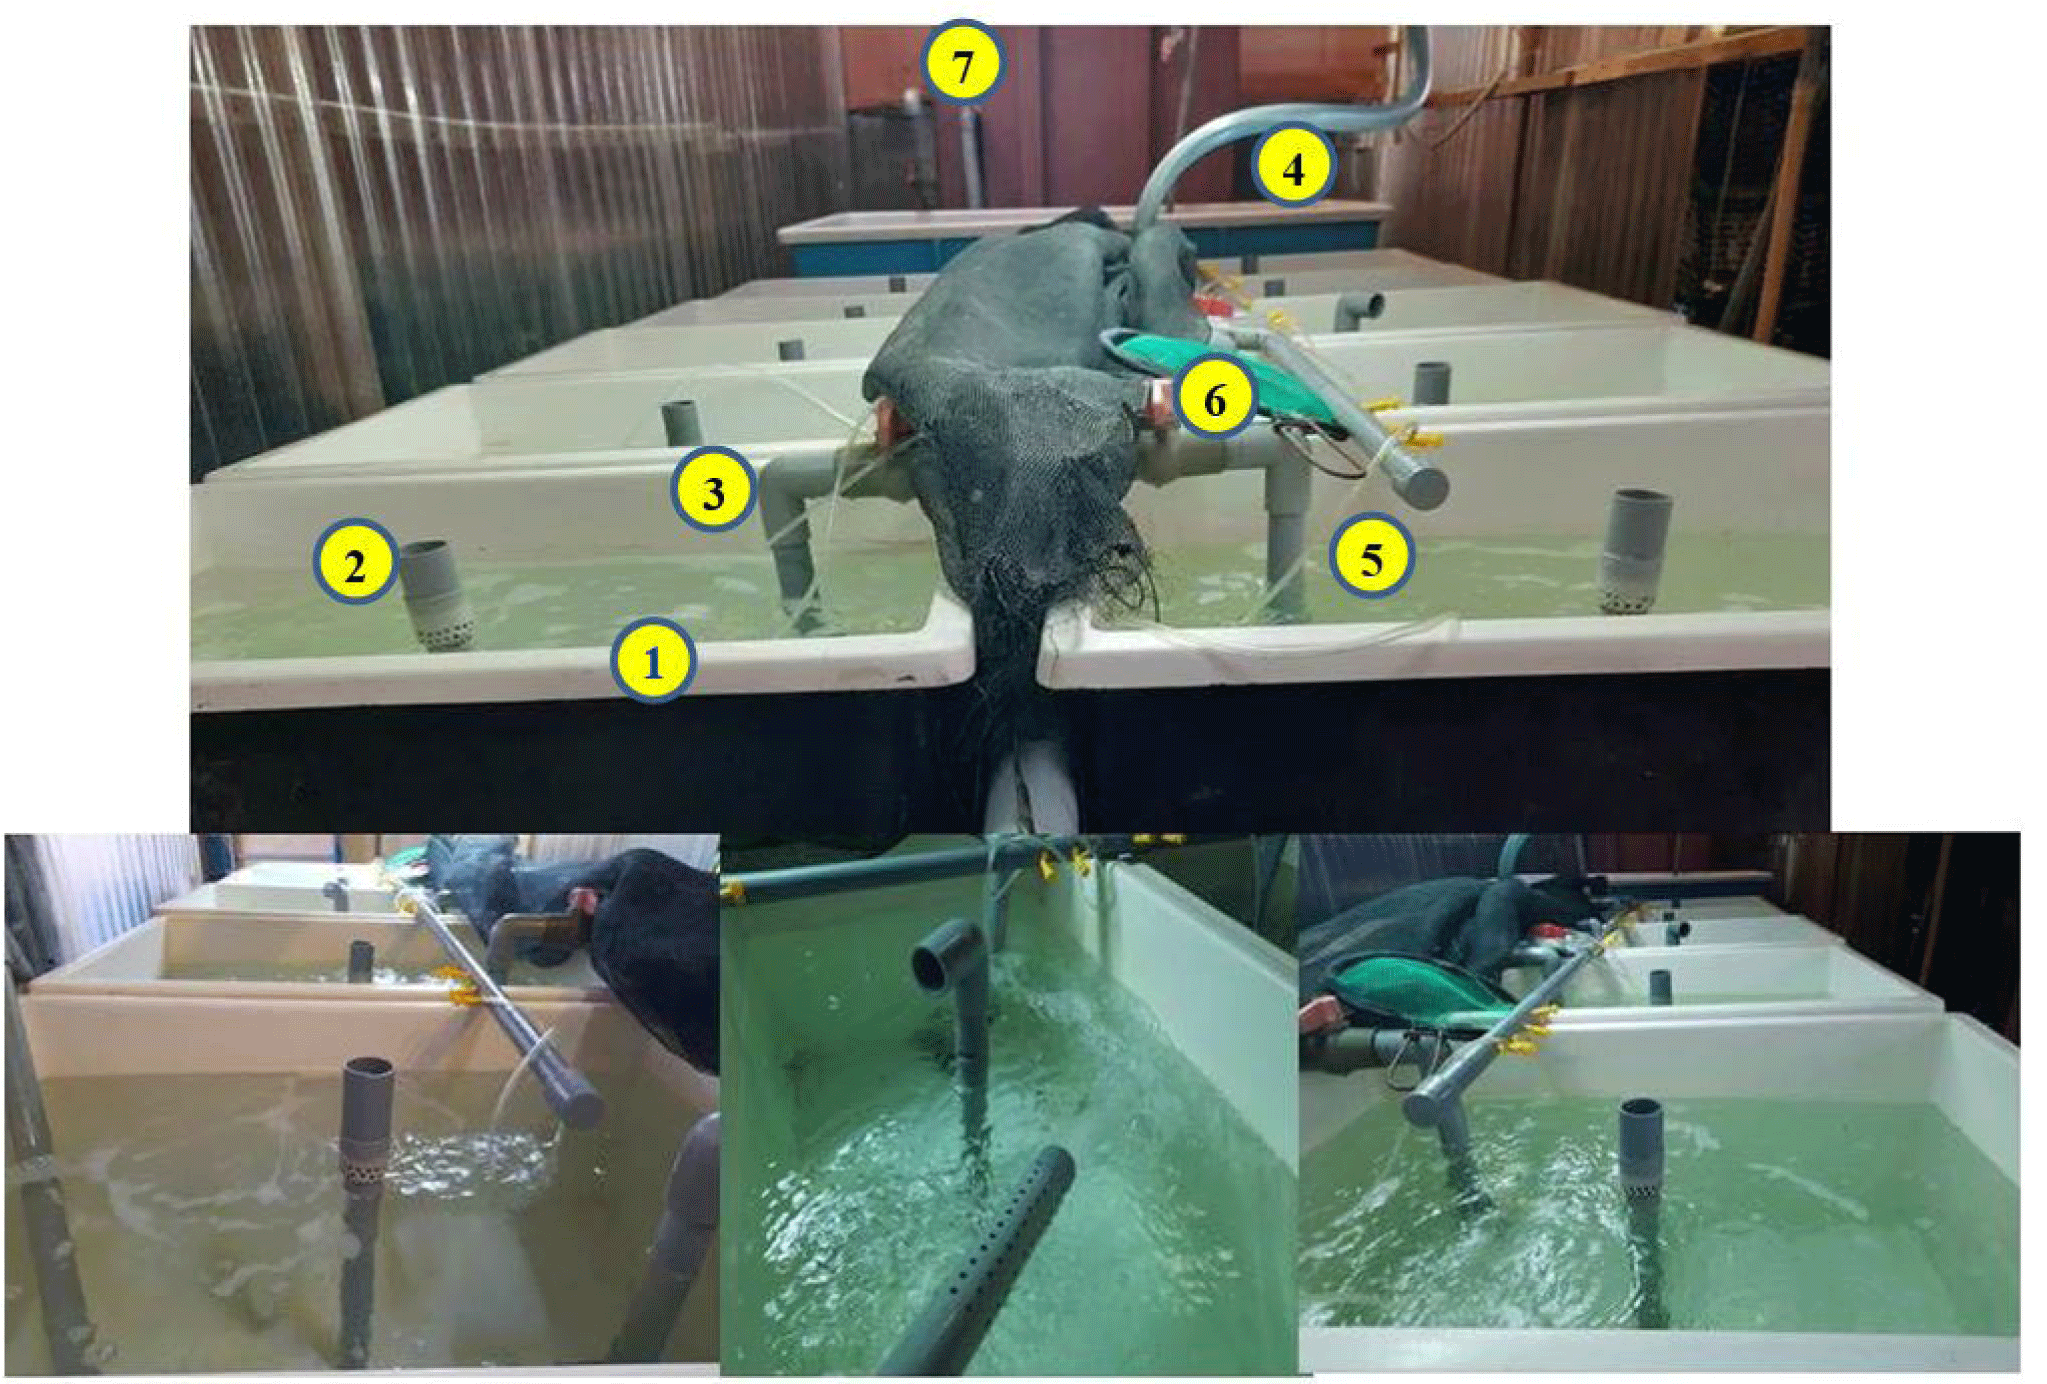
The culture environment was monitored and controlled with physicochemical parameters: temperature, pH, alkalinity, NO2–, NH4+, DO. In detail, the temperature and pH were measured twice a day at 7:00–7:30 am and 3:00–3:30 pm, using a thermometer and a pH meter (HI98127–Hanna, Woonsocket, RI, USA); alkalinity, nitrite, DO were measured every three days. Alkalinity was analyzed by the acidic titration method, and DO was examined by the indophenol blue method. The SERA test kit determined nitrite content. Water samples were collected weekly for the density of TPC and Vibrio bacteria to ensure that the culture water does not affect the growth and development of shrimp. The TPC density was determined by the dilution of culturing water and counting colony-forming units (CFUs) on a nutrient agar consisting of 1.5% NaCl (NA). Similarly, the density of total Vibrio bacteria was determined by counting CFUs on TCBS agar plates (thiosulfate citrate bile salt sucrose). Specifically, the initial water sample (concentration 100) was diluted with 0.85% brine in 3 different concentrations: 10–1, 10–2, 10–3. Subsequently, 100 µL from each dilution of the water sample was spread into the NA or TCBS medium dishes, repeating two times for each concentration. Samples were incubated at 24°C for 24 h, and bacterial density was calculated using the below equation:
To estimate the growth of postlarval shrimps, 20 postlarval shrimps were randomly collected and measured the total length in PL-12 using a microscope with an eyepiece microscope. Furthermore, the length and weight of PL-20, PL-27, PL-34, PL-41, PL-48, and PL-55 were measured using a ruler with an accuracy of 0.1 mm and a small balance with an accuracy of 1 mg. The survival was recorded on day 55 (PL-55).
The yield = the mean harvest weight of shrimp × the harvest density.
We used formalin shocking to test for the shrimp’s health. 50 shrimps PL-55 were collected and transferred to a 1 L beaker containing a formalin solution 100 ppm and followed up their survival for 30 minutes (TCVN 8398: 2012). If the survival rate was 100%, shrimps were considered of good quality.
We further checked the quality of shrimps by scanning the morphology and crystallinity of shrimp shells using a scanning electron scope (SEM, S-4800, Hitachi, Tokyo, Japan) and X-ray diffractometer (XRD, PANalytical, X’Pert-PRO MPD) with a Cu Kα radiation, respectively.
Results and Discussion
Environmental conditions are key factors affecting the success of white-leg shrimp production. Overall, the environmental conditions in the experimental tanks (Table 4) were within suitable ranges for the growth and development of white-leg shrimps (González et al., 2010; Liao & Chien, 2011). Specifically, there was no statistical difference in the mean temperature among the five treatments. Water temperatures varied 29.4°C–29.7°C in the morning and 30.1°C–30.6°C in the afternoon (Table 4), which was within the optimal thermal range of 27°C–31°C for the growth of white leg shrimp (Amaya et al., 2007; Davis & Arnold, 1998; Esparza‐Leal et al., 2010). Likewise, the pH values in the experimental tanks fluctuated slightly. The pH varied between 7.55–8.05 and 7.75–8.15 in the morning and afternoon, respectively. These pH values fall within the suitable pH of 7.5–8.5 for shrimp growth (Markey et al., 2010). The DO in all five treatments was around 5.5 mg/L, which was higher than 5 mg/L, the baseline level of DO for maximal shrimp growth (Boyd & Gross, 1998; Chanratchakool, 2003). The optimum alkalinity for the growth and development of L. vannamei is from 100 to 120 mg CaCO3/L (Hoa et al., 2022). With the measured results, the alkalinity values of the experiments ranged from 103.3–105.8 mg CaCO3/L, which are well-suitable for shrimp growth.
In all treatments, the average NO2– concentration ranged from 0.30–0.55 mg/L and this range was similar across the development stages of postlarvae (Table 4). Surprisingly, NO2– was highest in the control treatment (0.55 mg/L). In contrast, the treatment with 5% wt. of the mixture had the lowest NO2– level (0.30 mg/L). Despite the treatment differences in NO2– levels, the concentration of NO2– was 2–3 times lower than < 1 mg/L, which is suitable for the development of white leg shrimps (Samocha et al., 2004). The results illustrate that the physical and chemical conditions of the rearing water were within appropriate ranges for the survival and growth of L. vannamei (PL-20–PL-55). Notably, the supplement of the FPH and HA mixture in the feed did not have negative effects on the water quality for shrimp culture.
The total bacterial density in the rearing water was significantly different among the five treatments, depending on the culturing duration. After eight days (PL-20), the total bacterial density ranged between 4.0 – 4.8 × 10³ CFU/mL (Table 5) and was not significantly different (p > 0.05) among treatments. After 15 days (PL-27), the total bacterial density in the control (Treatment 1) was approximately two times higher (p < 0.05) than in the other four treatments. TPC was lowest in Treatments 4, and 5 and was significantly lower (p < 0.05) compared to Treatments 2, and 3. A similar pattern of TPC was observed in five treatments after 22 days (PL-34). These results were not surprising as protein hydrolysates have been known to inhibit microbial activities (Kang et al., 2019). Our previous study showed that FPH obtained from catfish by-products showed a free radical scavenging activity (Hassan et al., 2019). When the FPH concentrations were high enough (Treatments 4 and 5), the free radical scavenging activity is most substantial, thus reducing the bacterial density in the culture environment (Nam et al., 2019). After 27 and 36 days (PL-41 and PL-48), TPCs of all five treatments increased substantially to 20 × 103 – 44 × 103 CFU/mL, which were approximately five to ten times higher than the initial TPCs in the treatments at the start of the experiment (PL-20), yet the difference in TPCs between the control and other treatments became less obvious, but Treatments 4 and 5 also showed the lower TPCs. This might suggest the adaptability of some bacteria to the presence of FPH, which needs further investigation. However, TPCs were substantially reduced at the end of the experiment, varying between 8 – 9.50 × 10³ CFU/mL, for unknown reasons. Regardless of the TPCs variations, the total bacterial density during the entire culture period was far lower than 107 CFU/mL, the lowest density, which may negatively affect the shrimp growth and development (Anderson, 1993).
Similar to the TPCs, Treatments 1 and 2 had the highest Vibrio density, 0.14 × 10³ CFU/mL after eight days of stocked (PL-20), and was significantly different (p < 0.05) compared to Treatments 3, 4, 5 (Table 6). A similar pattern was observed after the 15 days of stocked (PL-27) in which the density of Vibrio bacteria was 0.58 × 10³ CFU/mL in Treatment 1 and significantly different (p < 0.05) compared to other treatments. On day 36 (PL-48), the density of total Vibrio bacteria in 5 treatments increased considerably with 2.57–3.81 × 10³ CFU/mL and accounted for 6.3%–9.1% of the total bacterial number in the culture environment. This result was similar to the pattern of TPC. The results of PL-55 showed that Treatments 4 and 5 had the lowest Vibrio density, 0.09 × 10³ CFU/mL, and it was significantly different (p < 0.05) compared to Treatments 1 and 2 (Table 6). It is also due to the free radical scavenging activity of FPH, as described above. Besides, the density of Vibrio bacteria was lower than 6.5 × 10³ CFU/mL, which is 54–72 times higher than the total Vibrio bacteria found in our experiments, which would not affect the health of farmed shrimps (Li & Chen, 2008).
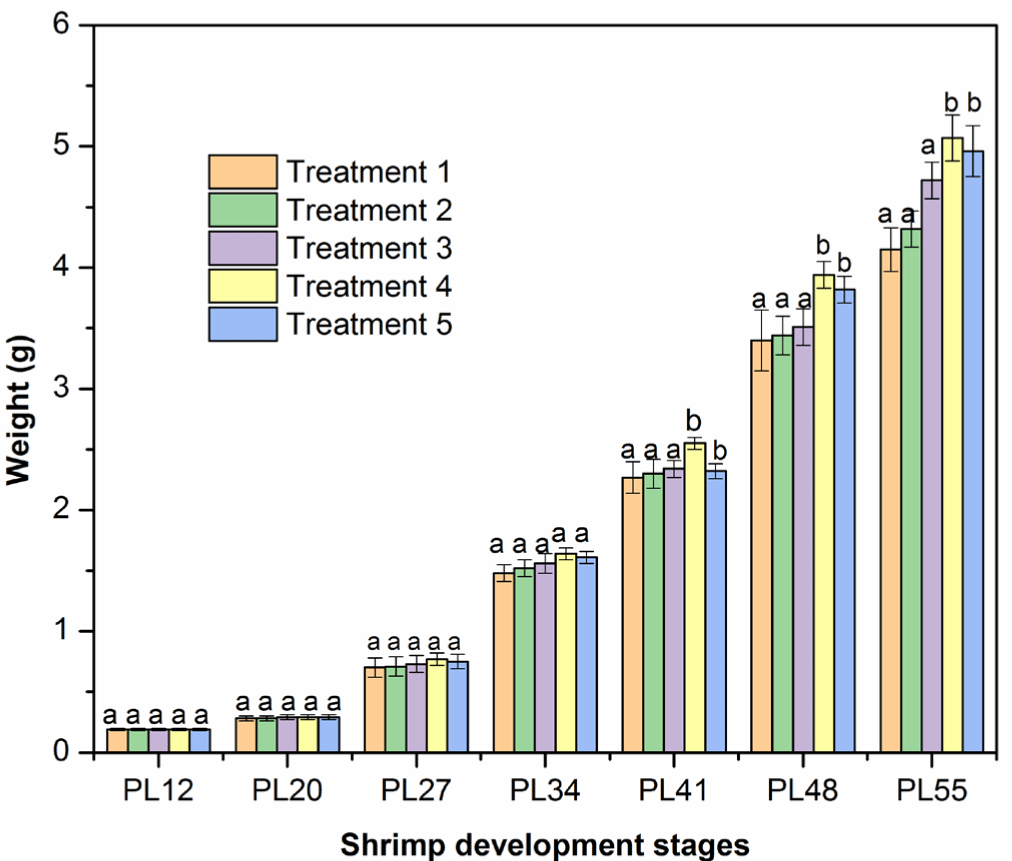
Shrimp (PL12–PL27) weight did not differ among five treatments after two first weeks cultured with an addition of FPH and HA mixture, as indicated by no significant differences (p > 0.05) in the mean weekly weight gain in the five experimental treatments. In detail, the shrimp weight increased between 0.24 and 0.44 g/week. In later stages (PL41–PL55), the weekly weight gain was higher than PL12–PL27 (Fig. 2). The mean weekly weight gain ranged between 0.82 and 1.20 g/week, respectively, PL34 and PL55, which is in agreement with the findings in the previous studies (Amaya et al., 2007; Araneda et al., 2008; De Dios, 2001; Markey et al., 2010). Importantly, the mean weekly weight gain was highest in Treatment 4 (adding a 5% mixture of FPH and HA or a total of 43% crude protein content) than those in Treatments 1, 2, 3, and 5 (Fig. 2 and Table 7, p < 0.05). The positive effect of FPH and HA in Treatment 4 on shrimp growth was generally more pronounced toward the end of the experiment. In general, protein hydrolysates contain short-chain and low molecular weight proteins, promoting the absorption of nutrients (Hou et al., 2017). Indeed, a previous study shows that L. vannamei had a higher apparent digestibility coefficient (ADC) of essential amino acids (AAs) and energy from the protein hydrolysates of poultry by-products, promoting shrimp growth (Soares et al., 2020). L. vannamei may have a similar ADC of AAs and energy from protein hydrolysates of catfish by-products. The higher ADC of AAs from protein hydrolysate may be the essential factor to enhance the weight gain of L. vannamei in our study (see e.g., Soares et al., 2020). It is also recommended to test whether the addition of FPH and HA may also balance the AAs in the diet, which may be another mechanism for the faster growth rate of L. vannamei (Jin et al., 2019). Interestingly, adding more than 5% mixture to the feed did not increase the weekly weight gain further, suggesting that the maximal protein requirement could be met at around 43% crude protein content.
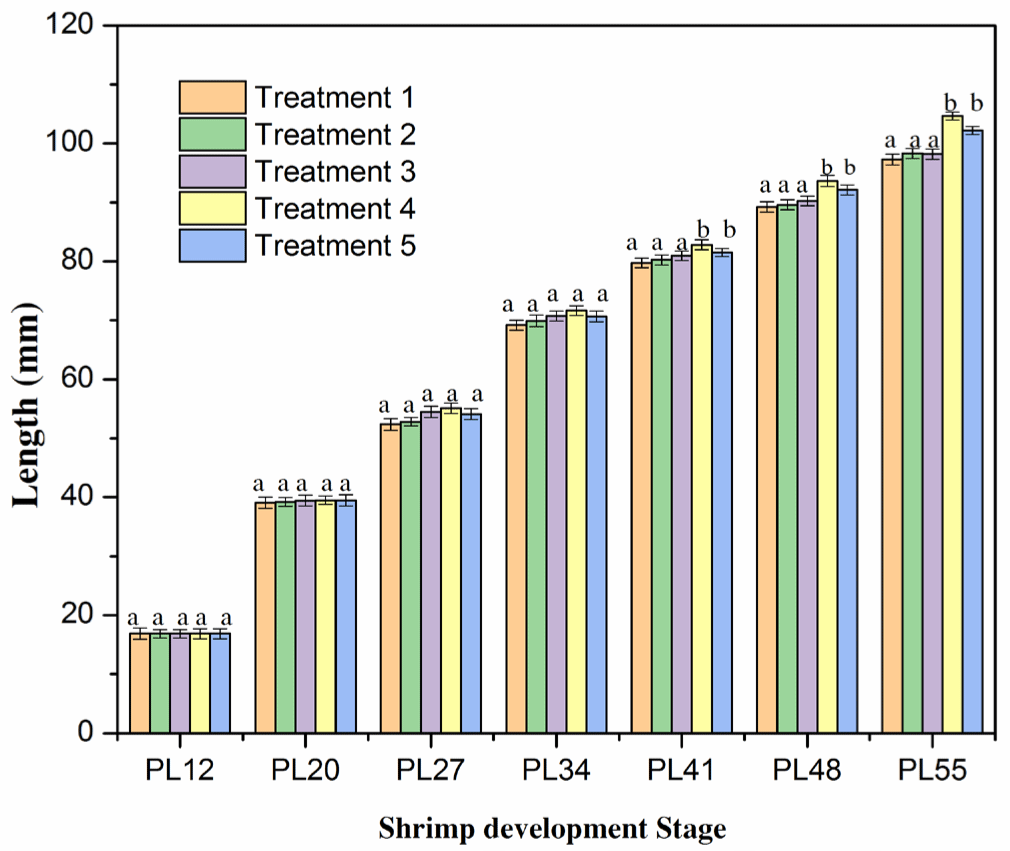
The total length of shrimps in all treatments was not significantly different (p > 0.05; Fig. 3 and Supplementary Fig. S3) after the two weeks of culture (PL12–PL27). It varied from 16.85 to 55.10 mm. The increase in the length was consistent with the pattern observed for the growth rate in the shrimp weight (as shown in Fig. 2). At these stages, the growth of shrimp length was relatively even in the five treatments. These results were in agreement with the findings in previous studies on shrimp length (Ariadi et al., 2019; Wyban et al., 1995). In the latter stage (PL34), the total length increased faster, but it was not significantly different among the five treatments (p > 0.05; Fig. 4). The total lengths were 69.20, 69.90, 70.75, 71.65, and 70.65 mm for Treatments 1, 2, 3, 4, and 5, respectively. However, the length growth rate of P41–PL55 shrimps was considerably faster in Treatments 4 and 5 than in other treatments. It resulted in a significantly higher (p < 0.05) growth rate of shrimps in Treatments 4 and 5 than in Treatments 1, 2, 3. The lengths of shrimps were 79.75, 80.25, 80.95, 82.80, and 81.50 mm and 97.28, 98.30, 98.22, 104.65, and 102.18 mm in Treatments 1, 2, 3, 4, and 5, respectively. The highest growth rate in the shrimp length of Treatment 4 was consistent with the weekly shrimp weight difference and may be explained by similar mechanisms.
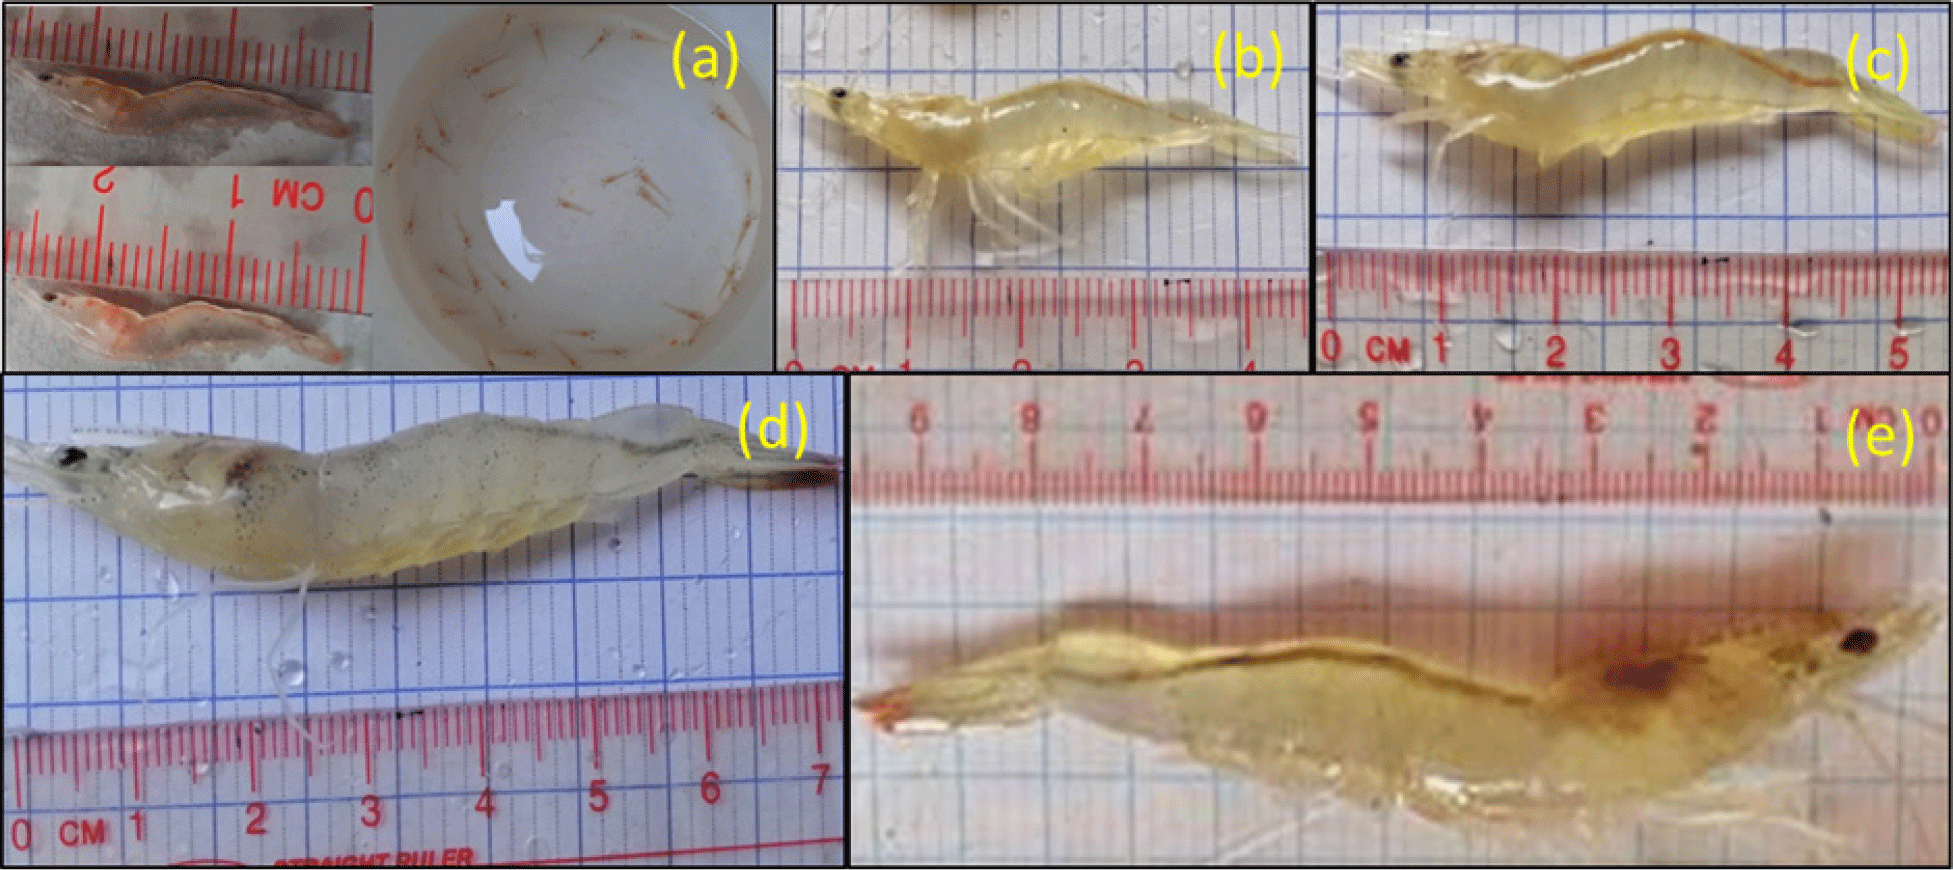
Among the treatments of PL55, the survival rate was highest in Treatment 1 (98.4%) and Treatment 2 (98.6%) and was slightly lower in Treatments 3 and 4 (97.9%). Treatment 5 showed the lowest rate of 96.9%. However, the survival rate of all five treatments was not significantly different (p > 0.05). Detailed information on the survival rate of all five treatments is presented in Table 7 and Supplementary Fig. S4. This survival rate is comparable to the survival of shrimps 34–35 days old (~98.1%) with a stocking density of 1.760 shrimps/m3 (Samocha et al., 2004) and shrimps 81 days at a stocking density of 37.5 shrimps/m3 (Amaya et al., 2007). This result can be explained by density effects on survival, as in our study, shrimps were cultured at a lower density than the rearing density in previous work (Amaya et al., 2007). Indeed, previous studies have shown that the culturing density of L. vannamei negatively correlates with survival (Appelbaum et al., 2002). Moreover, survival might be affected by lower main ion concentrations such as potassium, which was not the case in our study.
The yield of PL55 was highest in Treatment 4 (3.52 kg/m2) and lowest in Treatment 1 (2.45 kg/m2). However, Treatment 4 was significantly different (p < 0.05) compared with Treatments 1, 2, 3, but it did not differ (p > 0.05) compared with Treatment 5. The results of survival and yield of shrimps indicate that the supplement of a mixture of FPH and HA from catfish by-products in the feed may improve the production of L. vannamei compared with the non-added treatments. The mixture of FPH and HA in the feed is suitable for shrimp growth. Furthermore, the supplementation did not affect the culture environment, leading to higher yields than non-added treatments.
Checking the quality of PL-55 post-harvest shrimp and shrimp shells is essential to classify, evaluate shrimp, and select preferred containers and shipping methods without reducing shrimp quality. PL-55 was shocked in formalin solution 100 ppm for 30 minutes, resulting in 100% alive shrimp. This suggests that shrimp had a good health and quality.
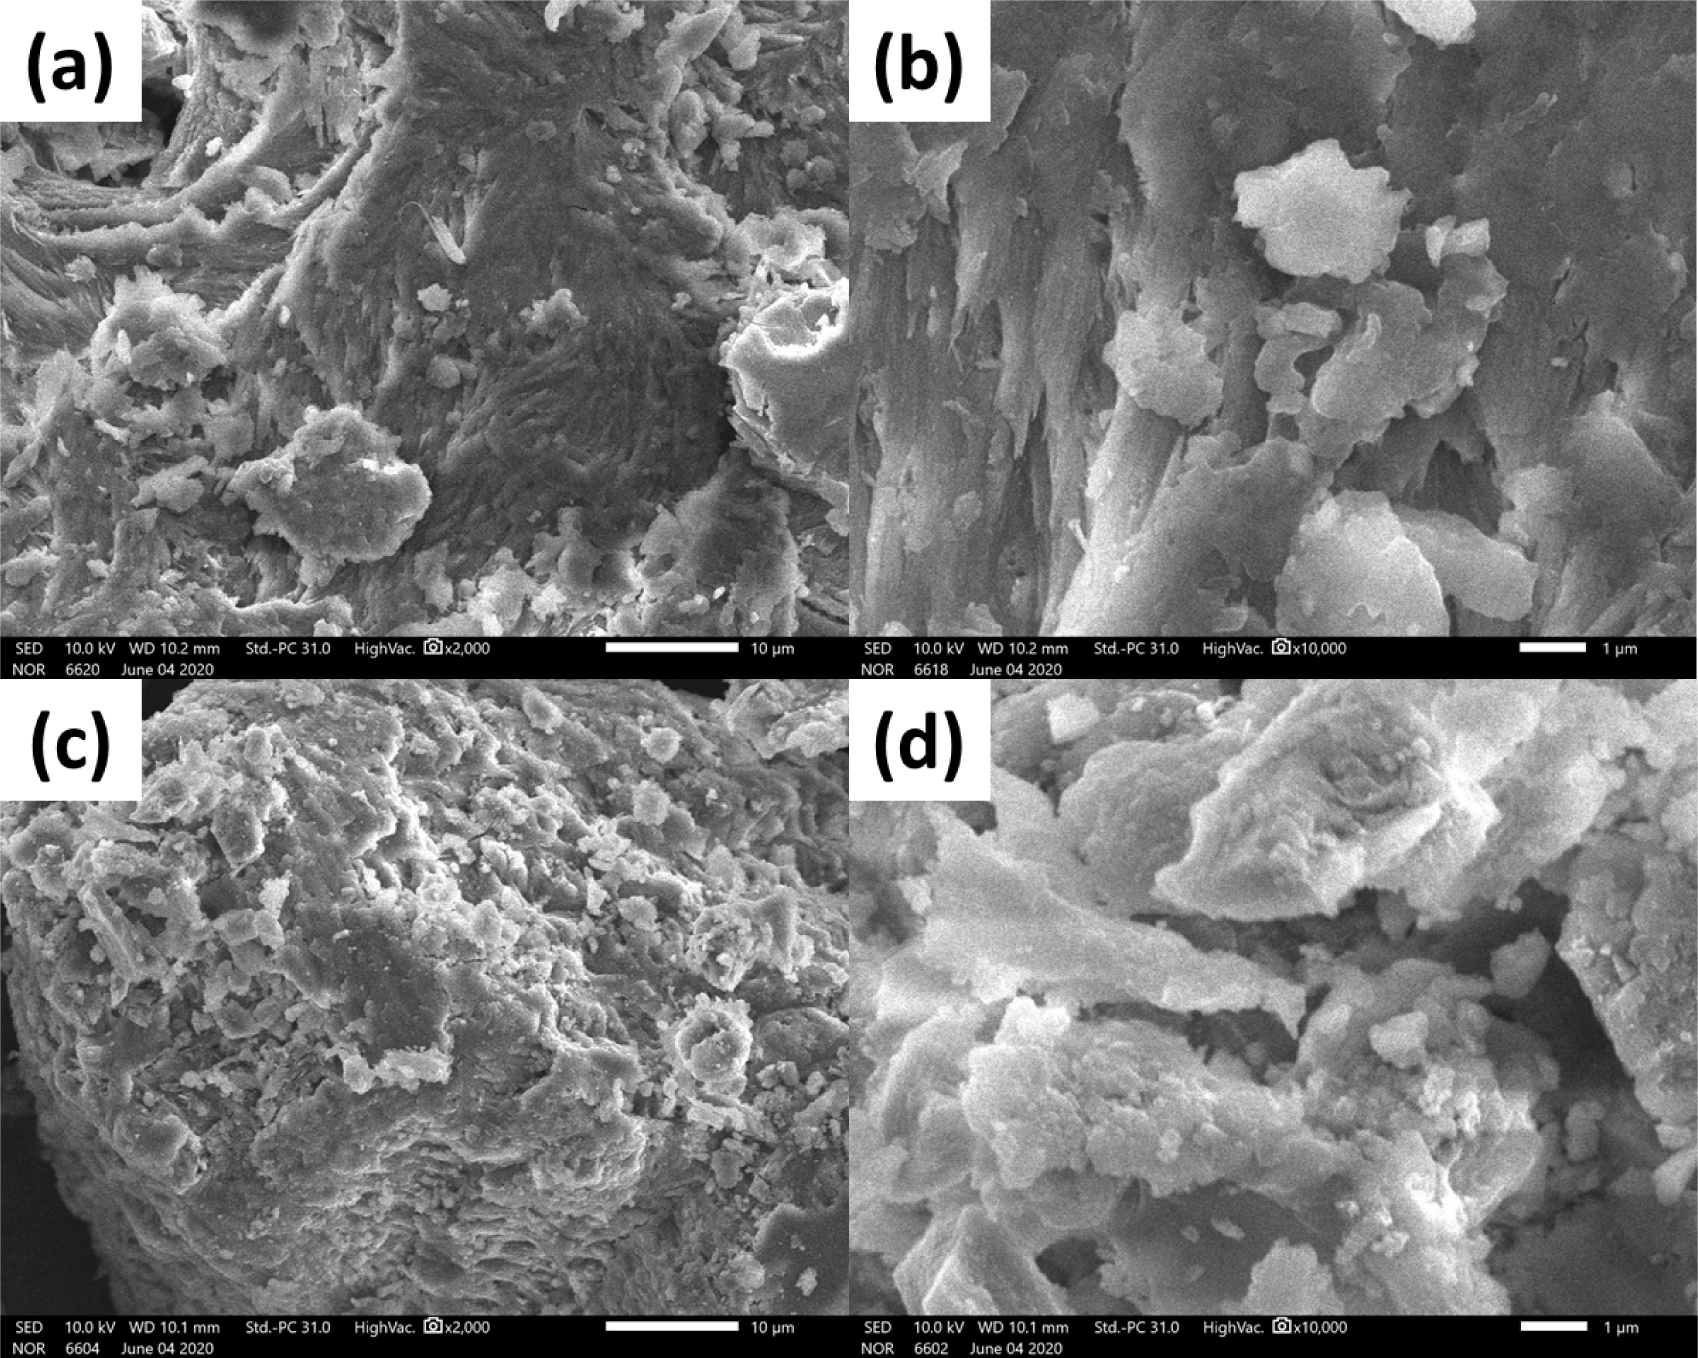
The supplement’s impact was confirmed by the shrimp shells’ different morphology and surface structure after treating with or without any supplement. Fig. 5 shows SEM images of shrimp shells peeled from shrimps treated without a supplement (Treatment 1) and with a supplement (Treatment 4). The surface morphology of both shell samples at different magnifications consisted of amorphous polymers (chitin and protein) layers and mineral particles. However, more particles were clearly observed in the sample taken from Treatment 4 (Fig. 5c and 5d). This phenomenon may be attributed to HA nanoparticles, which could be used as calcium sources to form the minerals in the shrimp shells. This different structure is also observed in X-ray diffraction measurements.
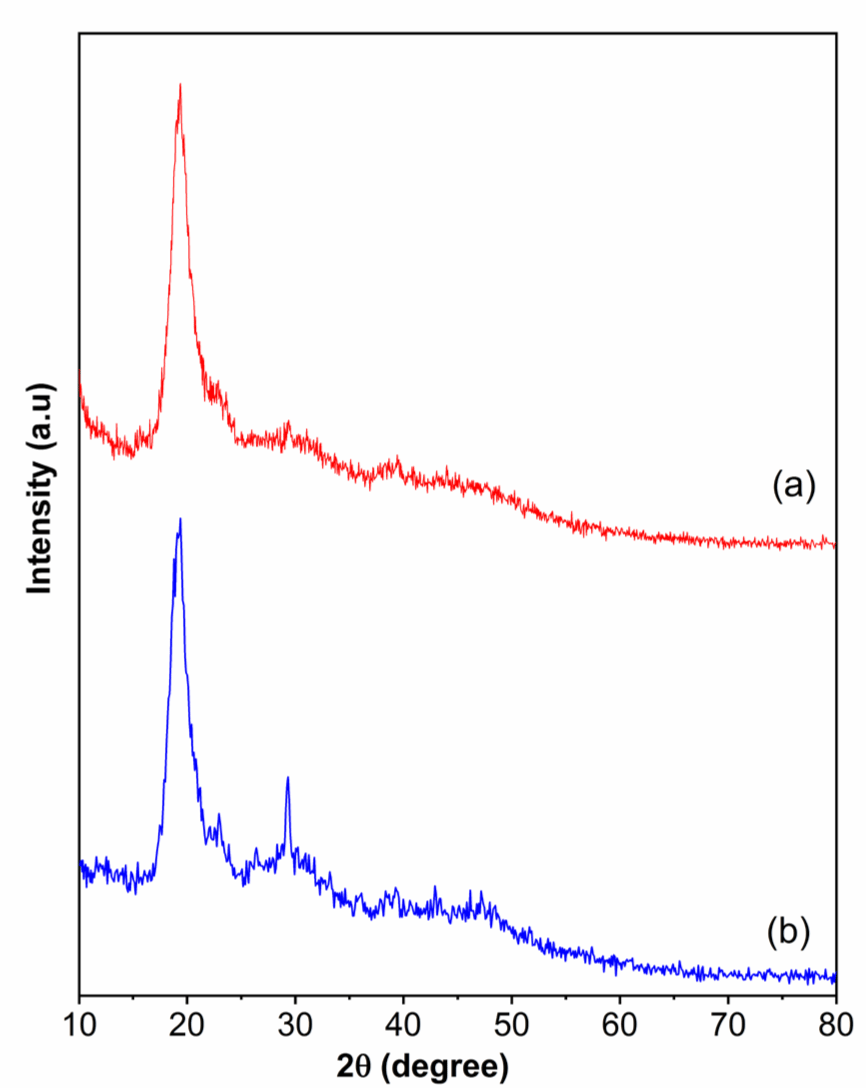
XRD patterns of shrimp shells obtained from Treatments 1 and 4 are presented in Fig. 6. Both samples show a prominent peak that appeared at 2θ 20° due to the crystallinity of the chitin fraction of shrimp shells. Besides, there is a specific peak at 2θ around 30° (Treatment 4), due to a large amount of CaCO3 in the shrimp shells (Sahebian et al., 2007). This finding is in agreement with the SEM results.
Conclusion
The mixture of FPH and HA obtained from catfish by-products was suitable for adding in feeds for postlarval shrimps (L. vannamei). The supplement promoted faster shrimp growth and did not negatively affect the environmental conditions of shrimp culture. After 35 days of culturing L. vannamei shrimp from PL20, the average weekly gain in weight and length was 0.97 g and 7.37 mm (Treatment 4), which is higher than that of the control treatment (Treatment 1). Vibrio density in culture water was at controlled levels.
