


Background
The marine medaka, Oryzias dancena, is nonindigenous to South Korea and is a bony fish with high tolerance to salinity because of its salinity adaptation mechanisms (Inoue and Takei, 2003). In addition to the studies of this euryhaline species, under various salinity conditions, it has been the subject of extensive ecotoxicogenomic research; this should extend the use of the marine medaka as a laboratory model for assessing its responses to salinity changes. Its viability under conditions of maximum tolerable salinity has been measured, and incubation time of fry was assessed by its ability to adapt to various salinity (Cho et al., 2010). This species was recently selected by iMLMO (Institute of Marine Living Modified Organisms, Pukyong National University, Busan 608-737, Korea) for use in a project to evaluate living modified organisms. Consistent with this purpose, detailed information on its biology is being collected (Song et al., 2009; Nam et al., 2010), particularly related to its early gonadogenesis, sexual differentiation, early ontogenesis, embryogenesis, and exceptional capacity for hyperosmoregulation and hypoosmoregulation. In addition, Kim et al. (Song et al., 2009) suggested that this species has a short interval between generations with spawning possible only for 60 days after hatching. A study of the effects of clove oil and lidocaine HCl on the species by Park et al. (2011) has contributed to the safe laboratory handling of this fish, which is required in many studies. The research discussed above has demonstrated that the marine medaka has the ideal characteristics for an experimental animal (Song et al., 2009; Nam et al., 2010; Park et al., 2011).
Identification of individuals is essential in studies of fish growth, migration, and mortality and in stock identification and stock selectivity for tracing particular fish populations (Crossland, 1980). Although short-term tag retention may suffice for some experiments, the effect of a tag on fish survival, behavior, growth, and recognition and the costs of the tagging technique need to be considered. However, traditional external tags (such as spaghetti or dart tags) are commonly lost soon after deployment (Crossland, 1980; Bergman et al., 1992) and can affect growth or survival (Crossland, 1976; Tong, 1978; McFarlane and Beamish, 1990; Serafy et al., 1995). Furthermore, these types of tags can only be read by recapturing the fish.
Devices that are located internally but are readable externally, such as acoustic tags, are often limited by short battery life or retention (Ralston and Horn, 1986), and sample sizes are limited by the expense involved. Problems associated with biological compatibility, reliability of identification, fouling of the tag by algae (Jones, 1987; Barrett, 1995), tag retention (Crossland, 1976; Parker, 1990), and external visibility of such devices have reduced confidence in the interpretation of results of in situ studies of reef fish ecology. A less frequently used approach is intrinsic identification, whereby cohorts are identified by size (Jones, 1987; Forrester, 1990) and individuals are recognized by variation in natural markings (Thompson and Jones, 1980; Connell and Jones, 1991) or wound scarring.
The latter approach has cost advantages, so does not influence behavior, but is subject to potentially substantial levels of observer error. Furthermore, many fish species lack unique natural markings and cannot be recognized without an artificial means of verifying identity. Passive integrated tag (PIT) method is the most commonly used. However, the body size of marine medaka is similar to that of PIT chips, so marine medaka is unsuitable for tagging PIT chips. The visible implant fluorescent elastomer (VIE) tag was developed primarily for tagging large batches of small or juvenile fish. The VIE system comprises a viscous liquid elastomer that sets to a pliable solid over a period of hours following application. The elastomer can be injected into transparent or translucent tissues to form a permanent biocompatible mark. When exposed to UV light and viewed through an amber filter, the compound fluoresces brightly. The tag size can easily be varied according to the requirements of the researcher and the size of the fish to be tagged. Thus far, the system has been used for the identification of groups or cohorts of juvenile reef fish (Frederick, 1997) and salmonids, but is also proving potentially effective in controlled laboratory studies of adult blue gills (Dewey and Zigler, 1996). As an externally visible but sub-dermally situated marking system, VIE tags are potentially able to eliminate many of the problems associated with other methods.
Tagging, weighing, measuring standard length, preparing fish for live shipment and transport, injecting vaccines and antibiotics, and collecting blood are causes to increasing stress (Dewey and Zigler, 1996). Stress responses can include physiological changes such as oxygen uptake and transfer, metabolic and hematological changes, mobilization of energy substrates, reallocation of energy away from growth and reproduction, and suppressive effects on immune functions (Schreck et al., 2001; Redding and Schreck, 1983). These changes can increase disease susceptibility leading to increased mortality and subsequent economic losses (Schreck et al., 2001; Redding and Schreck, 1983). So, analysis of stress response can roughly examine the cause of mortality by tagging. The steroid hormone cortisol is widely accepted as an indicator of stress in fish, generally increasing after exposure to physical stressors (Schreck et al., 2001). Circulating cortisol levels are typically measured to determine the stress status of an individual fish (Redding and Schreck, 1983). Alternatively, whole-body cortisol levels have been used to assess the stress responses of the developing salmonids and flatfish because their blood volumes are insufficient to allow for the measurements of circulating cortisol (Redding and Schreck, 1983). Similarly, whole-body corticosteroids have been measured in smaller adult fish, including the three-spined stickleback, Gasterosteus aculeatus (Pottinger et al., 2002), and the zebrafish, Danio rerio (Pottinger and Calder, 1995). In this study, we compared various tag colors for readability under visible and UV lights and assessed the likelihood of tag- or handling-related mortality, the retention rates of VIE tags placed, and the stress response in various body sites of marine medaka. So, suitability of VIE tag method in marine medaka was investigated by analysis of readability, mortality, and stress response.
Methods
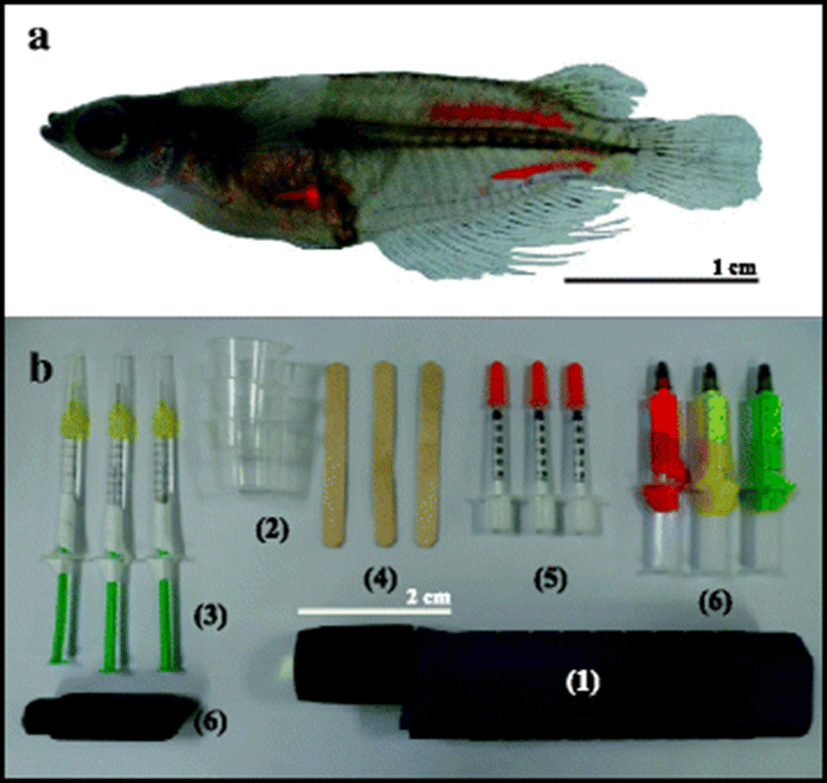
The fish used in this experiment were adult marine medaka, O. dancena (mean body length ± SD 35.1 ± 3.42 mm; mean body weight ± SD 54.4 ± 1.83 mg; age 10 months after hatched). Injection of the VIE tags into the treatment fish, and handling of the control fish, occurred on 16 February 2012. Following to the method of Park et al. (2011), all fish were anesthetized in 800 ppm lidocaine hydrochloride/NaHCO3 at a water temperature of 10 °C. The fish were sedated until they were completely immobile and then individually removed from the anesthetic solution, rinsed in fresh water, and placed on a flat surface for tagging.
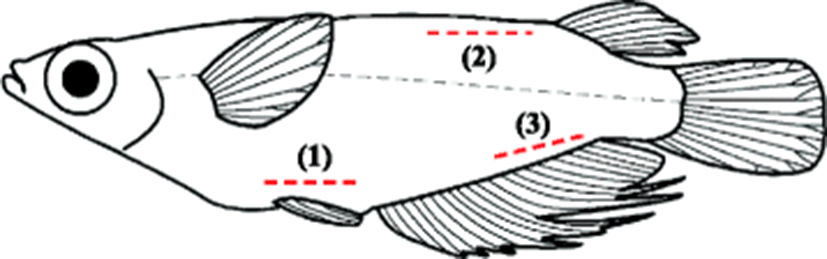
Per group of 50, the fish were individually tagged with yellow, red, or green elastomer (Northwest Marine Technology Inc., Shaw Island, Washington, USA) at three body locations (Figs. 1 and 2a): (1) the surface of the abdomen, (2) the inside surface of the back, and (3) the surface of the caudal vasculature, and all experimental groups were triplicated. Control fish (50) were anesthetized but not marked. We used the VIE hand injection Master Kit (Northwest Marine Technology Inc., Shaw Island, Washington, USA) for tagging the fish. Following the kit protocol, the elastomer and curing agent were mixed at a ratio of 10:1 and the prepared elastomer was injected as a liquid (0.3 mL per site). The instruments used are shown in Fig. 2b. Tagged fish were divided into different tag colors and injection sites in tanks. The fish were held in 18 flow-through fiber-reinforced plastic tanks (50 × 20 × 20 cm; water volume 2 L) supplied with filtered seawater. The bottom of each tank was fitted with a black sheet to facilitate for observation of the tag. The flow rate was 2 L/min/tank, and the mean water temperature was 26 ± 2.5 °C. A common day–night cycle was established, and all tanks were covered with netting to retain the fish in the tanks. Throughout the 12-month trial, the fish were fed daily to satiation using a dry commercial flounder feed (Agribrand Furina Korea Co., Korea) that was alternated with a formulated Artemia diet. The food was placed on the aquarium floor so that it could be eaten within 2 h.
The survival rate, tag retention, and detection of tags (under visible and UV lights) were recorded at 2-month intervals. The tanks were checked daily for dead fish, which if present were removed and fixed in 10% neutral formalin solution. The marking with the various colors at the three sites was observed visually from a distance of 30 cm under ambient visible light and UV light and measured the differentiation rate of each group after 1 month. Tag retention data for the dead fish were used to calculate the percent tag retention up to the date that the fish died, but were not used in the subsequent calculations (Zerrenner et al., 1997).
To observe the effects of stress on the whole-body cortisol, glucose, and lactic acid levels of fish under VIE tag injection, we injected the VIE tag in the abdomen, the back, and the caudal vasculature, respectively, and 90 samples were used in each site. The stress responses of the experimental fish were measured at 0, 1, 6, 12, 24, and 48 h. Fifteen samples were used in each measured time. Control fish were not injected VIE tag, but their cortisol levels were measured. For these measurements, 150 fish were used in each experimental group, and no distinction was made between male and female fish. We measured the whole-body cortisol, glucose, and lactic acid levels of the control fish before the experiment. Individual fish were blotted onto paper towels to remove excess water, immediately frozen in liquid nitrogen for 10–30 s, and placed in individual 5.0 mL plastic screw cap centrifuge tubes. The samples were stored at − 80 °C until we extracted the cortisol, glucose, and lactic acid. The term “whole-body cortisol” is used to describe the portion of corticosteroid extracted and measured with a cortisol-specific radioimmunoassay (Pottinger et al., 2002). Whole-body glucose concentration was analyzed according to the methodology of Raabo and Terkildsen (1960) (Kit 510, Sigma, St Louis, MO, USA), where the production of H2O2 by glucose oxidase in the presence of o-dianisidine was evaluated as an absorbance increase at 450 nm. The lactic acid concentrations were analyzed using blood automatic analysis (Boehringer Mannheim Reflotron, Germany).
All measured data were induced by triplicate experiments from all experimental samples. Differences in survival rate between control and experimental groups were assessed using the t test (Cody and Smith, 1991), and the tag retention rate (%) among tagging sites was assessed using a one-way ANOVA and Duncan’s multiple range test (Duncan, 1955). The differences were considered to be significant at a probability of 0.05.
Results
Table 1 shows the retention rate of the VIE tags at each site for marine medaka, O. dancena. During the experiment, there was no difference in tag retention among the various tag colors for the abdomen site, but the tag retention rate for this site was different from that of the back and caudal vasculature sites. For the abdomen site, the retention (%) of the elastomer at 1 month were 57.4 ± 3.26 for red, 77.6 ± 1.11 for green, and 74.3 ± 1.48 for yellow but at 6 months were 57.3 ± 3.74 (red), 80.7 ± 2.10 (green), and 75.1 ± 1.68 (yellow). And in this term, the green and yellow values were significantly higher than the red value. However, the retention rate of the abdomen site was not affected by color. In summary, the retention rate for red was 67.2 ± 3.05, for green was 79.5 ± 1.96, and for yellow was 70.4 ± 1.21. For the back site at 1 month, the retention rate for red was 99.3 ± 0.16 and for green was 94.7 ± 0.85. The retention rate for yellow was 94.9 ± 0.80. After 9 months, the values had declined to 93.4 ± 0.67, 89.8 ± 1.79, and 95.5 ± 0.73 along red, green, and yellow, respectively. These values show that the VIE was removed from the tagged site by the time in each site. In conclusion, at 12 months, the tag retention rates for the back were 90.5 ± 1.31, 94.4 ± 0.74, and 94.6 ± 0.94 for the red, green, and yellow elastomers, respectively. For the caudal vasculature, there were no significant differences (P < 0.05) among the elastomer colors (red, 99.0 ± 0.22; green, 99.3 ± 0.10; yellow, 95.4 ± 0.67), but at the end of the experiment, the values were 96.6 ± 0.66, 97.2 ± 0.38, and 95.6 ± 0.86, respectively. Among the three colors, the tag retention rate for the back was the highest (P < 0.05), followed by that of the caudal vasculature tags. The abdomen tag retention rate was the lowest among the tagging sites.
Samples tagged with VIE were investigated. Values are mean ± S.E. (n = 50). The experiment was performed in triplicate. The values in each column that do not share a common superscript are significantly different from one another (P < 0.05)
We measured the visual differentiation of the tags using two detection methods (visible and UV lights) (Tables 2 and 3). During 1 min, the VIE tags were initially observed using visible light at 30-cm distance from the experimental fish. Table 2 shows the dead fish and those that eliminated the VIE tags were excluded from the analysis. For the abdomen site, the capacity to detect for the red and green tags was significantly greater than that for the yellow tags (P < 0.05). At 1 month, the detection rate of the red tags (%) was 60.0 ± 4.21, for the green tags was 84.0 ± 3.67, and for the yellow tags was 73.9 ± 4.55. After 12 months, the values were 65.2 ± 4.41, 85.9 ± 2.38, and 68.5 ± 1.53, respectively, indicating that the red and green colors were more easily detected (P < 0.05). For the back site at 1 month, the detection rate (%) of red tags was 100, for green was 96.0 ± 2.11, and for yellow was 97.8 ± 4.34. After 12 months, tag detection were 92.1 ± 4.61 and 94.0 ± 1.68 for the red and green tags, respectively, and for the yellow tags was 97.3 ± 0.23. For the caudal vasculature at 1 month, the detection rates (%) of red and green tags were 100, respectively, but for the yellow tags was 96.3 ± 1.11. At 6 months, the detection rates (%) were 97.4 ± 2.33, 96.9 ± 2.11, and 96.3 ± 1.97, respectively (P < 0.05). At the end of the experiment, the detection rates (%) were 98.8 ± 1.72, 98.1 ± 1.08, and 96.3 ± 2.89, respectively. Table 2 shows that abdomen tags were less well detected than back and caudal vasculature tags.
Samples tagged with VIE were investigated. Both dead samples and eliminated VIE tags were excluded from the analysis. Values are mean ± S.E. (n = 50). The experiment was performed in triplicate. The values in each column that do not share a common superscript are significantly different from one another (P < 0.05)
Samples tagged with VIE were investigated. Both dead samples and eliminated VIE tags were excluded from the analysis. Values are mean ± S.E. (n = 50). The experiment was performed in triplicate. The values in each column that do not share a common superscript are significantly different from one another (P < 0.05)
Table 3 shows the results for tag differentiation using the UV light for detection of the VIE tags at each site in the experimental fish. The observation protocol was as described above. For the abdomen site, the detection of the red and green tags was significantly greater than for the yellow tags (P < 0.05). At 1 month, the detection rate (%) for the red tags was 88.0 ± 2.61, for green was 92.0 ± 1.73, and for yellow was 86.9 ± 3.11, indicating that the red and green tags were more readily detected than the yellow tags (P < 0.05). After 6 months, this had not changed significantly, and at the end of the experiment (12 months), the detection (%) of the red, green, and yellow tags were 87.2 ± 3.02, 95.0 ± 2.97, and 84.0 ± 2.11, respectively, showing that the yellow tags were least detectable when observed by the UV light (P < 0.05). For the back site, the tag detection rate was 100% for the three colors, while at 12 months, for the red tags was 100.0, for the green was 96.9 ± 1.61, and for the yellow was 98.3 ± 0.57 (P < 0.05). These results indicate that red tags were significantly more readily detected than green and yellow tags (P < 0.05). In addition, the back tags were detected more easily relative to those in the abdomen site. On the caudal vasculature, the detection rate (%) of all the color tags were 100%. After the 12 months of the experiment, the detection rate for the red tags (%) was 98.9 ± 0.03, for the green was 97.9 ± 0.69, and for the yellow was 98.2 ± 0.42, indicating that red and yellow tags were more easily detected than green tags in the caudal vasculature. In conclusion, by UV lamp, the tag readability for the back and caudal vasculature sites were significantly greater than those for the abdomen site (P < 0.05; Table 3). Regardless of site, all color tags under UV light were more easily detected than all color tags under visible light.
During experimental period (12 months), accumulated survival rates of back, abdomen, and caudal vasculature groups were not significantly different among red, green, and yellow, respectively (Table 4, P > 0.05). However, accumulated survival rates of each color were affected by the tagging site (Table 4, P < 0.05). During 12 months, the accumulated survival (%) of the control group was the highest (P < 0.05) and the reduction ratio of the accumulated survival in the control group was the most gradual. However, the accumulated survival (%) of the abdomen group in each color were the lowest (P < 0.05), and the reduction ratio were the most dramatic in each color (Table 4).
Samples tagged with VIE were investigated. Values are mean ± S.E. (n = 50). The experiment was performed in triplicate. The values in each column that do not share a common superscript are significantly different from one another (P < 0.05)
In three colors of VIE tagging groups, the accumulated survival rates of the three sites and the control group were 100% at the initiation of experiment (Table 4). Accumulated survival (%) of the control group declined gradually to 90.4 ± 2.88 during 12 months. In addition, accumulated survival (%) of the back group in three colors declined gradually during 12 months. However, the abdomen group declined drastically to 64.2 ± 4.32 in red, 63.8 ± 4.75 in green, and 64.3 ± 4.02 in yellow during 12 months, respectively. Accumulated survival (%) of the caudal vasculature group in three colors declined gradually to 93.6 ± 1.41 in red, 94.1 ± 0.92 in green, and 93.6 ± 1.10 in yellow until 3 months after injection and declined drastically to 74.1 ± 2.89 in red, 74.6 ± 3.09 in green, and 73.5 ± 2.77 in yellow until 12 months after injection. In summary, the experimental fish of three colors survived > 85% of the tags injected in the back, > 70% of the tags injected in the caudal vasculature, and > 60% of the tags injected in the abdomen (Table 4, P < 0.05).
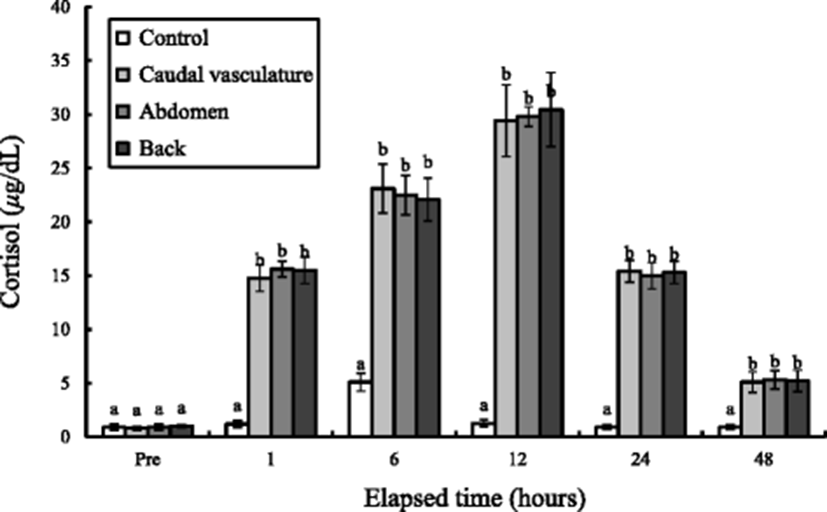
The whole-body cortisol concentration variations of the tagged group during 48 h are shown in Fig. 3. The whole-body cortisol concentration of the control groups was 0.9 μg/dL and has been increased to 1.20 μg/dL in 1 h and became 5.10 μg/dL in 6 h. After 12 h, it rather decreased to 1.26 μg/dL a bit and became 0.90 μg/dL in 24 h and 0.86 μg/dL in 48 h. The whole-body cortisol concentrations of caudal vasculature, abdomen, and back tagged groups were 0.81, 0.92, and 1 μg/dL, respectively, and has been rapidly increased to 14.76, 15.60, and 15.49 μg/dL in 1 h and increased drastically in 6 h (P < 0.05). The whole-body cortisol concentrations of the three experimental groups were the highest at 12 h, and became 29.43, 29.80, and 30.43 μg/dL, respectively. In 24 h, the whole-body cortisol concentrations of the three groups decreased rapidly until 48 h (P < 0.05). The tagging sites were not affected significantly in whole-body cortisol concentration (P > 0.05), and the change of whole-body cortisol concentration according to exposure was seen compared to that at pre-experiment and the cortisol concentration was the highest at 6 h in the control group. However, the cortisol concentration was the highest at 12 h in the three experimental groups.
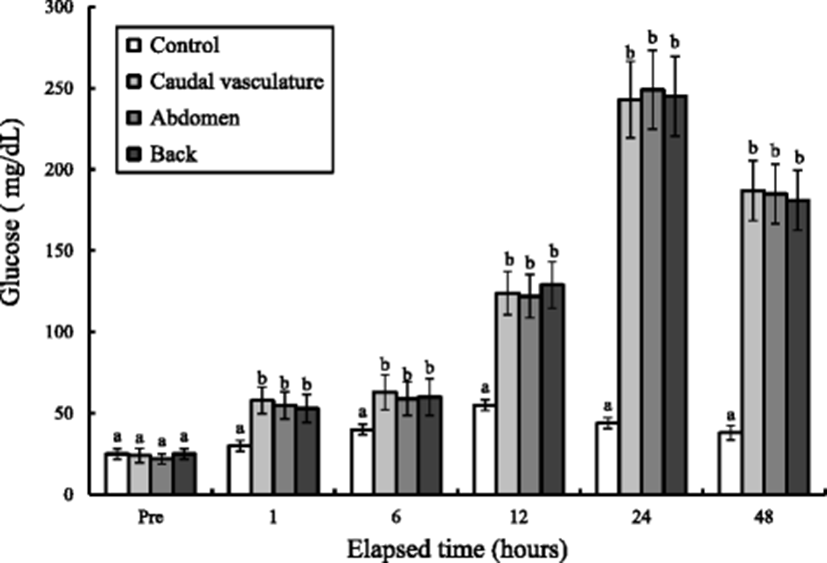
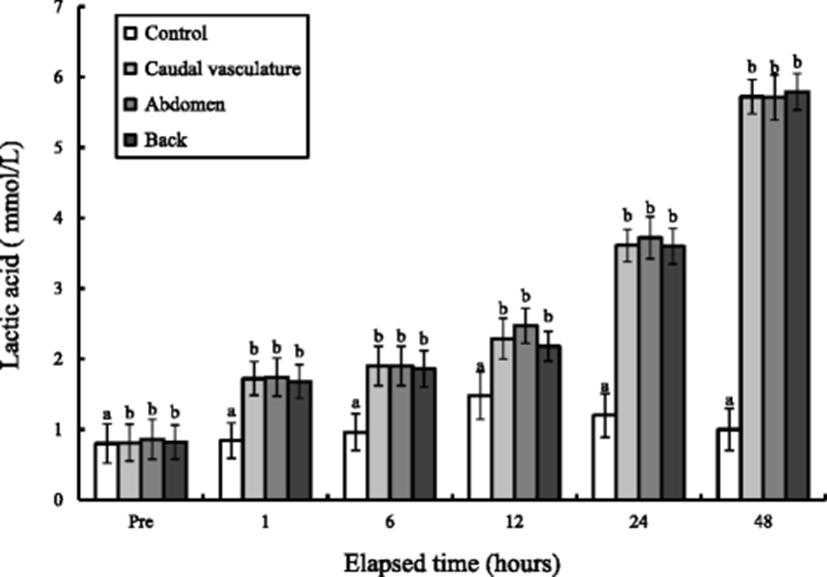
The whole-body glucose and lactic acid concentration variations of tagged marine medaka during 48 h are shown in Figs. 4 and 5. The whole-body glucose and lactic acid concentrations of the control groups were 25 mg/dL and 0.8 mmol/L, respectively, and have been rapidly increased to 55 mg/dL and 1.48 mmol/L in 12 h (P < 0.05). At 48 h, it rather decreased to 38 mg/dL and 1.0 mmol/L (P < 0.05). The whole-body glucose concentrations of three experimental groups were increased rapidly from 12 to 24 h and decreased drastically from 24 to 48 h. The whole-body glucose concentrations of the three experimental groups were the highest at 24 h. The lactic acid concentrations of the three experimental groups were increased rapidly from 24 to 48 h (P < 0.05). The lactic acid concentrations of the three experimental groups were the highest at 48 h. The lactic acid concentrations of the three tagged groups were not observed of reduction while at 48 h. Tagging sites were not affected significantly in whole-body glucose and lactic acid concentration (P > 0.05). The change of whole-body glucose concentration according to exposure was seen compared to that at pre-experiment, and the whole-body glucose and lactic acid concentrations were the highest at 12 h in the control group. However, the times observed when the highest glucose and lactic acid concentrations of the three groups were delayed were 24 and 48 h.
Discussion
In assessing the tagging sites for fish, it is important to establish the effect of the tag, including the tag retention at the tagging site, the rate of tag detection following the tagging site, and the survival rate of the tagged fish (Frederick, 1997; Dewey and Zigler, 1996; Park et al., 2013; Willis and Babcock, 1998). Statistically significant differences were found among tag colors and sites, with red and green tags being easier to detect and distinguish under visible and UV lights than yellow tags in marine medaka, O. dancena. In contrast, Park et al. (2013) reported that red and orange were easier to detect and identify than green and yellow when viewed under UV light, but green and yellow were easily detected in visible light in a greenling, Hexagrammos otakii. However, as in the current study, red tags were more easily detected than green or yellow tags (Willis and Babcock, 1998). In deeper water, where natural light levels are lower, greater attenuation of red light may occur (Willis and Babcock, 1998). In direct sunlight, red tags were clearly detectable at up to 5 m distant in clear water (Pottinger and Calder, 1995).
As shown in Fig. 3, the VIE tag affected the survival of marine medaka in the laboratory (P < 0.05). In conclusion, survival was significantly higher in the control group than in any of the experimental groups. Among the experimental groups, fish tagged in the abdomen site showed the lowest survival. Therefore, skilled injection of the elastomer is crucial for keeping the mortality low, as suggested by the decrease in mortality of marked fish during the laboratory experiment (Frederick, 1997). In previous study, the primary causes of mortality among the tagged samples were internal damage and infection, as a result of gas bladder rupture, and infection from anatomical trauma caused by handling (Willis and Babcock, 1998). The causes of mortality among experimental groups were not determined in this study, and histological observations of post-mortem samples are necessary for investigating the causes of mortality. The results of this experiment are similar to those of the previous studies showing high retention of VIE (Dewey and Zigler, 1996; Willis and Babcock, 1998) in the marine medaka, which had > 90% tag retention for the back tagging site (Table 1), with the caudal vasculature and the abdomen having lower tag retention rates. The various characteristics of this species must be investigated to determine the greater loss of VIE tag retention for the caudal vasculature and the abdomen sites during the experimental period.
The use of VIE tagging in small fish, marine medaka, is advocated as a practical and reliable method for fish identification and monitoring, but it may cause negative effects on growth and mortality. Foreign materials such as tags can lead to stress and may cause changes of the blood reactions of fish. When stress is induced, the fish consume energy, which drives a response of excess secretion of catecholamine and cortisol, and has a considerable influence on the maintenance of homeostasis (Schreck et al., 2001). Plasma cortisol and plasma glucose are recognized as useful indicators of stress in fish (Schreck et al., 2001). In our study, whole-body physiological responses of marine medaka from each tagging region, in the form of high whole-body cortisol, whole-body glucose, and lactic acid values, were generally observed in tagged groups in which a tag had actually been inserted compared to the responses seen in control groups. This finding indicates that the actual insertion of a tag rather than just a pierce injection can result in added stress, and this result shows that tagging sites were not affected significantly in stress response.
The plasma cortisol levels induced by stress appear to increase at various speed and time according to the species of fish (Pickering and Pottinger, 1989). The plasma cortisol concentration after stress is usually reported to increase to a peak value within 1 ~ 3 h and normally recovers within 6 h (Willis and Babcock, 1998). As a whole, the whole-body cortisol values for the tagged group were similar to the values seen in the control group after 48 h. Therefore, the time required for the black rockfish to adapt after the insertion of a tag is approximately 48 h. The whole-body cortisol concentrations showed peak values before 48 h in this study. The trends in cortisol and glucose observed in this experiment indicated generalized stress reactions. Glucose formation was increased simultaneously as the cortisol quantity increased. Elevated cortisol secretion under stress increases the activation of plasma glucose by the activity of the gluconeogenesis enzyme; also, this increase is the result of a second reaction to the first reaction (response of hormone) to stress (Barton and Iwama, 1991).
Buckley et al. (1994) found that in juvenile reef fish, Sebastes spp., the VIE tags could be detected visually in situ for up to 258 days using underwater UV lights. In response to concerns about amphibian declines, Jung et al. (2000) evaluated and validated amphibian monitoring techniques using VIE tags in studies in the Shenandoah and Big Bend national parks, USA. Godin et al. (1995) found that to identify populations of shrimp, Penaeus vannamei, individuals could be tagged internally using an externally visible elastomer. Basic considerations in the use of tags in fisheries management or research include the effects of the tags on animal survival, behavior, growth, permanency, and recognition and the cost of the marking technique (McFarlane and Beamish, 1990; Park and Lee, 2001). VIE tags are made of non-toxic medical grade fluorescent elastomer material and have been used successfully to identify fish, amphibians, and decapod crustaceans (Willis and Babcock, 1998; Jerry et al., 2001; Bailey, 2004). The retention rate was 92% for visual implant elastomer (VIE) tags in juvenile crayfish, Cherax destructor, and 100% for VIE tags in lobsters, Homarus gammarus (Jerry et al., 2001; Uglem et al., 1996). As with VIE tags, passive inductive transponder (PIT) tags are sometimes used in experiments. However, in a study involving injection of small, mid-sized, and large tags into four small Cyprinidae fish species, Carassius gibelio langsdorfi, Hypophthalmichthys molitrix, Pseudorasbora parva, and Phoxinus phoxinus, Jang et al. (2007) reported that PIT tags caused high mortality. The larger and heavier PIT tags can affect the swimming ability of small fish, including marine medaka. Thus, Jang et al. (2007) concluded that PIT tags are inappropriate for small individuals. So, the VIE tags are small, light, and made of non-toxic medical grade fluorescent elastomer material and are therefore more appropriate for small individuals and species, including marine medaka, and are considered effective for laboratory experiments and aquaculture facilities. Unfortunately, the relationship among decreasing survival rate, spawning behavior, and VIE tag was not determined by the previous studies. Thus, future investigation will focus on the relationship among reduced survival rates, spawning behavior, and VIE tag.
Conclusions
During 12 months, the accumulated survival rates of marine medaka, Oryzias dancena, in the experimental treatments were not different among red, yellow, and green elastomer. The experimental fish retained >85% of the tags injected in the back, >70% of the tags injected in the caudal vasculature, and >60% of the tags injected in the abdomen. For all injected sites the red and green tags were able to be detected more easily than the yellow tags when observed under both visible and UV light. So, the VIE tags are small, light, and made of non-toxic medical grade fluorescent elastomer material and are therefore more appropriate for small individuals and species, including marine medaka, and are considered effective for laboratory experiments and aquaculture facilities.