


Background
Since the 1990s, a variety of seawater fish has been actively cultivated and, consequently, the global volume and diversity of live fish imports have dramatically increased. However, in Korea, due to an imperfect quarantine system, accidental disease importation via marine seedlings and the introduction of parasites that previously did not exist in the country are becomingly increasingly problematic (Chun 2006). Various pathogens have been causing mixed infectious diseases and massive deaths of fishes regardless of water temperature (Kim et al. 2006). In recent years, as the possibility of the inflow of foreign diseases has increased, there has been an increasing number of studies that generally monitor the diseases or investigate the correlation with diseases (Cho et al. 2009; Jung et al. 2012; Song et al. 2013). However, until now, most of the research done on domestic fish farming have only been focused on specific diseases, and research on the disease of unknown cause is yet considered minor (Kim et al. 2006; Cho et al. 2008; Kim et al. 2010).
Olive flounder (Paralichthys olivaceus) is among the key commercial marine finfish species cultured in Korea and Japan. Recently, there has been an unknown plague occurring among the ~ 20-cm length olive flounders within fish farms in Jeju Island, South Korea. The death rate of olive flounders occurring within 1–3 weeks after the first symptoms appear is increasing. Fish infected with this illness show darkening of the body color, a decrease in weight, and bleeding (Kim et al. 2015). The myxosporean emaciation disease has occurred in tiger puffer (Takifugu rubripes), parrotfish (Sparisoma cretense), and olive flounder (Ishimatsu et al. 2007; Katharios et al. 2014; Yasuda et al. 2005). Although external symptoms including abdominal emaciation and body darkening were observed, there is no clear information on exact life cycle has not been reported. In addition, PCR analysis of the olive flounders of Jeju island with the primer set of Enteromyxum leei (1589 bp), an etiologic agent of turbot myxosporean emaciation disease in Japan, a neighboring country of Korea, ruled out E. leei as the etiologic agent, as a negative reaction was observed (Kim et al. 2015). We designed the specific primer set for detection of myxosporea from emaciated olive flounder in Korea (Kim et al. 2015). However, there have been no reports yet on the trend of emaciation occurrence in Korea. According to the World Organization for Animal Health (OIE), to establish effective countermeasures against diseases arising in fish farms, accurate monitoring of the occurrence of diseases should be done at each farm (OIE 2008).
Therefore, in this study, 60 olive flounder farms in Jeju island were investigated to determine the status of emaciation infection in 2014~2015. The rate of infection was investigated using PCR, to provide fundamental data on the frequency of occurrence by month season and by the size of the fish.
Methods
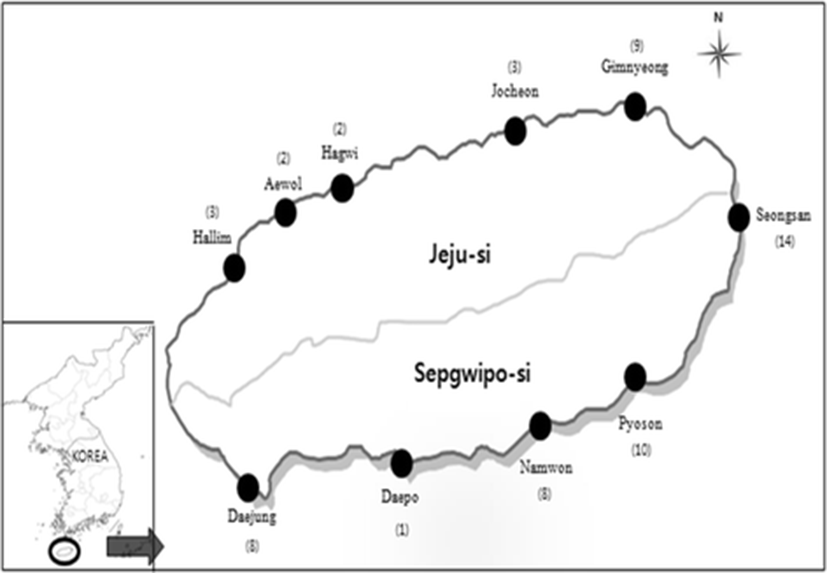
In order to investigate the emaciation occurrence, monitoring from 60 fish farms was performed five times a year in April, May, September, November, and December 2014. The surveyed areas are shown in Fig. 1. Randomly collected three olive flounders (P. olivaceus) (5~ 600 g), not considering whether or not the fish were diseased, from 60 fish farms in Jeju-si and Seogwipo-si of Jeju-do with 180 fish were investigated each time. There was the highest density of band in PCR test using the kidney tissue of emaciated olive flounder (data not shown), and the kidney tissues of 900 fish were investigated by PCR method as described below. The water temperature was measured using a YSI 650XL water quality meter (YSI, USA) (Table 1).
In 2015, it was difficult to collect in few farms and sample collection was not same in 2014. The kidney tissues of 660 fish were taken from 60 fish farms collected from March to April, 55 fish farms from May to June, 52 fish farms from July to August, and 53 fish farms in October and investigated by PCR method as described below. The infection rates in 2015 were investigated using an equivalent method to that used in 2014 (Table 2).
DNA was extracted from the kidney tissue of sampled olive flounder using the DNeasy® Blood and Tissue kit (Qiagen Hilden, Germany), as described by Kim et al. (2015). First, 180 μL ATL buffer and 20 μL proteinase K were added to the kidney samples, and then the solution was left at 56 °C until completely dissolved. After the reaction, 200 μL AL buffer and 200 μL ethanol (100%) were added. The mixed solution was then placed in a spin column and centrifuged at 6,000×g for 1 min, after which the column was placed in a new tube. The column was washed with 500 μL AW1 buffer and 500 μL AW2 buffer, and DNA was separated by adding 50 μL AE buffer. The separated DNA was stored at − 80 °C until further analysis.
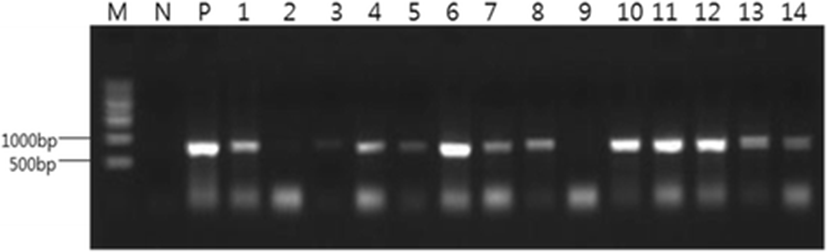
The primers used for PCR were suggested by Kim et al. (2015) (Table 3). PCR reactions contained 0.4 μM of each primer, 1X ExTaq reaction buffer, 200 μM of each dNTP, 0.5 U of ExTaq DNA polymerase, and 1 μl of the respective template DNA. The reaction mixture was completed to 20 μL with distilled water. The conditions for one reaction were as follows: pre-denatured at 95 °C for 3 min, denatured for 30 s, annealed at 55 °C for 30 s, and then extended at 72 °C for 30 s. This reaction was repeated for 35 cycles, followed by a post-extension at 72 °C for 7 min. The PCR amplification product was placed in 1X TAE buffer and electrophoresed after the addition of 0.5 μg/mL ethidium bromide to the 1% agarose gel as an intercalating agent. The size of the product was then detected under ultraviolet light.
Primer | Oligonucleotide sequence (5′-3′) | Expected size | Reference |
|---|---|---|---|
EM-F | CAACCGCAATGTGTTTACTC | 812 bp | Kim et al. (2015) |
EM-R | CCAAACAACCTGCCACAATG |
As Kim et al. (2015) observed that the outbreak of emaciation disease in South Korea was reported to be found 4–5 μm spores in histological examination, an experiment was performed as follows. The extracted kidney tissues of the olive flounder were fixed in Bouin’s solution for 24 h, dehydrated in 70% ethanol, embedded in paraffin wax (Leica EG 1150HC, Germany), sectioned (4–5 μm thickness) using a microtome (Leica Jung 820, Germany), and placed on glass slides to dry. The prepared samples were stained with hematoxylin and eosin (H&E) for optical microscopic examination (Zeiss LT60, Germany).
Results
This study investigated the state of emaciation infection in 900 olive flounders collected from 60 fish farms in April, May, September, November, and December 2014, in Jeju Island, South Korea, a prime cultivation site of olive flounders. Although there were symptomatic differences in each fish infected with emaciation, which is seriously affecting the olive flounder farms in the Jeju region, the main external symptoms were darkening of the body color and severe emaciation of the abdominal area. Internal symptoms showed that hepatorrhagia and severe kidney nebula were observed (data not shown).
As a result of the 2014 investigation on the state of infection of olive flounders, 26 fish (14.4%) of 13 fish farms in April, 12 (6.6%) of 11 fish farms in May, 44 (24.4%) of 32 fish farms in September, 36 (20%) of 23 fish farms in November, and 78 (43.3%) of 42 fish farms in December showed a positive PCR reaction (Table 4 and Fig. 2). In addition, various rates of infection by season were shown from spring to winter (Table 4). Among these, the highest infection rate occurred from September (fall) to December (winter), when water temperatures began to decrease (Table 4).
aNumber of PCR positive/number of farm
Based on the detected genes, the rate of infection according to the size of the fish was investigated. Consequently, in April, according to fish size, 0/14 fish farms (0%) in the < 10 cm, 4/18 (22.2%) in the 11~20 cm, 8/18 (44.4%) in the 21~30 cm, and 1/10 (10%) in the > 31 cm groups, respectively, were infected. The corresponding infection rates in May were 1/7 fish farms (14.2%) in the < 10 cm group, 3/31 (9.6%) in the 11~20 cm group, 6/11 (54.5%) in the 21~30 cm group, and 1/11 (9%) in the > 31 cm group. Thus, in April and May, the rate of infection was low for the group > 31 cm.
In September, the infection rates were 6/6 fish farms (100%) in the 11~20 cm group, 21/38 (55.2%) in the 21~30 cm group, and 5/16 (31.2%) in the > 31 cm group. Infection rates in November were 0/1 fish farms (0%) in the < 10 cm group, 2/2 (100%) in the 11~20 cm group, 16/32 (50%) in the 21~30 cm group, and 5/25 (20%) in the > 31 cm group. Comparatively, high infection rates were detected in December, with 5/5 fish farms (100%), 20/28 (75%), and 16/27 (62.9%) in the 11~20, 21~30 and > 31 cm groups, respectively. Based on the epidemiological survey conducted from April to December, the rate of infection of domestic emaciation was highest in fish between 21~30 cm, but it was evident that all sizes of olive flounders were susceptible to infection (Table 4).
As a result of the state of emaciation infection by each fish farm in 2015, the number of fish farms detected with emaciation were 30/60 (50%) in March~April, 9/55 (16.3%) in May~June, 47/52 (90.3%) in July~August, and 45/53 (84.9%) in October (Table 5 and Fig. 2). In addition, infection rates by fish size were 0/15 (0%) in the < 10 cm group, 13/23 (47.8%) in the 11~20 cm group, 9/11 (81.8%) in the 21~30 cm group, and 7/11 (72.1%) in the > 31 cm group, in March~April. In May~June, the corresponding values were 0/6 (0%), 3/29 (10.3%), 3/13 (23%), and 3/7 (42.8%) in the < 10, 11~20, 21~30 and > 31 cm groups, respectively (Table 5).
aNumber of PCR positive/number of farm
In addition, in July~August, the infection status in the fish farms, based on fish size, were 3/3 (100%) in the < 10 cm group, 19/20 (95%) in the 11~20 cm group, 20/23 (86.9%) in the 21~30 cm group, and 5/6 (83.3%) in the > 31 cm group. Corresponding values in October revealed 1/4 (25%), 14/16 (87.5%), 13/14 (92.8%), and 17/19 (89.4%) in the < 10, 11~20, 21~30, and > 31 cm groups, respectively. Through the epidemiological survey conducted from March–October, the occurrence of infection was equivalent to that of 2014 in all sizes. However, in 2015, the highest infection rate was observed in fish > 31 cm (Table 5). In addition, periodic infection rates throughout the year were found to be the same as 2014 (Table 5), but a higher infection rate was evident in 2015 than in 2014. Among the months, the highest infection rate was observed in July~August, when the water temperature is high, and in October, when the water temperature starts decreasing (Table 5).
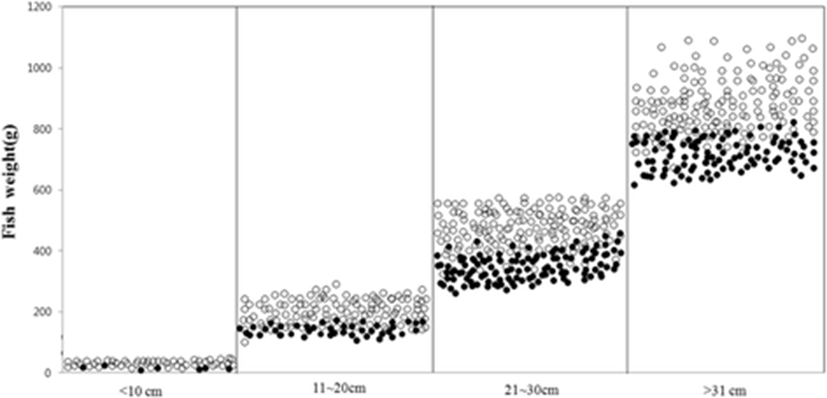
Infection rate in accordance with olive flounder weight in 2014 and 2015 demonstrated that olive flounder of PCR positive with the EM-F/R primer set was lighter 30–40% compared to olive flounder of PCR negative (Fig. 3).
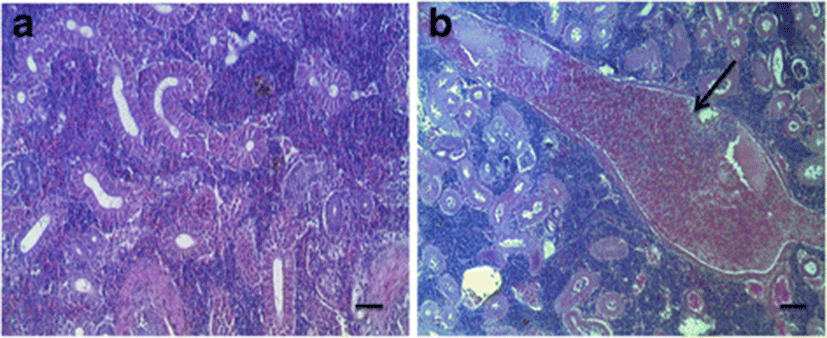
Olive flounder with PCR positive showed numbers of 4–9 μm round or egg-shaped spores in the kidneys, some parts of destroyed or metamorphosed plasmodium including glomerulus, and nucleus were observed (Fig. 4b). Normal shape of kidneys was found in olive flounder with PCR negative (Fig. 4a).
Discussion
In 2014, a total of 900 fishes were surveyed for systematic infection rates based on season, fish farm environment, population, and size, to determine the trend in emaciation occurrence. A high rate of infection was observed in 2014. Therefore, it was considered that regular monitoring of emaciation will be needed in 2015. Accordingly, equivalent experiments were conducted in 2015, except for the number of fish.
The surveys of infection rates by fish farm revealed an infection rate of 18.3~71.6% in 2014 and 16.3~90.3% in 2015. These results suggest an increasing rate of emaciation infection and confirm the disease is a serious issue in the aquaculture industry in Jeju. It is considered that countermeasures, such as isolating the infected water tanks through regular monitoring, are needed to minimize the damage caused by emaciation.
In 2014, emaciation occurrence was mostly found in fish sized between 11~30 cm (Table 4). A similar result was found in 2015 but showed high infection rates even in larger sized fish (> 31 cm) (Table 5). These results suggest that the infection rate of emaciation is relatively increased in adult fishes. However, a direct comparison of the infection rate by fish size is not possible due to the differences in the collected sampling number of fish. There are limited studies on this topic, and therefore, an absolute comparison is not feasible. However, it is considered necessary that particular attention is focused on the disease management throughout the life of the fish, as all the fish were susceptible to the emaciation infection irrespective of size.
Infection rate of emaciation disease according to olive flounder weight showed that olive flounder of PCR positive with the EM-F/R primer set were lighter compared to olive flounder of PCR negative (Fig. 3). This finding was consistent with one proposed by Kim et al. (2015). The result is expected to be used as basic data for evaluating pathological characteristics in accordance with pathogenicity. More systematic research should be conducted in the correlation between the drop of fish with emaciation disease and pathogenicity of pathogens.
A statistical epidemiological survey on diseases of olive flounders by Kim et al. (2010) found that the infection rate of Trichodina and Ichthyobodo parasitic diseases was highest in April and December when the fluctuation of water temperature was high. As a result of the occurrence trends by period, relatively high rates of infection were observed in September and December 2014 and in March, July, and October 2015, which are before and after the high fluctuation of water temperature. However, infection occurred in all periods examined. Therefore, it is assumed that the seasonal fluctuation of water temperature in Jeju might not be one of the main causes of the yearly occurrence of emaciation.
This study provides useful and fundamental reference data on the epidemiology of emaciation infection in olive flounders cultivated within Jeju. Henceforth, studies on the life cycle of parasites that cause emaciation should be conducted.