


Introduction
Arsenic (As) is an ubiquitous element, released into the aquatic environment through anthropogenic activities such as metal smelting, chemical manufacturing, and agriculture (Schlenk et al. 1997; Singh and Banerjee 2008). It is considered to be a toxic trace element, and ecological dangers can arise if large amounts of arsenic are released into the environment as a result of industrial and agricultural activities (Canivet et al. 2001; Pedlar et al. 2002). Environmental toxins can induce physiological and biochemical changes in fish that lead to growth inhibition (Beyers et al. 1999). Arsenic exposure in the aquatic environment causes bioaccumulation in aquatic organisms and can lead to physiological and biochemical disorders, such as poisoning, liver lesions, decreased fertility, cell and tissue damage, and cell death (Bears et al. 2006; Ribeiro et al. 2005).
The extent of arsenic’s ability to produce toxicity in the aquatic environment can vary depending on physiochemical characteristics such as temperature, pH, salinity, and water hardness (Min et al. 2014). Of these parameters, water temperature is one of the most critical factors for fish, because they are poikilothermic animals and their metabolism is affected by water temperature (Besson et al. 2016). Generally, the higher the (water?) temperature, the faster the growth, but optimal temperature for fish growth is often higher than the species’ normal body temperature.Optimal temperature for growth and survival varies depending on the fish species, and temperatures outside optimal ranges can act as stressors (Handeland et al. 2008; Chang et al. 2001). However, differences in water temperature even within the optimal range can also cause differences in metabolism, including the metabolism of toxins (Handeland et al. 2008). Hematologic indices, such as inorganic substances, organic substances, and enzyme activity can be used as indicators of toxic stress (Kavitha et al. 2010). Normally, when exposed to toxic substances, hematologic levels increase or decrease beyond the normal range, enabling them to be used as markers of physiological changes (Manik et al. 2013), and are widely used as indicators of fish health (Alwan et al. 2009).
Starry flounder, P. stellatus, is commerciallly fished off the coast of North America. It lives in the East Sea in Korea and throughout the entire North Pacific Ocean. The optimal temperature of the starry flounder is 13~18 °C. At water temperatures above 20 °C, the flounder does not take in food and its resistance becomes weak. However, because starry flounder can withstand low temperatures, it can feed and grow at 5 °C. Only since the late1990s have starry flounder been utilized to study water pollution and toxicity, so there remains much to learn about their response to environmental toxic exposure (Byun et al. 2009). According to Byun et al. (2009), it is assumed that there will be a physiological difference between them (?) because the feed efficiency is remarkably different around 15 °C. Therefore, the temperatures studied here (12 °C, 18 °C) were chosen to encompass the interval before and after 15 °C and the objective was to evaluate the combined effect of water temperature and arsenic exposure on hematologic health indices.
Materials and method
Juvenile starry flounder, P. stellatus, were obtained from a local fish farm in Gijang, Korea. The fish were acclimated to adapt to the laboratory environment for 2 weeks. The temperature was set at two sections (12 °C, 18 °C), and the temperature was maintained using electronic thermostats (MS701-H, Mink, Korea). The water temperature control was also used with an electronic thermostat, and the temperature was raised by 1 °C per day to reach a final temperature of 12 °C and 18 °C. The amount of feed was set at 3% of the weight of the fish with reference to the Byun et al. (2009) and fed once a day. After acclimation, 96 fishes (total length, 15.9 ± 0.4 cm; body weight, 62.2 ± 4.2 g) were randomly selected for the experiment. The arsenic experiment was performed with waterborne, and the exposure solution was sodium arsenite (Sigma, St. Louis, MO, USA). Waterborne As exposure took place in 40 L aquaria containing 12 fish per treatment group. The concentrations of arsenic were divided into 0, 150, 300, and 600 μg per L (using sodium arsenite solution diluted in distilled water). The concentration of each tank was measured using ICP-MS, and the actual concentrations were 0.668, 167, 312, and 626 μg/L. The ICP-MS measurements were performed using an ELAN 6600DRC ICP-MS instrument with argon gas (Perkin-Elmer). To minimize contamination of food waste, the aquarium completely changed the test water once every 2 days and maintained the same concentration in each aquarium before and after the change. The total exposure period was 4 weeks, no mortality occurred, and sampling was performed each 48 fishes at 2 weeks (total length, 16.56 ± 0.5 cm; body weight, 62.7 ± 5.3 g) and 4 weeks (total length, 17.37 ± 0.5 cm; body weight, 63.35 ± 6.7 g).
The weight and length of the starry flounder were measured immediately before the start of the experiment and at 2 and 4 weeks. Daily length gain, daily weight gain, condition factor, and feed efficiency were calculated. These values were calculated using the following formula.
Daily length gain = (final length − initial length)/day
Daily weight gain = (final weight − initial weight)/day
Condition factor (%) = [weight(g)/length3 (cm)]× 100
Feed efficiency = live weight gain/dry feed given
Blood samples were collected from the caudal vein of fish using a heparinized disposable syringe (1 ml) to prevent clotting. The total red blood cell (RBC) count, hemoglobin (Hb), and hematocrit (Ht) were analyzed immediately after blood collection. The RBC counts were counted using an optical microscope with a hemo-cytometer (Improved Neubauer, Germany) after 400 times dilution with PBS (phosphate buffer solution). The Hb concentrations were measured by the cyan-methemoglobin technique using a clinical kit (Asan Pharm. Co., Ltd., Korea). The Ht values were obtained by collecting blood from microhaematocrit capillary tubes and centrifuging at 12,000 rpm for 5 min at 4 °C in microhematocrit centrifugation (Model; 01501, HAWKSLEY AND SONS Ltd., England). Then, Ht values were measured using a reader (Micro-Haematocrit reader, HAWKSLEY AND SONS Ltd., England).
The collected blood was centrifuged at 3000g for 5 min at 4 °C to separate the plasma. The separated plasma samples were analyzed for changes in inorganic substances (ASAN Ca-Lq Reagents, Magnesium), organic substances (Total protein, V-Glucose), and enzyme activity (ASAN GOT-Lq Reagents, ASAN GPT-Lq Reagents) using clinical kit (Asan Pharm. Co.,Ltd.). The inorganic substances assay included calcium and magnesium. Calcium was analyzed by the o-cresolphthalein-complexon technique, and magnesium was analyzed by the xylidyl blue technique. The organic substances assay included glucose and total protein. Glucose was analyzed by GOD/POD technique and total protein was analyzed by biuret technique. The enzyme activity assay included glutamic oxalate transaminase (GOT) and glutamic pyruvate transaminase (GPT). GOT and GPT were analyzed by Kind-King technique using clinical kit.
Results
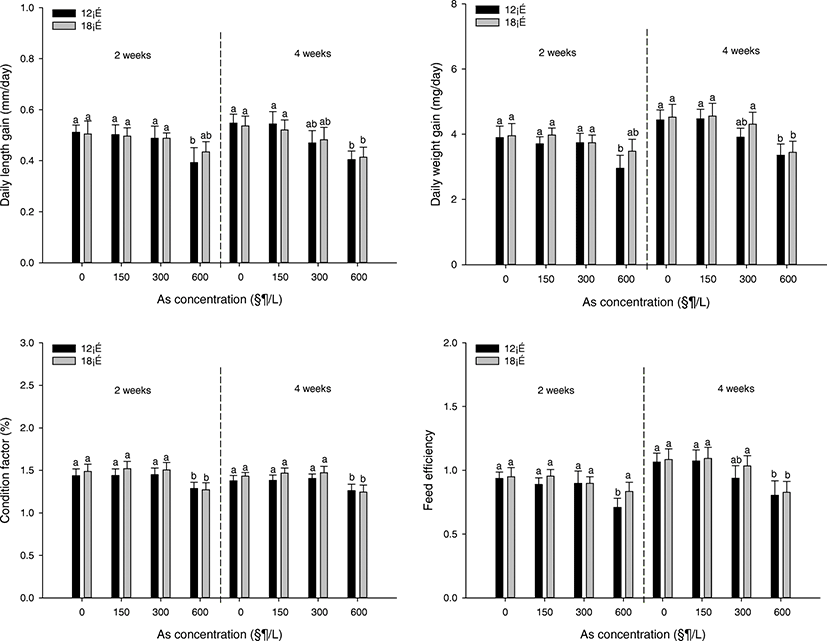
The growth factors of P. stellatus are demonstrated in Fig. 1. The daily length gain was considerably decreased at the concentration of 600 μg/L at 12 °C after 2 weeks and at the concentration of 600 μg/L at 12 °C and 18 °C after 4 weeks. In daily weight gain, it was observed to the totally same tendency as the result of the daily length gain. A significant decline in condition factor was indicated at the concentration of 600 μg/L of all temperature and all period. The feed efficiency was notably declined at the concentration of 600 μg/L at 12 °C after 2 weeks and at the concentration of 600 μg/L at 12 °C and 18 °C after 4 weeks.
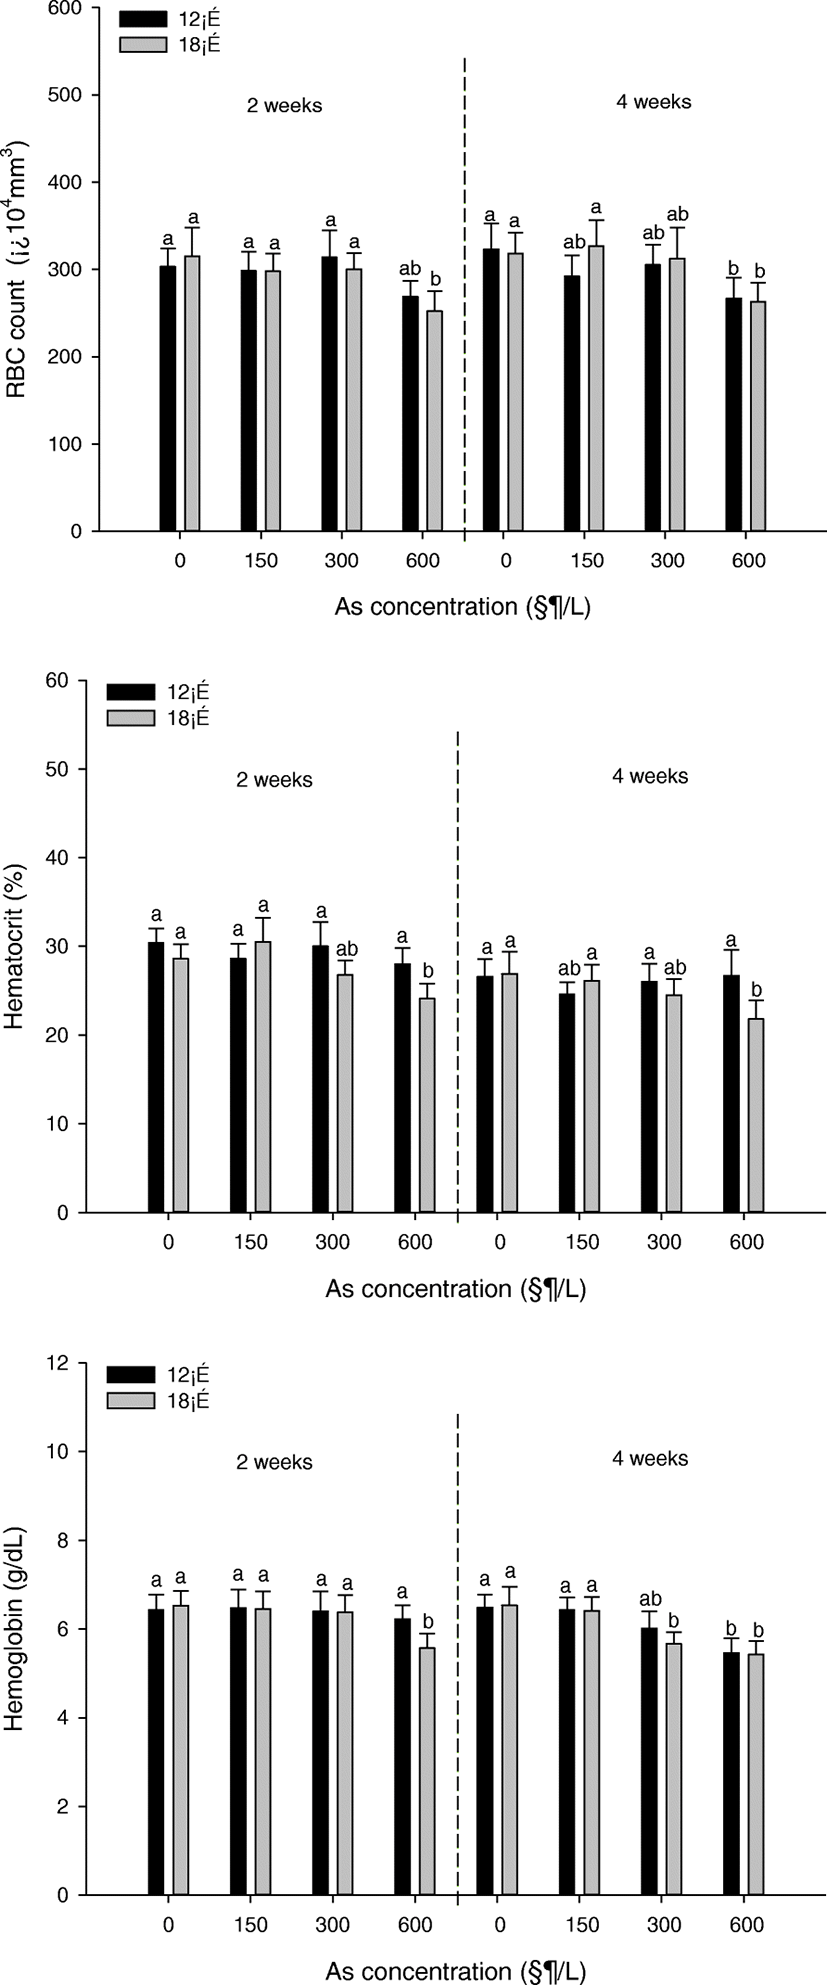
Change in RBC counts, hematocrit (Ht), and hemoglobin (Hb) concentrations of P. stellatus are demonstrated in Fig. 2. The RBC counts were significantly decreased at the concentration of 600 μg/L at 18 °C after 2 weeks and significantly decreased at the concentration of 600 μg/L at 12 °C and 18 °C after 4 weeks. The Ht was significantly decreased at the concentration of 600 μg/L at 18 °C after both 2 and 4 weeks. The Hb was a noticeable decline at the concentration of 600 μg/L at 18 °C after 2 weeks and was a noticeable decline at the concentration of over 300 μg/L at 12 °C and 18 °C after 4 weeks.
The plasma inorganic substances of P. stellatus are demonstrated in Table 1 and analyzed for calcium and magnesium. The calcium and magnesium did not change in all of the sections. After 4 weeks, calcium and magnesium were slightly reduced with increasing arsenic concentration, but not remarkable.
Values are mean±S.E. Values with different superscript are significantly different at 2 weeks and 4 weeks (P < 0 .05) as determined by Duncan's multiple range test
The plasma organic substances of P. stellatus are demonstrated in Table 2 and analyzed for total protein and glucose. Total protein was notably decreased only at the concentration of 600 μg/L at 18 °C. Glucose was notably increased at the concentration of 600 μg/L at both 12 °C and 18 °C after 2 weeks. At 4 weeks, there was a notable increase at the concentration of 600 μg/L at 12 °C and a notable increase at the concentration of over 300 μg/L at 18 °C.
Values are mean±S.E. Values with different superscript are significantly different at 2 weeks and 4 weeks (P < 0 .05) as determined by Duncan's multiple range test
The plasma enzyme activity of P. stellatus are demonstrated in Table 3 and analyzed for GOT and GPT. GOT and GPT were not shown any considerable change compared with the control group of each temperature range after 2 weeks, whereas, after 4 weeks, it seems to increase overall and a considerable increase was shown at the concentration of 600 μg/L.
Values are mean ±S.E. Values with different superscript are significantly different at 2 weeks and 4 weeks (P < 0 .05) as determined by Duncan's multiple range test
Two-way ANOVA was performed to investigate the correlation between growth factor, hematological parameters, and plasma components changes due to water temperature and As concentration. The growth factor results of two-way ANOVA are demonstrated in Table 4. The daily length gain showed significant difference only at As concentration, and daily weight gain, condition factor, and feed efficiency showed significant difference at both water temperature and As concentration. But there were no significant interactions between As concentration and water temperature. The hematological parameter results of the two-way ANOVA are demonstrated in Table 5. The RBC count was a notable difference only at As concentration, hematocrit was a notable difference at both water temperature and As concentration, and hemoglobin was a notable difference at only As concentration. Interactions between As concentration and water temperature were also not significantly different in hematological parameter. The plasma component results of two-way ANOVA are demonstrated in Table 6. Calcium and magnesium, the plasma inorganic substances, showed no remarkable difference between water temperature and concentration. As a plasma organic substance, total protein was a remarkable difference at water temperature and glucose was a remarkable difference at As concentration. Among the plasma enzyme, GOT was a noticeable difference at water temperature and GPT was a noticeable difference at both water temperature and As concentration. Likewise, interactions between As concentration and water temperature was not significant.
Two-way ANOVA | Daily length | Daily weight | Condition Factor | Feed Efficiency |
|---|---|---|---|---|
Water Temperature | 0.724 | 0.000* | 0.047* | 0.000* |
As Concentration | 0.000* | 0.000* | 0.000* | 0.000* |
Interaction | 0.799 | 0.607 | 0.937 | 0.604 |
Values are mean ± S.E. Values with asterisks are significantly different (P < 0.05) as determined by Duncan’s multiple range test
Two-way ANOVA | RBC count | Hematocrit | Hemoglobin |
|---|---|---|---|
Water Temperature | 0.609 | 0.000* | 0.073 |
As Concentration | 0.000* | 0.008* | 0.000* |
Interaction | 0.906 | 0.078 | 0.291 |
Values are mean± S.E. Values with asterisks are significantly different (P < 0.05) as determined by Duncan’s multiple range test
Two-way ANOVA | Calcium | Magnesium | Total protein | Glucose | GOT | GPT |
|---|---|---|---|---|---|---|
Water Temperature | 0.113 | 0.230 | 0.046* | 0.091 | 0.001* | 0.000* |
As Concentration | 0.219 | 0.614 | 0.135 | 0.000* | 0.214 | 0.000* |
Interaction | 0.823 | 0.996 | 0.814 | 0.736 | 0.745 | 0.392 |
Values are mean± S.E. Values with asterisks are significantly different (P < 0.05) as determined by Duncan’s multiple range test
Discussion
Metallic materials that enter the aquatic environment accumulate in aquatic animal tissue. Aquatic animals metabolize to release these metal substances, but they can be toxic if not removed during metabolism (Farombi et al. 2007). The accumulation of metals such as arsenic affects a variety of physiological systems, including fish growth, reproduction, immune function, and enzyme activity (Datta et al. 2009). Furthermore, changes in water temperature are able to affect fish metabolism, and water temperatures outside the appropriate temperature range have a detrimental effect on fish (Bagnyukova et al. 2007). In particular, rising water temperature accelerates oxygen consumption and metabolic rate and can cause stress and immunity degradation (Lushchak and Bagnyukova, 2006). Therefore, growth performance and plasma component of starry flounder were analyzed by arsenic and temperature.
Growth is an expression of dietary intake, such as energy metabolism, which can determine many physiological changes. In general, when fish are exposed to the toxicity of metals, feed intake rate and metabolic rate decrease, resulting in a decrease in growth rate (Farkas et al. 2002; Hayat et al. 2007). As a growth factor, daily length gain, daily weight gain, condition factor, and feed efficiency were analyzed. All items showed a decrease at the highest concentration and showed a larger decrease at lower temperatures than at higher temperatures. In most cases, there is a negative relationship between heavy metal concentrations and fish weights, and the chronic and high concentrations of heavy metal toxicity are associated with a decrease in growth and increase in mortality (Woodward et al. 1994; Hussain et al. 2010). In general, heavy metal toxicity can delay fish development, but heavy metal toxicity such as mercury, zinc, and chromium appears to be more effective than others (Canli and Atli 2003). In this study, the growth rate was significantly reduced in 600 μg/L of arsenic, all the growth values of the low temperature were significantly decreased, but some growth values of high temperature were not significantly decreased. The reason is that moderately high temperatures have increased growth. Universally, the higher the temperature, the higher the metabolic rate, and therefore, the growth of the feed is increased and the growth is increased (Harris and Bodaly 1998). As a result, normal growth occurs because the temperature range is within the optimal water temperature range, and heavy metal exposure tends to decrease growth. For this reason, the growth values at high temperature were canceled by increases and decreases, and therefore, no significant changes in some growth were seen. However, it cannot be considered safe that no significant changes in growth have occurred. Failure to grow in a growth-enabling environment means that it is not a safe condition (Ogata et al. 1987).
The hematological characteristics of fish are used to monitor environmental pollution in aquatic ecosystems, and arsenic can lead to changes in hematologic characteristics (Kavitha et al. 2010). Hematological parameters such as RBC, WBC, Ht, and Hb are often used to assess the health status of fish (Carvalho and Fernandes 2006). In this study, hematologic parameters such as RBC counts, hematocrit (Ht), and hemoglobin (Hb) tended to decrease overall. The striking decrease in RBC count was observed at the highest of concentration arsenic regardless of temperature. In the case of Ht, there was change at 12 °C and 18 °C high concentration section. Hemoglobin was significantly decreased at the highest concentration of arsenic and high temperature. Arsenic exposure affects blood cells and lymphocytes because arsenic toxicity is associated with bone marrow damage (Ferrario et al. 2008). Such hematopoietic tissue damage may result in insufficient erythropoiesis and low concentration of hematocrit and hemoglobin. In addition, arsenic-induced anemia due to hemolysis of intravascular erythrocytes may also occur (Cockell et al. 1991).
The plasma inorganic substances, calcium and magnesium, were slightly decreased at high concentration after 4 weeks, but there was no significant decrease. Plasma calcium is maintained at a certain level and related to various enzymatic actions. When exposed to metallic substances, plasma calcium concentration decreases in a short period of time, but gradually recover to a certain level over time (Pratap et al. 1989). Calcium in this experiment was not significant but decreased overall. Therefore, the plasma calcium level is considered to have recovered in the short term and finally recovered, and magnesium, a plasma inorganic substance, is presumed to be a mechanism such as calcium.
The plasma organic substance, total protein, was a notable decrease only at high concentration after 4 weeks, but glucose increased with rising concentrations of arsenic in all periods and noticeably increased at higher concentrations. Total protein is a biological parameter important for understanding health status and metabolism by toxic stress. Decreased plasma protein can be a cause of protein synthesis disorder and appears to be the result of arsenic accumulation in the liver (Lavanya et al. 2011). In addition, arsenic changes glucose metabolism by changing the cellular metabolism and forming metal complexes that affect carbohydrate metabolism such as glucose, glycogen, and lactate. Glucose is frequently used as an indicator of environmental stress, and elevated blood glucose levels may be due to gluconeogenesis to fulfill increased metabolic demands by arsenic (Kavitha et al. 2010).
Liver function tests have been used as an index of liver function changes to arsenic exposure, and plasma enzyme (GOT, GPT) analysis is one of the liver function tests (Abdel-Hameid 2009). In this study, the plasma enzyme activity such as GOT and GPT showed a considerable increase at high concentration after 4 weeks irrespective of temperature. Abdel-Hameid (2009) reported substantial increases in GOT and GPT of Nile Catfish, Clarias gariepinus, exposed to arsenic, and elevated levels of these parameters may reflect liver damage due to arsenic toxicity. This means exposure to metal toxicity, such as arsenic, can lead to elevated plasma enzymes as a whole, and significant increases in high concentrations of arsenic suggest that liver regeneration may proceed to restore GOT and GPT levels when exposed to low concentrations of arsenic (Roy and Bhattacharya, 2006). The temperature on hematological parameters did not have much effect. The reason seems to be that 18 °C was not high enough to rapidly stimulate metabolism to within a range of optimum water temperatures and seems to be more influenced by As concentration.
In this study, two-way ANOVA analysis showed no significant interaction between concentration and water temperature in growth factor, hematological parameters, and plasma components. The two-way ANOVA value in growth factors and hematological parameters except plasma components showed a significant difference, so water temperature did not suppose to have a significant influence in the suitable temperature range for breeding.