RESEARCH ARTICLE

Feeding ratio affects growth, body composition, and blood chemistry of mandarin fish (Siniperca scherzeri) in recirculating aquaculture system

Yi-Oh Kim1https://orcid.org/0000-0003-3407-7682, Sung-Yong Oh2,*https://orcid.org/0000-0002-8664-3829, Who-Seung Lee3https://orcid.org/0000-0002-2203-6616
Author Information & Copyright
1Chungcheongbuk-do Inland Fisheries Research Institute, Chungju 27432, Korea
2Marine Bio-Resources Research Unit, Korea Institute of Ocean Science & Technology, Busan 49111, Korea
3Korea Environment Institute, Sejong 30147, Korea
*Corresponding author: Sung-Yong Oh, Marine Bio-Resources Research Unit, Korea Institute of Ocean Science & Technology, Busan 49111, Korea, Tel: +82-51-664-3310, Fax: +82-51-955-3981, E-mail: syoh@kiost.ac.kr

Copyright © 2021 The Korean Society of Fisheries and Aquatic Science. This is an Open Access article distributed under the terms of the Creative Commons Attribution Non-Commercial License (http://creativecommons.org/licenses/by-nc/4.0/) which permits unrestricted non-commercial use, distribution, and reproduction in any medium, provided the original work is properly cited.

Received: Dec 31, 2020; Revised: May 17, 2021; Accepted: May 26, 2021

Published Online: Jun 30, 2021

Abstract

The effects of various feeding ratios on the growth, body composition, and blood chemistry of the juvenile mandarin fish Siniperca scherzeri (initial body weight 9.6 g) were examined in recirculating freshwater system equipped with 21, 300 L tanks at 20 fish per tank. The triplicate groups of seven feeding ratios treatments were prepared: 100% (control), 95%, 90%, 85%, 80%, 75%, and 70% of satiation. The feed amount of control group was determined by supplying with apparent satiation and then the feed amounts of the other six feeding groups were determined based on the feed amount of the control group. Fish were hand-fed with test diet (55.4% crude protein) for 10 weeks. Weight gain (WG) and specific growth rate of fish fed to 100% satiation were not significantly (p > 0.05) different from those of fish fed to ≥ 80% satiation but were significantly higher than those of fish fed to 75% and 70% satiation. Feed efficiency, protein efficiency ratio, and protein retention of 100% satiation were not significantly different from those of 95% and 90% satiation but were significantly (p <0.05) lower than ≤ 85% satiation. Condition factor, hepatosomatic index, and coefficient variation were not significantly (p > 0.05) affected by feeding ratio. Whole body composition and contents of hematocrit, glutamic oxaloacetic transaminase, glutamic pyruvic transaminase, glucose, total protein, and high-density lipoprotein cholesterol in blood serum were not significantly (p > 0.05) affected by the feeding ratio; however, content of total cholesterol tended to decrease as the feeding ratio decreased. Using broken-line analysis of WG, it was suggested that the optimum feeding ratio of juvenile mandarin fish, ranging from 9.0 g to 37.0 g, appeared to be 87.7% of satiation without growth inhibition.

Keywords: Feeding ratio; Feed utilization; Growth; Mandarin fish; Siniperca scherzeri

Introduction

The mandarin fish Siniperca scherzeri is a freshwater species with high commercial value found in East Asia. The fish is mainly distributed in North Vietnam, China and Korea (Li, 1991; Sankian et al., 2019; Zhang et al., 2009; Zhou et al., 1988). It is a temperate perch belonging to the family Percichthyidae (Li, 1991; Zhou et al., 1988). As natural resources have become depleted owing to overfishing and habitat destruction, S. scherzeri has drawn attention as a fish species that can be cultured in inland fisheries. Its promising prospects, such as rapid growth rate and high disease resistance, have generated high demands for methods for its culturing (Liang et al., 2005; Sankian et al., 2018; Sankian et al., 2019; Su et al., 2005; Zhang et al., 2009).

According the literature, the growth rate and feed efficiency (FE) of a farmed fish species depend on feed quality and quantity (Bureau et al., 2006; Yuan et al., 2010) and is affected by culture conditions, feed composition and type, and feeding method (Lee et al., 2000a; Lee et al., 2000b). An optimal feeding regimen can minimize feed waste and maximize FE and was thus crucial for farming of fish (Blanquet & Oliva-Teles, 2010; Cho et al., 2006; Van Ham et al., 2003; Xie et al., 2011). In general, the best feeding ratio was feeding just below satiation (Blanquet & Oliva-Teles, 2010; Cho et al., 2006; Cho et al., 2007; Eroldoğan et al., 2004; Meyer-Burgdorff et al., 1989; Shimeno et al., 1997; Van Ham et al., 2003; Zoccarato et al., 1994). Commercial fish farms preferred to use a restricted feeding regimen that did not inhibit fish growth; in brief, they preferred to use an optimal feeding ratio for financial and environmental reasons, such as high feed utilization, improved water quality, reduced labor cost, and enhanced product quality (Blanquet & Oliva-Teles, 2010; Cho et al., 2006; Eroldoğan et al., 2006; Li et al., 2005; Van Ham et al., 2003). However, the optimal feeding ratio depends on various factors, such as species, size, and culture conditions (Blanquet & Oliva-Teles, 2010; Cho et al., 2006; Cho et al., 2007; Van Ham et al., 2003).

Therefore, it was necessary to investigate the effect of feeding ratio on different farmed fish species and to decide whether a predetermined feeding ratio was realistic to use in fish farming. Regarding research on culturing S. scherzeri, studies had been conducted on the efficiency of live feed utilization (Liu et al., 1998), nutrient demand (Mo et al., 2019; Sankian et al., 2017; Sankian et al., 2019), efficiency of mealworms as a substitute for fish meal (Sankian et al., 2018) and feeding time (Zhang et al., 2009). However, to best of our knowledge, no study has investigated the optimal feeding ratio for S. scherzeri. The goal of this study was to investigate the effects of feeding ratio on the growth, blood chemistry, and body composition of juvenile S. scherzeri.

Materials and Methods

Fish and rearing condition

The mandarin fish Siniperca scherzeri bred at the Chungcheongbuk-do Inland Fisheries Research Institute were used in this experiment. The experiment was conducted in a recirculating culture system consisting of a nitrification filter tank (volume: 3,000 L), a foam separator (100 L), and 21 cylindrical fiberglass water tanks (300 L). Before the beginning of the feeding trial, all fish were acclimated to environmental culture condition for 2 weeks. Twenty fishes (an average initial body mass: 9.6 g ± 0.05 g) per tank were randomly distributed in each cylindrical water tank. Experimental diet was provided twice daily (09:00 h and 17:00 h) until satiation. The tank was aerated to supply sufficient levels of dissolved oxygen. During the experimental period, levels of dissolved oxygen, ammonia, nitrite, temperature, and pH were monitored daily. The water temperature was maintained at 26.1°C–27.7°C, dissolved oxygen level > 7.5 mg/L, ammonia < 0.45 mg/L, nitrite < 0.17 mg/L, and pH within 6.8–7.2 during the experimental period.

Experimental design

Seven feeding ratios were used in this experiment; 100% (satiation) for the control and 95%, 90%, 85%, 80%, 75%, and 70% of satiation for the experimental groups. The feed amount of each feeding treatment including the control group was followed by the method of Cho et al. (2006); the control group (100%) was fed twice daily until 100% satiation (09:00 h and 17:00 h). The satiation level was determined based on apparent visual satiety. The remaining six feeding ratios were determined based on the feed intake (FI) amount in the control group. During the experimental period, feed was carefully provided ensuring there was no feed leftover on the tank floor. Uneaten feed were siphoned from the each tank floor for 30 min after begin of feeding at each meal everyday. Once we measured the dried mass of siphoned food, we deducted from total feed consumption (FC) to calculate FI. In the six experimental groups, feed allowance of fish was re-adjusted everyday according to the FI of fish in the control group previous day. The experiment was conducted in triplicate and lasted 10 weeks.

Preparation of the experimental diet

The ingredients and chemical compositions of the experimental diet are shown in Table 1. The diet consisted of anchovy meal as the main protein source. In addition, squid liver oil and soybean oil was added in a 1:1 ratio as the main lipid sources (Sankian et al., 2017). These raw materials were mixed and an adequate amount of water was added to the mixture. The mixture was compressed into pellets (diameter: 3 mm). The compositions of experimental diet were 55.8% crude protein and 14.5% lipid, which meets the nutrient demands for growth of juvenile mandarin fish (Sankian et al., 2017). The pellets were dried at room temperature and were stored in a freezer at –30°C until they were used in the experiment.

Table 1. Ingredients and proximate composition (%) of the experimental diets
Ingredients (%) Diets
Anchovy fish meal1) 76.0
Corn gluten meal2) 2.8
Potato-starch 10.5
Squid liver oil + soybean oil 8.1
Vitamin premix3) 1.0
Mineral premix4) 1.0
Vitamin C 0.3
Vitamin E 0.2
Choline salt 0.1
Nutrient contents (dry matter basis)
Moisture 33.3
Crude protein (%) 55.8
Crude lipid (%) 14.5
Ash (%) 11.8

1) Pesquera Bahia Caldera, Caldera, Chile. Fishmeal composition (% dry matter): crude protein, 67.3; crude lipid, 8.6.

2) WooSung Feed, Daejeon, Korea. Corn gluten meal composition (% dry matter): crude protein, 66.1; crude lipid 2.8.

3) Vitamin premix contained the following ingredients (g/kg premix), which were diluted in cellulose: thiamin hydrochloride, 2.7; riboflavin, 9.1; pyridoxine hydrochloride, 1.8; niacin, 36.4; Ca-D-pantothenate, 12.7; myo-inositol, 181.8; D-biotin, 0.27; folic acid, 0.68; p-aminobenzoic acid, 18.2; menadione, 1.8; retinyl acetate, 0.73; cholecalciferol, 0.003; and cyanocobalamin, 0.003.

4) Mineral premix contained the following ingredients (g/kg premix): MgSO4·7H2O, 80.0; NaH2PO4·2H2O, 370.0; KCl, 130.0; Ferric citrate, 40.0; ZnSO4·7H2O, 20.0; Ca-lactate, 356.5; CuCl, 0.2; AlCl3·6H2O, 0.15; KI, 0.15; Na2Se2O3, 0.01; MnSO4·H2O, 2.0; and CoCl2·6H2O, 1.0.

Download Excel Table
Fish measurement, blood, and body content analysis

The total length and weight of the fish were measured at the beginning and end of the experiment. Prior to weight measurement, all fish were starved for 24 h to remove any remaining metabolites from the gut and were anesthetized using 150 mg/L of 2-phenoxyethanol (Sigma, St. Louis, MO, USA). Ten fishes were selected randomly from each feeding treatment group, and their blood chemistry, hepatosomatic index (HSI), and viscerosomatic index (VSI) were measured. Blood samples were collected from the tail artery using a heparin-treated syringe after anesthetizing the fish with 150 mg/L of 2-phenoxyethanol for 1 minute. Hematocrit (HCT) was measured from whole blood, and serum was extracted by centrifuging the blood samples at 8870×g for 5 min. DRI-CHEM NX500i (Fujifilm, Tokyo, Japan) was used to measure serum total protein (TP), glutamic oxaloacetic transaminase (GOT), total cholesterol (TCHO), high-density lipoprotein cholesterol (HDLC), glutamic pyruvic transaminase (GPT), and glucose (GLU).

For analysis of the whole body composition, 10 fish specimens from each group were stored in a freezer at –40°C prior to analysis and then analyzed according to standard procedures (AOAC, 1995). Crude protein content was analyzed using the Auto Kjeldahl System (Buchi B-324/435/412, Switzerland; Metrohm 8-719/806, Switzerland) according to the Kjeldahl method. Moisture content was measured after drying the specimens in a dry oven at 105°C for 24 h . The crude lipid content was measured using the ether-extraction method, and the ash content was measured after burning the specimens for 4 h at 600°C.

Statistical analysis

One-way ANOVA was performed using SPSS 20.0 (SPSS, Chicago, IL, USA). Tukey’s HSD (honestly significant difference) test was used to examine the statistical significance of the mean values at 95% confidence intervals. The optimal feeding ratio was calculated using a broken-line model (Robbins et al., 1979).

Results

The survival rate, weight gain (WG), and specific growth rate (SGR) of S. scherzeri fed for 10 weeks at different feeding ratios are provided in Table 2. The feeding ratio did not affect the survival rates of the fish during the experimental period (p > 0.05). There were no significant (p > 0.05) differences in WG and SGR between the 100% satiation group and the 95%, 90%, 85%, and 80% satiation groups. However, the 100% satiation group showed significantly (p < 0.05) higher WGs and SGRs than the 75% and 70% satiation groups.

Table 2. Survival, weight gain, and specific growth rate of juvenile mandarin fish fed experimental diets with various feeding ratios for 10 weeks
Feeding ratio (%) Initial mean weight (g) Final mean weight (g) Survival (%)1) Weight gain (%)1) Specific growth rate (%/day)2)
100 9.7 ± 0.09 36.9 ± 0.66c 100 ± 0.0 256.6 ± 4.37b 1.82 ± 0.02b
95 9.5 ± 0.05 36.3 ± 0.92c 100 ± 0.0 263.5 ± 5.17b 1.84 ± 0.02b
90 9.6 ± 0.02 35.8 ± 0.81bc 100 ± 0.0 254.1 ± 11.97b 1.80 ± 0.05b
85 9.5 ± 0.01 34.8 ± 0.21bc 100 ± 0.0 250.1 ± 2.04b 1.79 ± 0.01b
80 9.5 ± 0.03 32.7 ± 1.21abc 100 ± 0.0 225.7 ± 13.24ab 1.68 ± 0.06ab
75 9.6 ± 0.07 31.2 ± 1.04ab 100 ± 0.0 202.8 ± 5.84a 1.58 ± 0.03a
70 9.5 ± 0.06 29.3 ± 1.64a 100 ± 0.0 191.2 ± 15.65a 1.52 ± 0.08a

Values (mean of triplicates ± SE) in the same column not sharing a common superscript are significantly different (p < 0.05).

1) Weight gain (%) = (final body weight − initial body weight) × 100 / initial body weight.

2) Specific growth rate = (Ln final weight of fish − Ln initial weight of fish) × 100 / days of feeding trial.

Download Excel Table

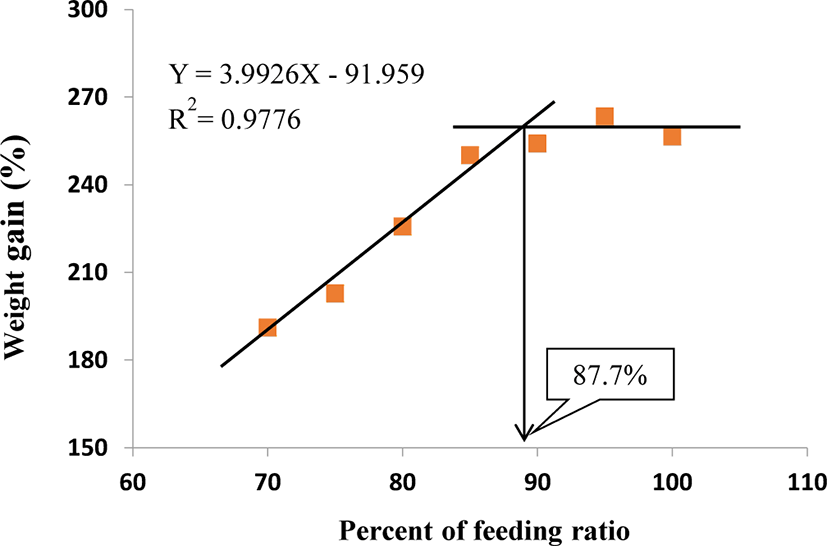
Table 3 shows FC, FI, FE, protein efficiency ratio (PER), and protein retention (PR) of the fish fed at different feeding ratios. The FC and FI of 100%, 95%, and 90% satiation groups were significantly higher than those of 85%, 80%, 75%, and 70% satiation group (p < 0.05), but there was no significant (p > 0.05) difference among 100%, 95%, and 90% satiation groups. Although there was no significant (p > 0.05) difference in PER and PR between the 100% satiation group and the 95% and 90% satiation groups, the 100% satiation group exhibited significantly (p > 0.05) lower PER compared with the 85%, 80%, 75%, and 70% satiation groups. The condition factor (CF), HSI, VSI, coefficient variation of body length (CVBL), and coefficient variation of body weight (CVBW) are presented in Table 4. The feeding ratio did not affect any of these parameters (p > 0.05). In a broken-line model analysis based on the WG of S. scherzeri at different feeding ratios, the optimal feeding ratio was found to be 87.7% of satiation (Fig. 1).

Table 3. Feed consumption, feed efficiency, protein efficiency ratio (PER), and protein retention (PR) of juvenile mandarin fish fed experimental diets with various feeding ratios for 10 weeks
Feeding ratio (%) Feed consumption (g/fish) Feed intake (%/day)1) Feed efficiency (%)2) PER PR
100 39.9 ± 0.85b 3.6 ± 0.04b 66.5 ± 0.79a 1.2 ± 0.01a 24.7 ± 0.68a
95 37.5 ± 1.31b 3.5 ± 0.05b 70.1 ± 0.77a 1.3 ± 0.01a 24.0 ± 0.88a
90 35.0 ± 0.36b 3.3 ± 0.07b 73.4 ± 2.96a 1.3 ± 0.05a 26.2 ± 0.75ab
85 28.7 ± 0.73a 2.7 ± 0.06a 86.8 ± 1.57b 1.6 ± 0.03b 31.0 ± 1.77bc
80 26.7 ± 1.59a 2.7 ± 0.08a 84.9 ± 0.46b 1.6 ± 0.01b 30.9 ± 0.93bc
75 24.5 ± 1.30a 2.5 ± 0.07a 85.4 ± 1.06b 1.6 ± 0.02b 32.2 ± 1.25c
70 22.6 ± 1.98a 2.4 ± 0.13a 85.3 ± 3.40b 1.6 ± 0.06b 31.5 ± 1.31bc

Values (mean of triplicates ± SE) in the same column not sharing a common superscript are significantly different (p < 0.05).

1) Feed intake (% body weight/day) = 100 × total consumed feed / [(final weight + initial weight) / 2] / feeding duration

2) Feed efficiency (%) = fish wet weight gain × 100 / feed intake (dry matter).

PER, weight gain of fish/protein consumed; PR, protein gain of fish/protein consumed.

Download Excel Table
Table 4. Condition factor (CF), hepatosomatic index (HSI), viscerosomatic index (VSI), coefficient variation of body length (CVBL), and body weight (CVBW) of juvenile mandarin fish fed experimental diets with various feeding ratios for 10 weeks
Feeding ratio (%) CF (%)1) HSI (%)2) VSI (%)3) CVBLi (%)4) CVBLf (%)5) CVBWi (%)6) CVBWf (%)7)
100 1.3 ± 0.02 1.9 ± 0.04 6.4 ± 0.03 2.9 ± 0.30 1.6 ± 0.3 1.2 ± 0.12 4.4 ± 1.59
95 1.2 ± 0.02 1.7 ± 0.11 6.5 ± 0.14 2.5 ± 0.25 1.5 ± 0.22 0.9 ± 0.08 4.3 ± 1.60
90 1.2 ± 0.03 1.8 ± 0.08 7.1 ± 0.75 2.8 ± 0.28 1.9 ± 0.26 1.3 ± 0.12 5.2 ± 1.81
85 1.2 ± 0.01 1.7 ± 0.12 6.4 ± 0.03 3.1 ± 0.30 1.8 ± 0.25 0.9 ± 0.09 4.4 ± 1.49
80 1.2 ± 0.02 1.8 ± 0.08 6.6 ± 0.04 3.4 ± 0.34 1.9 ± 0.27 1.3 ± 0.13 5.4 ± 1.79
75 1.2 ± 0.03 1.7 ± 0.25 6.4 ± 0.82 3.6 ± 0.37 1.9 ± 0.25 1.5 ± 0.14 5.2 ± 1.60
70 1.2 ± 0.05 1.5 ± 0.17 7.1 ± 0.15 3.2 ± 0.32 1.8 ± 0.33 1.2 ± 0.12 6.3 ± 1.85

Values (mean of triplicates ± SE) are not significantly different for any feeding treatment (p > 0.05).

1) CF(%) = [(weight of fish / (length of fish)3] × 100.

2) HSI (%) = (weight of liver / weight of fish) × 100.

3) VSI (%) = (weight of viscera / weight of fish) × 100.

4) CVBL (%)i = (standard deviation of initial length of fish / mean initial length of fish) × 100.

5) CVBL (%)f = (standard deviation of final length of fish / mean final length of fish) × 100.

6) CVBW (%)i = (standard deviation of initial weight of fish / mean initial weight of fish) × 100.

7) CVBW (%)f = (standard deviation of final weight of fish / mean final weight of fish) × 100.

Download Excel Table
fas-24-6-219-g1
Fig. 1. Optimum feeding ratio for mandarin fish based on the broken-line regression analysis of weight gain (%) against feeding ratio (%). Each point indicates the mean of triplicate of each feeding ratio group.
Download Original Figure

Proximate compositions of fish measured at the end of the experiment for each feeding ratio are shown in Table 5. Moisture, crude protein, crude lipid and crude ash contents of S. scherzeri were not significantly (p > 0.05) different according to the feeding ratio. The blood chemical contents of HCT, GLU, TP, TCHO, GOT, GPT, and HDLC in S. scherzeri fed various feeding ratio are presented in Table 6. The feeding ratio did not affect the contents of HCT, GLU, HDLC, GOT, TP, and GPT (p > 0.05). The 100% satiation group showed significantly (p < 0.05) higher TCHO contents compared with the 80%, 75%, and 70% satiation groups. However, the 100% satiation group did not show significant (p > 0.05) differences in TCHO levels compared with the 95%, 90%, and 85% satiation groups.

Table 5. Proximate composition (% of wet weight) of juvenile fish fed experimental diets with various feeding ratios for 10 weeks
Feeding ratio (%) Moisture (%) Crude protein (%) Crude lipid (%) Ash (%)
100 70.2 ± 0.27 20.3 ± 0.40 3.4 ± 0.08 5.5 ± 0.29
95 72.8 ± 1.10 18.7 ± 0.77 3.4 ± 0.25 5.1 ± 0.27
90 70.9 ± 0.41 19.5 ± 0.31 3.4 ± 0.20 5.5 ± 0.05
85 71.7 ± 1.07 19.5 ± 0.82 3.1 ± 0.18 5.3 ± 0.40
80 71.4 ± 0.23 19.9 ± 0.51 3.0 ± 0.30 5.5 ± 0.06
75 70.6 ± 0.97 20.6 ± 0.80 3.3 ± 0.18 5.6 ± 0.08
70 70.0 ± 0.94 20.2 ± 0.46 3.3 ± 0.23 5.4 ± 0.29

Values (mean of triplicates ± SE) are not significantly different for any feeding treatment (p > 0.05).

Download Excel Table
Table 6. Blood chemical contents of juvenile mandarin fish Siniperca scherzeri fed experimental diets with various feeding ratios for 10 weeks
Feeding ratio (%) HCT (%) GLU (mg/dL) TP (g/dL) TCHO (mg/dL) GOT (U/L) GPT (U/L) HDLC (U/L)
100 48.0 ± 0.5 382.5 ± 30.4 4.7 ± 0.2 225.4 ± 15.7c 71.9 ± 11.8 48.4 ± 19.9 110.0 ± 0.0
95 47.6 ± 0.6 375.4 ± 19.7 4.6 ± 0.2 201.8 ± 10.9abc 57.5 ± 7.9 26.3 ± 2.2 109.4 ± 0.4
90 47.5 ± 0.4 353.1 ± 18.6 4.7 ± 0.1 204.6 ± 7.3bc 52.9 ± 4.0 22.3 ± 1.4 110.0 ± 0.0
85 47.5 ± 0.5 366.8 ± 23.8 4.6 ± 0.1 199.7 ± 9.5abc 66.9 ± 14.7 49.4 ± 16.5 109.2 ± 0.8
80 47.3 ± 0.7 346.2 ± 27.8 4.5 ± 0.1 170.1 ± 8.9ab 64.3 ± 8.0 34.2 ± 5.2 104.6 ± 2.1
75 46.9 ± 0.8 341.1 ± 27.6 4.5 ± 0.1 161.3 ± 4.9a 72.7 ± 6.8 40.5 ± 3.2 104.3 ± 1.9
70 47.6 ± 0.6 344.2 ± 36.6 4.4 ± 0.2 168.5 ± 7.1ab 80.6 ± 8.3 48.3 ± 10.3 107.7 ± 1.5

Values (mean of triplicates ± SE, n = 10) in the same row not sharing a common superscript are significantly different (p < 0.05).

HCT, hematocrit; GLU, glucose; TP, total protein; TCHO, total cholesterol; GOT, glutamic oxaloacetic transaminase; GPT, glutamic pyruvic transaminase; HDLC, high-density lipoprotein cholesterol.

Download Excel Table

Discussion

In this study, reduction in the feeding ratio influenced the growth of S. scherzeri. A similar result was observed in some of the previous studies (Cho et al., 2006; Cho et al., 2007; Cleveland & Burr, 2011; Eroldoğan et al., 2004; Shimeno et al., 1997; Van Ham et al., 2003). Our results also showed that there were no differences in WG and SGR between the 100% satiation group and 80% satiation group (Table 2). The effect of feeding ratio on the fish growth was associated with the fish species and size. For instance, common carps (Cyprinus carpio) (Shimeno et al., 1997) and rainbow trouts (Oncorhynchus mykiss) (Cleveland & Burr, 2011) fed to 80% and 75% satiation, respectively, exhibited no significant differences in WG and SGR compared with fish from the same species fed to 100% satiation, whereas turbots (Scophthalmus maximus) (Blanquet & Oliva-Teles, 2010) exhibited a significant reduction in WG when fed to 90% satiation as opposed to being fed to 100% satiation. In their experiment on olive founders with initial body weights of 17–319 g, Cho et al. (2006) and Cho et al. (2007) reported no significant difference in WG and SGR between fish fed to 90% or 95% satiation and fish fed to 100% satiation and suggested that the optimal feeding ratio decreases as fish growth increases (Hatlen et al., 2005; Skalli et al., 2004; Sweilum et al., 2005).

The FE, PER, and PR in present study increased as the feeding ratio decreased whereas the FI showed opposite trends. Van Ham et al. (2003) reported increased FE and protein and energy retention in turbots fed to 65% satiation despite observing that the turbots had reduced growth compared with turbots fed to 100% satiation. Furthermore, Blanquet & Oliva-Teles (2010) reported that feeding efficiency marginally increased as the feeding ratio decreased. In general, feeding below satiation improved feeding efficiency, and indeed, this had been the case for striped bass (Cox & Coutant, 1981), minnow (Cui & Wootton, 1988), channel catfish (Ictalurus punctatus) (Li & Lovell, 1992; Xu et al., 2017), rainbow trout (Zoccarato et al., 1994), and yellowtail flounder (Limanda ferruginea) (Puvanendran et al., 2003). This was because increasing the feeding ratio reduces time for feed digestion and absorption in the intestines, thereby preventing efficient digestion (Henken et al., 1985; Liu & Liao, 1999). In contrast, studies have reported that the feeding ratio does not affect the FE, PER, and PR of olive founders (Cho et al., 2006; Cho et al., 2007) suggest that the effect of feeding ratio varies in different fish species.

The feeding ratio in this study was found not to affect CF, HSI, and VSI, which are used to evaluate the nutritional and physiological condition of fish (Eroldoğan et al., 2004; Mihelakakis et al., 2002). A similar results were previously reported for CF and HSI in oliver flounders (Cho et al., 2006; Cho et al., 2007) and for CF in European sea bass (Dicentrachus labrax) (Eroldoğan et al., 2004). However, it is known that the CF, HSI and VSI of fish are affected by feeding ratio or feeding rate according to many previous reports such as sea bass (Dicentrarchus labrax) (Hidalgo et al., 1987), striped bass (Morone saxatilis) (Hung et al., 1993), tropical bagrid catfish (Mystus nemurus) (Ng et al., 2000), and gilthead sea bream (Sparus aurata) (Mihelakakis et al., 2002), rainbow trout (Cleveland & Burr, 2011), and channel catfish (Xu et al., 2017). Eroldoğan et al. (2004) suggested that the HSI of European sea bass reared in seawater or freshwater decreased more than the VSI with feeding rate decrease, indicating that the liver is a more labile storage organ than viscera. In addition, since morphological indices such as CF and VSI can be affected not only feeding ratio but also by feed processing method (pelleting or extrusion) (Xu et al., 2017), future studies are required.

In this study, the feeding ratio did not affect the CVBW and CVBL. Similar results have been reported for tambaqui (Colossoma macropomum) (Silva et al., 2007) and turbots (Van Ham et al., 2003). Based on the results of this study, the feeding ratios of 70%–100% satiation promoted the growth of S. scherzeri weighing from 9.0 g to 37 g without affecting the CV in the body weight and total length. However, it has been reported in rock bream (Oplegnathus fasciatus) (Oh & Venmathi Maran, 2015) and in the hybrid sunfish (Wang et al., 1998) that an increase of diet allowance with feeding frequency can reduce size variation and produce fish of a uniform size.

There was no effect of the feeding ratio on the chemical composition (moisture, crude protein, lipid, and ash content) of S. scherzeri. Similar results had been reported for olive flounder (Cho et al., 2007). However, these results were inconsistent with previous reports that the lipid content increased as the feeding amount increases (Eroldoğan et al., 2004; Mihelakakis et al., 2002; Shimeno et al., 1997; Van Ham et al., 2003; Xu et al., 2017). Whole body composition of fish generally under low feeding ratio show the high protein content (Eroldoğan et al., 2004; Ng et al., 2000; Xu et al., 2017) and the low lipid content (Mihelakakis et al., 2002; Ng et al., 2000; Van Ham et al., 2003). Increase of body lipid content with increase feeding ratio was reported in previous studies such as tropical bagrid catfish (Ng et al., 2000), striped bass (Hung et al., 1993), sea bass (Eroldoğan et al., 2004), and channel catfish (Xu et al., 2017). Xu et al. (2017) reported that the decreased dietary protein ingested under a low feeding ratio is mainly used for tissue protein synthesis and maintenance other than energy metabolism, however increased dietary protein ingested under the high feeding ratio would be involved in energy metabolism and converted into lipid, resulting in a decrease in PR and an increase in body lipid content. In addition, the difference of body composition content such protein and lipid with diet allowance is also affected by temperature, salinity and feed composition, which demand further study in the future (Hidalgo et al., 1987; Xu et al., 2017).

Increasing the feeding ratio did not affect the blood HDLC, GLU, GOP, GPT, TP, and HCT contents of S. scherzeri but tended to increase the TCHO contents. Shimeno et al. (1997) reported similar results where the cholesterol, TP, GLU, triglycerides, and ammonia levels increased as the feeding ratio increased. Increasing the feeding ratio by increasing the feeding frequency led to elevated serum contents of TCHO in dark-banded rockfish (Sebastes inermis) (Oh et al., 2018). However, the feeding ratio does not affect serum GLU, TP, triglycerides, and GPT levels in olive flounder (Cho et al., 2006). It was also reported that reducing the feeding ratio can induce stress and increase serum GOP and GPT levels in fish (Mizanur & Bai, 2014; Okorie et al., 2013). Further studies are necessary to clarify such discrepancies.

The feeding ratio significantly affected the growth, body composition, and blood chemistry of juvenile mandarin fish. Our results showed that an optimal daily feeding ration for growth of juvenile mandarin fish weighing from 9.0 to 37 g was 87.7% of satiation using a broken-line analysis based on the feeding efficiency observed at feeding ratios of 100%–70% and WG (Fig. 1) under 26.1°C–27.7°C condition. Overall, the utilization efficiency of protein and feed were important parameters in the determination of improved growth performance by the restricted feeding ratio from 100% to 70% of satiation. These findings provide important information for aquaculturists trying to establish a profitable feeding strategy for optimizing the growth of juvenile mandarin fish.

Competing interests

No potential conflict of interest relevant to this article was reported.

Funding sources

Not applicable.

Acknowledgements

I would like to thank the staffs of the Chungcheongbuk-do Inland Fisheries Research Institute for helping with the experiment.

Availability of data and materials

Upon reasonable request, the datasets of this study can be available from the corresponding author.

Ethics approval and consent to participate

This article does not require IRB/IACUC approval because there are no human and animal participants.

References

1.

AOAC [Association of Official Analytical Chemists] International. Official methods of analysis of AOAC International. 16th ed Arlington, VA: AOAC International. 1995.

2.

Blanquet I, Oliva-Teles A. Effect of feed restriction on the growth performance of turbot (Scophthalmus maximus L.) juveniles under commercial rearing conditions. Aquacult Res. 2010; 41:1255-60

3.

Bureau DP, Hua K, Cho CY. Effect of feeding level on growth and nutrient deposition in rainbow trout (Oncorhynchus mykiss Walbaum) growing from 150 to 600 g. Aquac Res. 2006; 37:1090-8

4.

Cho SH, Lee SM, Park BH, Lee SM. Effect of feeding ratio on growth and body composition of juvenile olive flounder Paralichthys olivaceus fed extruded pellets during the summer season. Aquaculture. 2006; 251:78-84

5.

Cho SH, Lee SM, Park BH, Ji SC, Choi CY, Lee JH, et al. Effect of daily feeding ratio on growth and body composition of subadult olive flounder, Paralichthys olivaceus, fed an extruded diet during the summer season. J World Aquacult Soc. 2007; 38:68-73

6.

Cleveland BM, Burr GS. Proteolytic response to feeding level in rainbow trout (Oncorhynchus mykiss). Aquaculture. 2011; 319:194-204

7.

Cox DK, Coutant CC. Growth dynamics of juvenile striped bass as functions of temperature and ration. Trans Am Fish Soc. 1981; 110:226-38

8.

Cui Y, Wootton RJ. Bioenergetics of growth of a cyprinid, Phoxinus phoxinus: the effect of ration, temperature and body size on food consumption, faecal production and nitrogenous excretion. J Fish Biol. 1988; 33:431-43

9.

Eroldoğan OT, Kumlu M, Aktaş M. Optimum feeding rates for European sea bass Dicentrarchus labrax L. reared in seawater and freshwater. Aquaculture. 2004; 231:501-15

10.

Eroldoğan OT, Kumlu M, Kiris GA, Sezer B. Compensatory growth response of Sparus aurata following different starvation and refeeding protocols. Aquacult Nutr. 2006; 12:203-10

11.

Hatlen B, Grisdale-Helland B, Helland SJ. Growth, feed utilization and body composition in two size groups of Atlantic halibut (Hippoglossus hippoglossus) fed diets differing in protein and carbohydrate content. Aquaculture. 2005; 249:401-8

12.

Henken AM, Kleingeld DW, Tijssen PAT. The effect of feeding level on apparent digestibility of dietary dry matter, crude protein and gross energy in the African catfish Clarias gariepinus (Burchell, 1822). Aquaculture. 1985; 51:1-11

13.

Hidalgo F, Alliot E, Thebault H. Influence of water temperature on food intake, food efficiency and gross composition of juvenile sea bass, Dicentrarchus labrax. Aquaculture. 1987; 64:199-207

14.

Hung SSO, Conte FS, Hallen EF. Effects of feeding rates on growth, body composition and nutrient metabolism in striped bass (Morone saxatilis) fingerlings. Aquaculture. 1993; 112:349-61

15.

Lee SM, Cho SH, Kim DJ. Effects of feeding frequency and dietary energy level on growth and body composition of juvenile flounder, Paralichthys olivaceus (Temminck & Schlegel). Aquac Res. 2000a; 31:917-21

16.

Lee SM, Hwang UG, Cho SH. Effects of feeding frequency and dietary moisture content on growth, body composition and gastric evacuation of juvenile Korean rockfish (Sebastes schlegeli). Aquaculture. 2000b; 187:399-409

17.

Li M, Lovell RT. Comparison of satiate feeding and restricted feeding of channel catfish with various concentrations of dietary protein in production ponds. Aquaculture. 1992; 103:165-75

18.

Li MH, Robinson EH, Bosworth BG. Effects of periodic feed deprivation on growth, feed efficiency, processing yield, and body composition of channel catfish Ictalurus punctatus. J World Aquacult Soc. 2005; 36:444-53

19.

Li SZ. Geographic distribution of the Sinipercinae fishes. Chin J Zool. 1991; 26:40-4.

20.

Liang XF, Kiu JK, Huang BY. The role of sense organs in the feeding behaviour of Chinese perch. J Fish Biol. 2005; 52:1058-67

21.

Liu FG, Liao CI. Effect of feeding regimen on the food consumption, growth and body composition in hybrid striped bass Morone saxitilis × M. chrysops. Fish Sci. 1999; 65:513-9

22.

Liu J, Cui Y, Liu J. Food consumption and growth of two piscivorous fishes, the mandarin fish and the Chinese snakehead. J Fish Biol. 1998; 53:1071-83

23.

Meyer-Burgdorff KH, Osman MF, Günther KD. Energy metabolism in Oreochromis niloticus. Aquaculture. 1989; 79:283-91

24.

Mihelakakis A, Tsolkas C, Yoshimatsu T. Optimization of feeding rate for hatchery-produced juvenile gilthead sea bream Sparus aurata. J World Aquacult Soc. 2002; 33:169-75

25.

Mizanur RM, Bai SC. The optimum feeding frequency in growing Korean rockfish (Sebastes schlegeli) rearing at the temperature of 15°C and 19°C. Asian-Australas J Anim Sci. 2014; 27:1319-27

26.

Mo AJ, Sun JX, Wang YH, Yang K, Yang HS, Yuan YC. Apparent digestibility of protein, energy and amino acids in nine protein sources at two content levels for mandarin fish, Siniperca chuatsi. Aquaculture. 2019; 499:42-50

27.

Ng WK, Lu KS, Hashim R, Ali A. 2000; Effects of feeding rate on growth, feed utilization and body composition of a tropical bagrid catfish. Aquacult Int. 2000; 8:19-29

28.

Oh SY, Venmathi Maran BA. Feeding frequency influences growth, feed consumption and body composition of juvenile rock bream (Oplegnathus fasciatus). Aquacult Int. 2015; 23:175-84

29.

Oh SY, Venmathi Maran BA, Park JW. Effect of feeding frequency on growth, food consumption, proximate composition, and blood chemistry of juvenile dark-banded rockfish, Sebastes inermis. J World Aquacult Soc. 2018; 49:994-1001

30.

Okorie OE, Bae JY, Kim KW, Son MH, Kim JW, Bai SC. Optimum feeding rates in juvenile olive flounder, Paralichthys olivaceus, at the optimum rearing temperature. Aquacult Nutr. 2013; 19:267-77

31.

Puvanendran V, Boyce DL, Brown JA. Food ration requirements of 0+ yellowtail flounder Limanda ferruginea (storer) juveniles. Aquaculture. 2003; 220:459-75

32.

Robbins KR, Norton HW, Baker DH. Estimation of nutrient requirements from growth data. J Nutr. 1979; 109:1710-4

33.

Sankian Z, Khosravi S, Kim YO, Lee SM. Effect of dietary protein and lipid level on growth, feed utilization, and muscle composition in golden mandarin fish, Siniperca scherzeri. Fish Aquatic Sci. 2017; 20:7

34.

Sankian Z, Khosravi S, Kim YO, Lee SM. Effects of dietary inclusion of yellow mealworm (Tenebrio molitor) meal on growth performance, feed utilization, body composition, plasma biochemical indices, selected immune parameters and antioxidant enzyme activities of mandarin fish (Siniperca scherzeri) juveniles. Aquaculture. 2018; 496:79-87

35.

Sankian Z, Khosravi S, Kim YO, Lee SM. Dietary protein requirement for juvenile mandarin fish, Siniperca scherzeri. J World Aquacult Soc. 2019; 50:34-41

36.

Shimeno S, Shikata T, Hosokawa H, Masumoto T, Kheyyali D. Metabolic response to feeding rates in common carp, Cyprinus carpio. Aquaculture. 1997; 151:371-7

37.

Silva CR, Gomes LC, Brandão FR. Effect of feeding rate and frequency on tambaqui (Colossoma macropomum) growth, production and feeding costs during the first growth phase in cages. Aquaculture. 2007; 264:135-9

38.

Skalli A, Hidalgo MC, Abellán E, Arizcun M, Cardenete G. Effects of the dietary protein/lipid ratio on growth and nutrient utilization in common dextex (Dentex dentex L.) at different growth stages. Aquaculture. 2004; 235:1-11

39.

Su SQ, Zhang HQ, He ZY, Zhang ZX. A comparative study of the nutrients and amino acid composition of the muscle of Siniperca chuatsi and Siniperca scherzeri. J Southwest Agric Univ. 2005; 27:898-901.

40.

Sweilum MA, Abdella MM, Salah El-Din SA. Effect of dietary protein-energy levels and fish initial sizes on growth rate, development and production of Nile tilapia, Oreochromis niloticus L. Aquacult Res. 2005; 36:1414-21

41.

Van Ham EH, Berntssen MHG, Imsland AK, Parpoura AC, Wendelaar Bonga SE, Stefansson SO. The influence of temperature and ration on growth, feed conversion, body composition and nutrient retention of juvenile turbot (Scophthalmus maximus). Aquaculture. 2003; 217:547-58

42.

Wang N, Hayward RS, Noltie DB. Effect of feeding frequency on food consumption, growth, size variation, and feeding pattern of age-0 hybrid sunfish. Aquaculture. 1998; 165:261-7

43.

Xie F, Ai Q, Mai K, Xu W, Ma H. The optimal feeding frequency of large yellow croaker (Pseudosciaena crocea, Richardson) larvae. Aquaculture. 2011; 311:162-7

44.

Xu H, Li X, Sun W, Chen J, Gao Q, Shuai K, et al. Effects of different feeding rates of extruded and pelleted feeds on growth and nutrient retention in channel catfish (Ictalurus punctatus). Aquacult Int. 2017; 25:1361-72

45.

Yuan YC, Yang HJ, Gong SY, Luo Z, Yuan HW, Chen XK. Effects of feeding levels on growth performance, feed utilization, body composition and apparent digestibility coefficients of nutrients for juvenile Chinese sucker, Myxocyprinus asiaticus. Aquacult Res. 2010; 41:1030-42

46.

Zhang L, Wang YJ, Hu MH, Fan QX, Chenung SG, Shin PKS, et al. Effects of the timing of initial feeding on growth and survival of spotted mandarin fish Siniperca scherzeri larvae. J Fish Biol. 2009; 75:1158-72

47.

Zhou C, Yang Q, Cai D. On the classification and distribution of the Sinipercinae fishes (Family Serranidae). Zool Res. 1988; 9:113-25.

48.

Zoccarato I, Benatti G, Bianchini ML, Boccignone M, Conti A, Napolitano R, et al. Differences in performance, flesh composition and water output quality in relation to density and feeding levels in rainbow trout, Oncorhynchus mykiss (Walbaum), farming. Aquacult Res. 1994; 25:639-47