


Introduction
Extrusion cooking, widely used in the manufacturing of snacks, cereals, and seasoning bases, is a process involving a combination of high temperature, pressure, and mechanical shear forces. It causes a thermal reaction in food raw materials within a short period and is simultaneously molded (Ilo et al., 2000; Lee, 2004). Being a high-temperature and less time-consuming process, extrusion cooking process has the advantage of considerably reducing the reaction time compared to the existing batch flavor manufacturing process. In addition, it can induce the formation of food flavors through the Maillard reaction of amino acids and sugars, which can be useful for developing seasoning materials (Riha & Ho, 1998; Yaylayan et al., 1992). In a similar study, clams were used to prepare seasoning materials, using an extruder (Shin et al., 2020).
Sea mustard (Undaria pinnatifida), which belongs to the brown algae of the Laminariales order, is distributed on the entire coastline of Korea and has been widely consumed as a food and dietary supplement. It contains various bioactive compounds, including polysaccharides, carotenoids, tocopherols, phycobilins, phycocyanins, vitamins, fatty acids, and sterols (Wang et al., 2018). Owing to these constituents, the products or extracts of sea mustard have been reported to exhibit antioxidant, anticancer, anticoagulant, anti-inflammatory, anti-diabetic, and anti-microbial properties (Ngo et al., 2011; Zhao et al., 2018). In particular, it is rich in iodine and calcium; therefore, women in Korea have long been consuming sea mustard soup postpartum for quick to recovery (Kolb et al., 2004; Prabhasankar et al., 2009; Shin, 2009). Sea mustard soup is one of the most consumed soups by Koreans and is commercialized and consumed as a home meal replacement.
In this study, we aimed to optimize the extrusion cooking conditions for preparing a high preference seasoning base from U. pinnatifida. The optimization of the extrusion cooking process for the sea mustard seasoning base was performed via a statistical technique, response surface methodology (RSM). In addition, we used an electronic nose and tongue to compare the changes in the sensory evaluation characteristics following extrusion cooking under different conditions.
Materials and Methods
For producing a seasoning base from sea mustard, dried sea mustard powder, purchased from BasisFood (Jincheon, Korea), was filtered using a vibration medium of 40-mesh before extrusion cooking. Corn starch (CJ Cheiljedang, Seoul, Korea), soybean protein (ISP, Solae LLC, St. Louis, MO, USA), skimmed soybean (Maeil Food, Suncheon, Korea), yeast extract (Samhyeon Hudis, Seongnam, Korea), and glucose (Weifang Shengtai Medicine, Shandong, China) were used as seasoning ingredients. The seasoning ingredients were constructed through pre-experiments to combine seaweed with extrusion cooking and maximize the flavor of the seasoning through the Maillard reaction. The pre-experiment was conducted according to Shin et al. (2020). All other reagents and chemicals used in the experiments were of analytical grade.
Before the extrusion cooking process, sea mustard powder (36.0%), corn starch (44.0%), soybean protein (4.5%), skimmed soybean (4.5%), and other amino acid compounds (11.0%) were homogenized using a mixer and filtered through a 30-mesh net. A twin-screw extruder (model DNDL-44, Buhler Brothers, Uzill, Switzerland) and a circular injection port with a diameter of 2 mm were used for extrusion cooking. Sea mustard seasoning extrudate was prepared at different screw rotational speeds (158–315 rpm) and barrel temperatures (140°C–160°C), while maintaining the input speed and water content of sea mustard mixing at 17 kg/h and 22%, respectively. The extrudate that passed through the extruder was dried for 24 h at 55°C and subsequently crushed using a mixer to prepare the final sea mustard seasoning base powder.
To develop a sea mustard seasoning base with a high preference, the extrusion cooking process was optimized via RSM. The experiment was planned according to a central composite design (CCD). The CCD matrix in the experimental design consisted of four factorial points, four axial points, and three central points (Cho et al., 2005). The barrel temperature (X1, °C) and screw speed (X2, rpm) of the extruder device were selected as independent variables. The range and center point values of the two independent variables were based on the results of preliminary experiments (Table 1). The overall acceptance (Y, points) was selected as the dependent variable, which was combined with the independent variables presented in Table 2. The experimental run was conducted in random order to minimize the effects of unexpected variability.
| Independent variables | Symbol | Range and levels | ||||
|---|---|---|---|---|---|---|
| −1.414 | −1 | 0 | +1 | +1.414 | ||
| Barrel temperature (°C) | X 1 | 140 | 143 | 150 | 157 | 160 |
| Screw speed (rpm) | X 2 | 158 | 181 | 236.5 | 537 | 315 |
The experimental data were analyzed using the MINITAB statistical program (version 16, Minitab, Harrisburg, PA, USA) and used to fit the following response model equation:
where, Y is a dependent variable (overall acceptance); β0 is a constant; βi, βii, and βij are regression coefficients; and Xi and Xj are the levels of independent variables. The optimization of the extrusion cooking process conditions for developing the sea mustard seasoning base was performed using the response optimizer of the MINITAB statistical program. The value of the estimated dependent variable was verified by comparing it with the value of the dependent variable obtained through the actual experiment under statistically predicted optimal conditions. Moreover, a three-dimensional response surface plot was created using the MAPLE software (MAPLE version 7, Maple Soft, Waterloo, ON, Canada).
Sensory evaluation was conducted by a panel comprising 13 trained professionals (six males and seven females) aged 22–27 years, belonging to the Department of Food Engineering at Pukyong National University. For sensory evaluation, sea mustard seasoning bases manufactured via the extrusion cooking process according to the RSM experimental design were dissolved in hot water at 75°C at a concentration of 5% (w/v), heated to 100°C for 3 min, and subsequently used in the form of warm soup. The contents were evaluated for overall acceptance as well as umami, and unpleasant seaweed flavor according to the characteristics of sea mustard-derived seasoning materials. Sensory evaluation was performed using a 9-point hedonic scale (1 point: very bad, 5 points: not bad, 9 points: very good).
The taste components of each sample were analyzed using an electronic tongue system (ASTREE II, Alpha MOS, Toulouse, France). The electronic tongue system combined several sensors that detect individual taste components, including five basic tastes (UMS: umami, BRS: bitterness, STS: saltiness, SWS: sweetness, SRS: sourness) and two additional taste-related references (GPS: metallic, SPS: spiciness). For electronic tongue analysis, each sample manufactured via extrusion cooking was stirred with 200 mL of deionized water for 3 min at 100°C and subsequently extracted by stirring for 1 h at 50°C at 150 rpm. In addition, each sample was filtered to remove sediments. Thereafter, extracts were diluted 1:1 (w/w) with deionized water. The sample solution (100 mL) was mounted on the sampler of the electronic tongue, and the strength of the taste components related to the sensor was measured by immersing the sensor in the sample solution for 120 s. Each sensor was sufficiently washed with deionized water to reduce errors caused by contamination between samples. The analysis was repeated five times per sample, and each sensor value was compared with the taste pattern using principal component analysis (PCA) (Lee et al., 2020).
An electronic nose system with flame ionization detectors and an MXT-5 column (HERACLES Neo, Alpha MOS) was used to analyze the volatile compounds in each sample. Following the production of extracts via the same method as for the electronic tongue samples, 5 mL of each extract was placed in a headspace vial for electronic nose analysis. Following stirring at 500 rpm for 10 min at a temperature of 50°C to saturate volatile compounds in the headspace, 5 mL of volatile compounds was collected using a syringe. The volatile compounds were analyzed using an automatic sample collector installed in the electronic nose system. Briefly, the volatile components were injected into gas chromatography inlets mounted on the electronic nose system. The trap absorption and desorption temperatures were 40°C and 250°C, respectively. The oven temperature program was initiated at 40°C for 5 s, increased to 270°C at a rate of 4°C/s, and maintained for 30 s. To confirm the odor pattern, the analysis was repeated thrice per sample. For the retention index, individual compounds were identified through the time of the separated peak using AroChemBase (Alpha MOS) based on Kovat’s index library. In addition, the discriminatory patterns between samples were confirmed through multivariate analysis (Hong et al., 2021).
Results and Discussion
To fit the quadratic polynomial model equation, the experimental data were analyzed using the response surface regression procedure in MINITAB statistical software. Table 3 shows the coefficients and p-values of linear (X1, X2), quadratic (X1X1, X2X2), and interaction (X1X2). All linear, quadratic, and interaction coefficients, except the X2X2 term (p = 0.961), were significant (p < 0.05). The response surface model equations for dependent variables are presented in Table 4. The coefficient of determination (R2) for Y was 0.945, indicating the suitability of the model (Islam Shishir et al., 2016). The response surface model had a high R2 value and was statistically significant (p = 0.004). The high R2 value was induced by an adequate experimental design established from the preliminary test (Cho et al., 2005).
| Parameters | Constant | X 1 | X 2 | X 1 X 1 | X 2 X 2 | X 1 X 2 | |
|---|---|---|---|---|---|---|---|
| Y | Coefficient | 7.2330 | 0.2561 | 0.4018 | −0.4042 | −0.0042 | −0.3000 |
| p-value | 0.000 | 0.013 | 0.002 | 0.004 | 0.961 | 0.026 | |
| Quadratic polynomial model equation | R 2 | p-value |
|---|---|---|
| Y = 7.233 + 0.2561X1 + 0.4018X2 – 0.4042X12 – 0.0042X22 – 0.3000X1X2 | 0.945 | 0.004 |
The quality of the fitted response surface model was evaluated using an analysis of variance (ANOVA). The ANOVA for the model that explains the response of the dependent variable is shown in Table 5. All regression equations were significant (p < 0.05) at the 95% probability level. The p-value of the lack-of-fit test for the response surface model was higher than 0.05 (p = 0.207), indicating that the functional relationship between the dependent and independent variables was adequately explained through the response surface model (Isa et al., 2011).
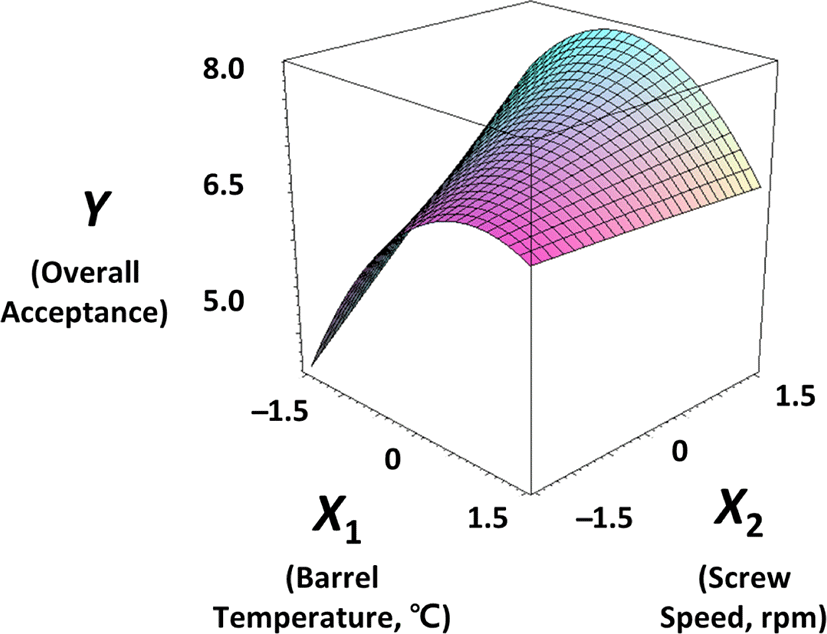
The interrelationship between two independent variables and one dependent variable is presented by a response surface plot, and the effect of independent variables on overall acceptance is depicted in Fig. 1. When the coded value of barrel temperature (X1) was close to −0.3 (approximately 148°C), overall acceptance (Y) increased. The overall acceptance marginally increased with an increase in screw speed (X2). Heat dissipation occurs because of the mechanical movement of the internal screw during the operation of the extruder (Verma et al., 2021). Therefore, the mechanical rotational energy of the motor is supplied, and part of it is converted into heat energy. Eventually, the raw food material receives additional heat energy (Chung & Lee, 1997). Therefore, the rotational heat of the screw is added to promote the Maillard reaction, which induces peculiar scents such as meat and savory scents, to increase the flavor of the product. However, as preference decreased after a certain screw speed in this study, excessive heat was supplied to the material, leading to excessive carbonation and low preference (Kim et al., 2006).
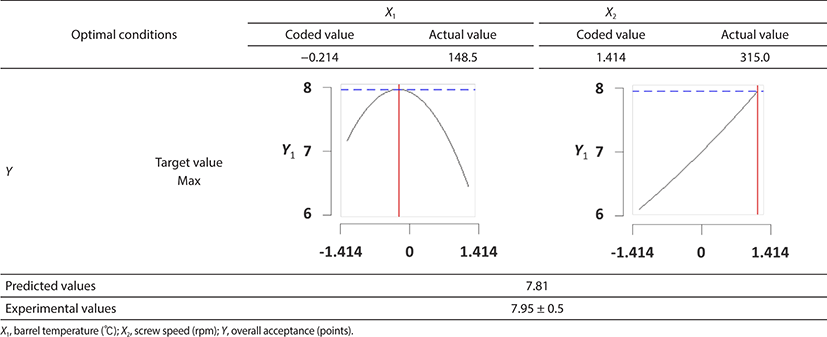
The optimal extrusion cooking conditions with maximum overall acceptance (Y) were statistically determined using the response optimizer of MINITAB statistical software. The optimal values of X1 (barrel temperature) and X2 (screw speed) had the coded values of −0.214 (148.5°C) and 1.414 (315 rpm), respectively (Fig. 2). Under optimal conditions, the predicted value of the dependent variable Y was 7.81. A verification test was conducted according to the optimal conditions to compare the predicted values of dependent variables (Cho et al., 2005; Yoon et al., 2017). The experimental value of Y was 7.95 ± 0.5, which was close to the predicted value. Therefore, the estimated response surface model was adapted to the manufacturing conditions of the sea mustard seasoning base.
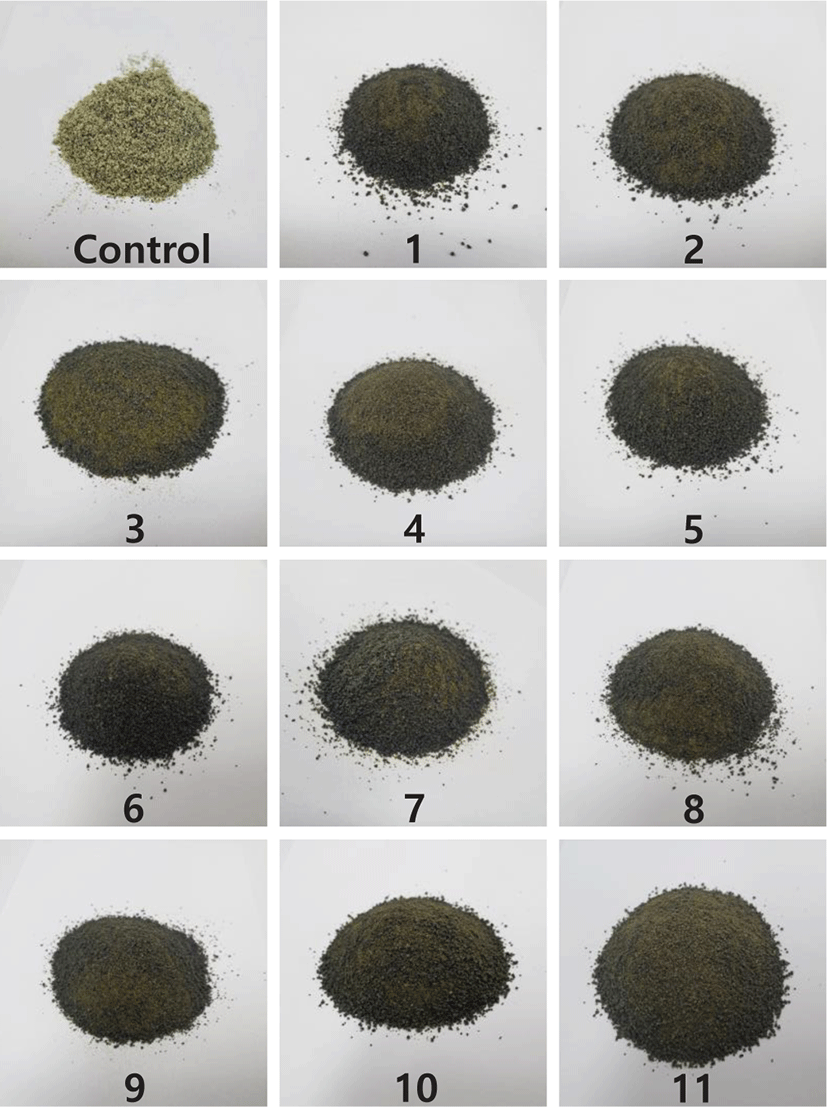
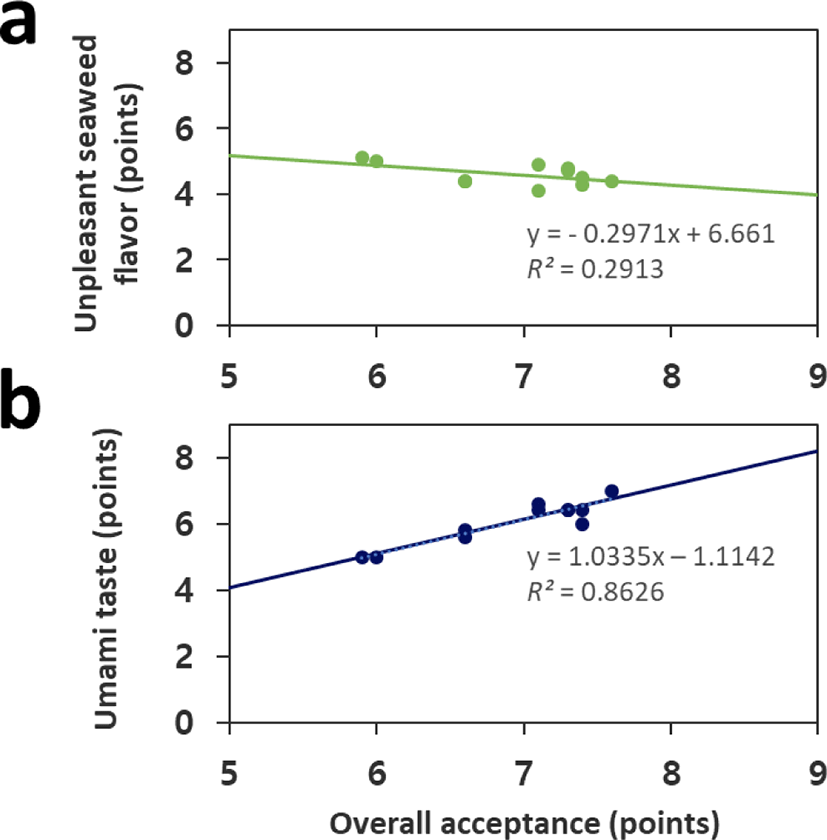
While designing the experiment to optimize extrusion cooking conditions for the production of sea mustard seasoning bases, the overall acceptance (Y) was considered as a dependent variable. Moreover, to better understand the effects of extrusion cooking on the sensory properties of sea mustard seasoning base, umami taste, and unpleasant seaweed flavor were evaluated together with overall acceptance. The appearances of the samples are shown in Fig. 3, and the color difference between the control and RSM sample groups is clear. However, as the difference within the RSM sample group was subtle, appearance was excluded from the sensory characteristic evaluation. Fig. 4 shows the correlations between umami taste, unpleasant seaweed flavor, and overall acceptance. In the RSM experiments, the unpleasant seaweed flavor did not significantly correlate (R2 = 0.2913) with overall acceptance, whereas overall acceptance was proportional to the umami taste (R2 = 0.8626). The Maillard reaction increased the intensity of umami taste by generating flavor or peptides that increase the flavor, and these results have also been reported by others as changes in the taste components of soybean protein, peanut protein, shellfish, and bovine bone marrow (Normah & Noorasma, 2018; Ogasawara et al., 2006; Xu et al., 2018; Zhang et al., 2019). These results clearly suggest that extrusion cooking increases the overall acceptance by increasing the umami taste, although it does not reduce the unpleasant seaweed flavor.
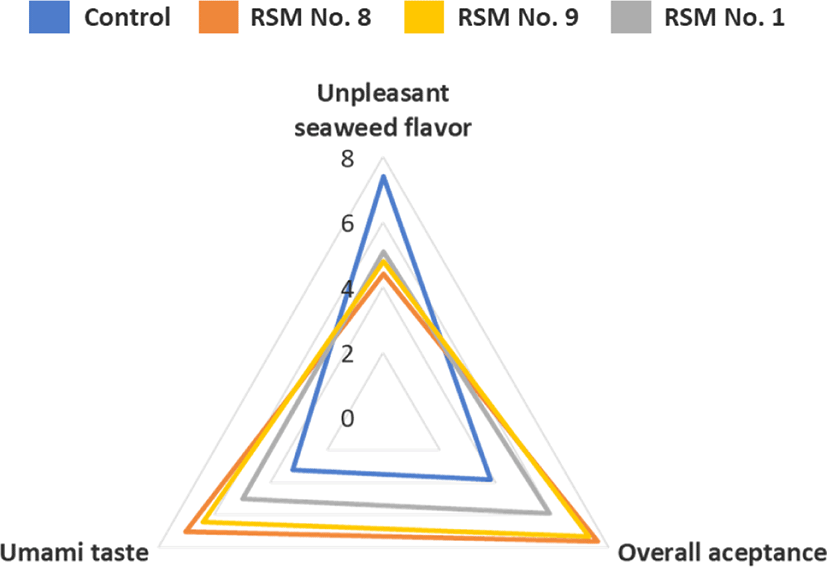
Subsequently, we compared the sensory characteristics of samples No. 8, No. 9, and No. 1 with the highest, middle, and lowest overall acceptance, respectively, to the untreated control sample (Fig. 5). The four samples were compared for unpleasant seaweed flavor, umami taste, and overall acceptance. Samples No. 8, No. 9, and No. 1 exhibited a higher umami taste and overall acceptance, and a lower unpleasant seaweed flavor than the control. In addition, for unpleasant seaweed flavor, sample No. 1, No. 9, and No. 8 were similar. This result indicated that extrusion cooking reduces the unpleasant seaweed flavor and increases the umami taste and overall acceptance, similar to the results of Wang et al. (2020). Therefore, the optimization of the extrusion cooking process is necessary for manufacturing sea mustard seasoning bases with a high degree of overall acceptance.
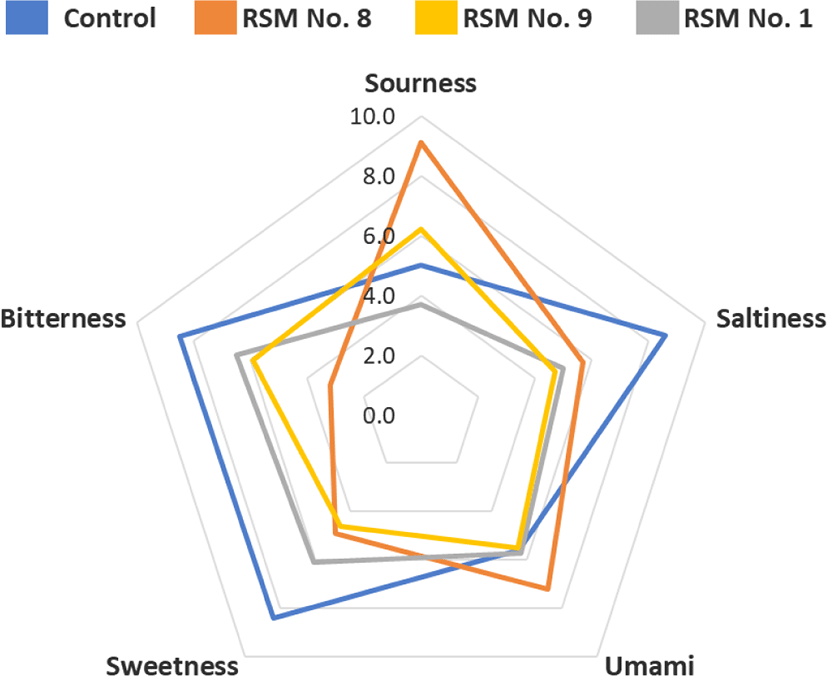
Electronic tongue analysis has complementarity for threshold values that exhibit differences between panels, and has the characteristic of showing relative strength to basic taste ingredients. Moreover, it is widely used for food quality evaluation by providing a pattern of comprehensive taste ingredients and the relative taste strength of a large amount of food in a short time (Peris & Escuder-Gilabert, 2016). In this study, to compare the relative strengths of taste components between samples, the five basic taste components of the control, No. 1, No. 8, and No. 9 samples were analyzed (Fig. 6). Samples No. 1, No. 8, and No. 9 had the lowest, best, and intermediate preferences among the RSM experimental groups, respectively. In the case of sample No. 8, which had the best overall preference, high sourness (9.1 level) and umami (7.2 level) were confirmed in the comparison between the control and other RSM samples. In the case of sourness, the higher the sensory preference among the RSM experimental groups, the greater the sourness intensity. Saltiness was considerably less in the RSM sample group that underwent the extrusion cooking process than in the control. For umami, which is a major characteristic of seaweed taste, RSM No. 8 was the highest (7.2 level). Bitterness was highest in the control sample (8.5 level), and the better the sample preference, the less the bitter intensity. These results confirmed that extrusion cooking reduces bitterness, saltiness, and sweetness, which is similar to the results of sensory evaluation.
The volatile compounds in the four samples were analyzed using an electronic nose, and the results are presented in Table 6. Eighty-eight components in eight groups were detected, including five volatile furans, 14 volatile aldehydes, four volatile heterocyclic compounds, 12 volatile hydrocarbons, 17 volatile acids and esters, 18 volatile alcohols, 10 volatile ketones, and eight volatile sulfur-containing compounds. Among these volatile compounds, furans were most abundant in the control sample, followed by RSM No. 1. Overall, the RSM sample group identified that the number of furans exhibited a tendency of relative decrease compared to the control sample. Among the RSM sample groups, RSM No. 8 exhibited the highest number of aldehydes and heterocyclic compounds, with hexanal and aniline being the most abundant, respectively. Among the hydrocarbons, RSM No. 9 was the most abundant, particularly β-caryophyllene, which has a sweet odor. RSM No. 9 and No. 1 exhibited similar detection amounts for acids and esters, alcohols, ketones, and sulfur-containing compounds, respectively, and exhibited relatively higher contents than RSM No. 8 and the control.
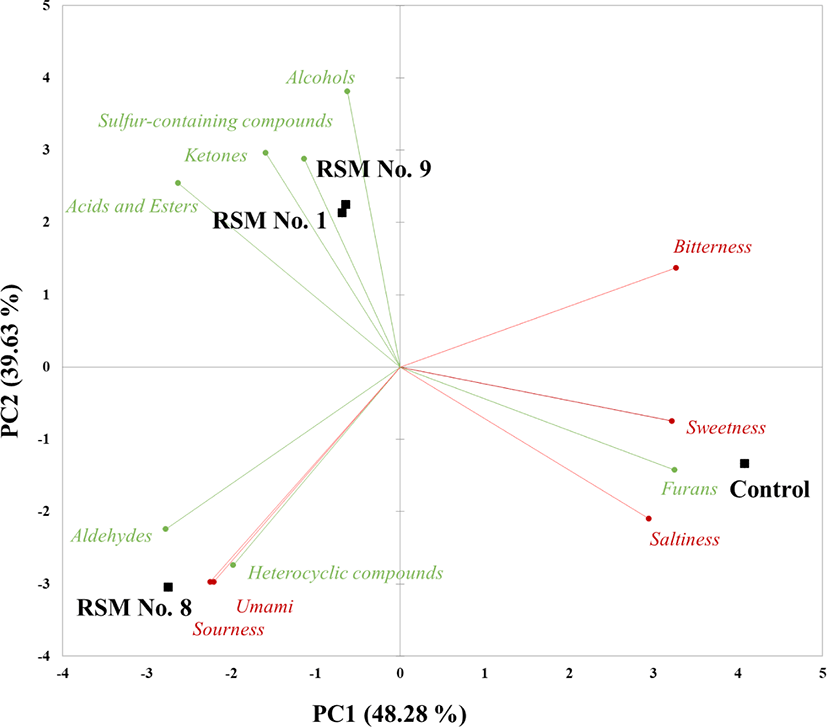
The taste and volatile components of samples identified through the electron tongue and the electron nose were separated via PCA, a multivariate analysis (Fig. 7). In the PCA, the horizontal axis (PC1) and vertical axis (PC2) exhibited variances of 48.28% and 39.63 %, respectively, and a total of PCs exhibited 87.91% variance. Most samples were separated by PC1, and the control sample was on the positive axis of PC1, far from RSM sample groups. Thus, extrusion cooking can influence odor activation in sea mustard seasoning bases (Hong et al., 2021). RSM No. 9 and No. 1 were located along the positive axis of PC2. Alternatively, RSM No. 8 was located on the negative axis of PC2. RSM No. 8 was separated by volatile compounds of aldehydes and heterocyclic compounds and tastes of umami and sourness; thus, RSM No. 8 was located in the 3rd quadrant. RSM No. 1 and No. 9 were separated by acids, esters, ketones, sulfur-containing compounds, and alcohols; thus, these RSM samples were located in the 2nd quadrant. The control was separated by volatile furans and the taste of sweetness and saltiness; thus, the control sample was located in the 4th quadrant. In particular, bitterness was located in the 1st quadrant, which was opposite to RSM No. 8, and the preference was improved by greatly reducing the bitterness via optimization of the extrusion cooking conditions. The PCA results were similar to those of the sensory evaluation, and the RSM design of this study was confirmed suitable for optimization to manufacture sea mustard seasoning base.
In summary, this study presents the successful development of a high preference sea mustard seasoning base via extrusion cooking. Statistically, optimization was also successfully performed. In addition, using an electronic nose and tongue, it was confirmed that the flavor compounds were strengthened by extrusion cooking. In addition, the changes in the flavor compound profile due to extrusion cooking were confirmed. Overall, our study provides important basic data for developing various seasonings using seaweed.