Introduction
The sea cucumber, Apostichopus japonicus is one of the most important fishery resources in the northwest Pacific countries (Liu, 2015). As its demand increased in Asian countries, the natural stocks of A. japonicus have dramatically decreased for a couple of decades mainly due to its overexploitation (Lin & Zhang, 2015). Therefore, Korean central and local governments have sponsored the release of the artificially produced seeds since 2004 to restore its natural stocks along the coastal waters. However, artificial restoration of the sea cucumber stock by the hatchery production raises concerns regarding its sustainable genetic diversity among the natural population. Since knowledge of genetic structure is essential for the scientific management of the fish resources maintaining an effective population size and genetic diversity (Abdul-Muneer, 2014), it is necessary to tracking the genetic diversity of both wild and released cultured sea cucumbers along the Korean coastal waters.
Most genetic analyses have been conducted by the comparison of genetic marker sequences, which was amplified by polymerase chain reaction (PCR) from the extracted genomic DNA of individual specimen. However, those methods for analyzing genetic resources through capture often destroy organisms and habitats, which is not desirable for the purpose of sustainable fishery resource management (Bonar et al., 2009; Murphy & Willis, 1996). Molecular analysis using environmental DNA (eDNA) samples is an emerging approach for the biomonitoring with little environmental impacts during sample collection. eDNA generally refers the extracellular DNAs in environments (sediment, water, or air), which have released from skin, mucous, saliva, sperm, secretions, eggs of organisms (Bohmann et al., 2014; Goldberg et al., 2016). As a cost-effective and sensitive tool, eDNA analysis has been employed in the various ecological research topics, including biodiversity (Evans et al., 2017), pathogen detection (Bastos Gomes et al., 2017), endangered or invasive species detection (Rees et al., 2014), or ecosystem health and dynamics (Evrard et al., 2019). Besides the ecological survey based on the species identification, the population genetic analyses have been employed using eDNA samples (Azarian et al., 2021; Sigsgaard et al., 2016). Those results strongly suggested that eDNA-based genetic analysis would be one of the most promising tools to overcome the issues related to the traditional biomonitoring methods, which is often expensive, invasive, destructive, or limited accessibility (Parsons et al., 2003). Despite the wide range of applications of eDNA, the optimization condition for each analysis is different in each research group and there is a strong need to establish a systematic standardized protocol for the feasibility.
For the genetic analysis directly from water sample, the quality of quantity of the obtained eDNA should meet the variety of genetic assay methods with different markers. Both microsatellites and mitochondrial DNA (mtDNA) are among the most widely used markers for various genetic diversity analyses (Bos et al., 2008). The complete mitochondrial genome has distinct advantages: a small sequence (~16 kb), a single and no-recombination locus and the maternally inherited, making it a better marker to reconstruct phylogenetic relationships than a single gene or partial genome sequences (Jiang et al., 2016). The rapid evolution of mtDNA plays a very important role in population genetics (Brown et al., 1982). Some regions of the mtDNA genome appear to evolve at a rate of 5–10 times higher than that of single-copy nuclear DNA (Sultana & Sultan, 2018). The haploid properties of mtDNA are positively correlated with the size of the effective population of a species, which can be used to follow the variance within a highly related classification group (DeSalle et al., 2017). However, since it is maternally inherited, and mitochondrial DNA markers is not useful to detect hybrids. Therefore, the nuclear DNA markers should be used for the cases. In fact, both nuclear and mitochondrial DNA markers are widely used (Harrison, 1989; Liu et al., 2018) and the feasibility of eDNA should be examined using the both molecular markers.
Quantitative real-time PCR (qPCR) is currently used for species-specific qualitative and quantitative analysis of environmental DNA. Compared with the end-point PCR, the accurate quantitative measurement of copy numbers can be possible using qPCR. Among the various factors in the qPCR assays, the quality of primer is one of the most important factors for the successful measurement. Besides its high specificity for target taxa, sensitivity such as limit of detection (LOD) and limit of quantification (LOQ) also should be considered to evaluate the primer set. LOD refers to the lowest standard concentration of template DNA that produces at least 95% positive replicates using a 95% detection rate as a standard confidence level (Forootan et al., 2017). LOQ is the minimum concentration of an analyte in a sample that can be quantitatively measured with a specified precision to confirm the ability to accurately quantify copy number (Armbruster & Pry, 2008). We here optimized the pretreatment protocol for the genetic analysis A. japonicus of directly from the water sample. This would promote sustainable and scientific fishery resource management plan of sea cucumber with little impact on the marine ecosystem.
Materials and Methods
In order to eliminate the contaminant foreign DNAs originated from the seawater, all the experiments were conducted using the artificial seawater (28.3 psu) in this study, which was prepared with a commercial salt (Red Sea, London, UK) and the deionized water. The prepared artificial seawater was sterilized by filtering through the membrane with 0.2 μm in pore size (47 mm, Pall Corporation, New York, NY, USA) prior to the further experiments. Absence of foreign DNA in the prepared artificial seawater was confirmed by the negative result in the PCR amplification without any template. Live sea cucumbers (Averaged wet body weight was 29.61 ± 3.08 g) were bought from a local fish market before the experiment. Species-specific primers for both nuclear β-actin (Yu et al., 2016) and mitochondrial cytochrome c oxidase I (COI) region (Shen et al., 2009) were selected for quantification of eDNA for A. japonicus from seawater (Table 1).
| Primer | Sequences (5’→3’) | Size (bp) | Reference |
|---|---|---|---|
| AjaCOIF AjaCOIR |
GTCACAAACTGGGATGATATGGAG TCCACTCAACCCTAAAGCCAA |
161 | Yu et al., 2016 |
| AjaβActinF AjaβActinR |
AGGTGCTCCAGACATGGCTTTCCCA AAGCAATATTGCCCACGCAGGAG |
119 | Shen et al., 2009 |
To compare the extracted eDNA yields by the different providers, 20-fold of sea water volume (mL) to its wet weight (g) were put into a beaker containing individual sea cucumber specimen. After 1 hour of incubation, the seawater in each beaker was divided into four fractions, each of which was filtered through GN-6 membrane with 0.45 μm in pore size (47 mm). Filtered membranes were further used for genomic DNA extraction with four different commercial kits; DNeasy® Blood & Tissue Kit (Qiagen, Hilden, Germany), DNeasy® Plant Mini Kit (Qiagen), mollusc DNA Extraction Kit (Omega Bio-Tek, Norcross, GA, USA), and DNeasy® PowerSoil Kit (Qiagen). Each genomic DNA was extracted according to the manufacturer’s method and all the experiments were triplicated. The lysis buffer (630 µL) was added to the membranes, followed by homogenization. After addition of RNaseA (6 µL), the homogenates were transferred to a FastPrep Tubes (MP Biomedicals, Irvine, CA, USA). The filter was cut into small pieces using sterilized scissors and homogenized through FastPrep®-24 Classic Instrument (MP Biomedicals) as described previously (Alam et al., 2020). The extracted DNA was quantified and qualified using NanoDrop one spectrophotometer (Thermo Fisher Scientific, Waltham, MA, USA) and stored at –70°C until used for further experiment.
Quantification of eDNA was accomplished by qPCR with both AjaβActin and AjaCOI primers (Table 1). Standard curve for each primer set was constructed by the serially diluted plasmid harboring each target sequence. The amplified product was stained with a Dyne Loading STAR (Dynebio, Seongnam, Korea) and confirmed by the electrophoresis through the agarose gel. The amplicons with the expected sizes were purified using the AccuPrep® PCR/Gel Purification Kit (Bioneer, Deajeon, Korea). Purified DNA fragments were ligated to the pGEM®‐T Easy vector (Promega, Madison, WI, USA) and transformed into Escherichia coli DH5α competent cells. The plasmid was extracted according to the manufacturer’s method using the AccuPrep® Plasmid Mini Extraction Kit (Bioneer). The standard curves used 10-fold serial dilutions of each plasmid (10-1 ng/μL to 10-9 ng/μL) and generated by plotting the quantification cycle (Cq) values against log10 of the DNA copy numbers for the quantitative PCR (qPCR) analysis. All the qPCR was conducted using Mic qPCR Cycler (Bio Molecular Systems, Upper Coomera, Australia). The mixture for qPCR (20 µL) contained 4 µL DNA template, 10 µM primer set, 10 µL 2X Luna Universal qPCR Master Mix (New England BioLabs, Ipswich, MA, USA), 0.6 µL dimethyl sulfoxide (DMSO), and nuclease-free water. PCR conditions for COI began with initial denaturation at 94°C for 5 min, followed by 40 cycles of 94°C for 15 s, 65°C for 10 s, and 72°C for 15 s, and final extension at 72°C for 5 min. The condition for β-actin PCR was same to those for COI region except for 60°C as melting temperature. The copy numbers were calculated by substituting Ct values into each standard curve (Larionov et al., 2005).
The LOD and LOQ values were measured to evaluate the sensitivity of the qPCR assays. A 95% detection probability and a 35% coefficient of variation (Cv) threshold was designated for the LOD and LOQ, respectively. For the LOD and LOQ analyses, the PCR mixture (20 µL) containing 4 µL DNA template, 5 µM primer set, 5 µM probe, 10 µL Luna Universal probe qPCR Master, 0.6 µL DMSO, were prepared. PCR conditions for COI began with initial denaturation at 94°C for 5 min, followed by 45 cycles of 94°C for 15 s, 61.7°C for 10 s, and 72°C for 15 s. The condition for β-actin PCR was same to those for COI region except for 60°C as melting temperature.
Statistical analyses were conducted using Descriptive statistics program XLSTAT (version 2020.1.3, Addinsoft, New York, NY, USA). Kruskal-Wallis with post-hoc Dunn’s test for multiple comparisons between all groups analyses was performed to confirm that the difference of copy number using Paleontological Statistics (PAST) software version 4.03.
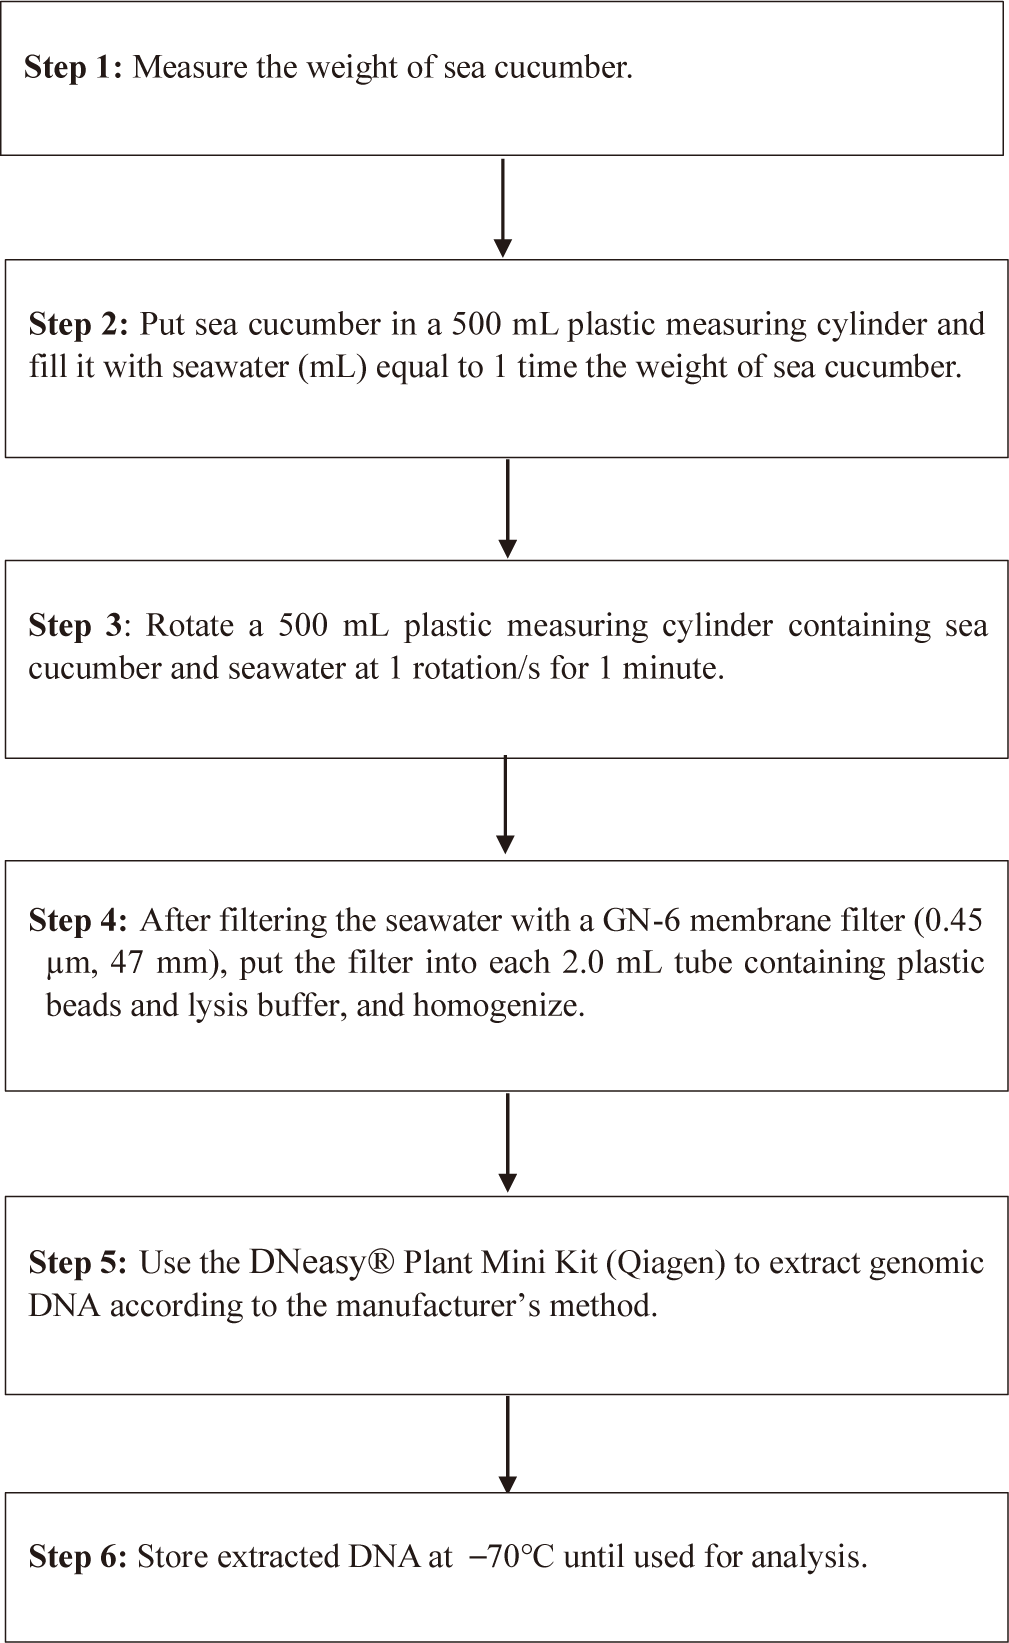
To determine the optimal seawater volume to recover eDNA, a sea cucumber was incubated for 1 min in different seawater volumes ranging from l- to 20-fold volume (mL) of the wet weight (g) of each individual. After eliminate the sea cucumber, remained sea water was filtered through GN-6 membrane filter with 0.45 μm in pore size (47 mm) and used for quantification of recovered eDNAs. eDNA was extracted using DNeasy® Plant Mini Kit. All the experiments were triplicated.
Optimal incubation time to harvest eDNA of A. japonicus from seawater was also analyzed. Each sea cucumber in a beaker containing the seawater with 5-fold volume (mL) of its wet weight (g) was incubated for three different incubation times (10 min, 30 min, 60 min). After taking out A. japonicus from the beaker, remained seawater sample was filtered with a GN-6 membrane. The concentration of the extracted genomic DNA using DNeasy® Plant Mini Kit and 1.0 µL of DNA was used for the qPCR analysis. All the experiments were triplicated. The concentration of the harvested eDNA of A. japonicus from seawater at different water temperature was measured. Each sea cucumber was put in a beaker containing the seawater with 5-fold volume (mL) to its wet weight (g) and incubated for 60 min with five different water temperatures (18°C, 21°C, 24°C, 27°C, 30°C). After taking out sea cucumber from the beaker and remained seawater was filtered through the membrane for both DNA concentration and qPCR analysis with three replicates.
Results
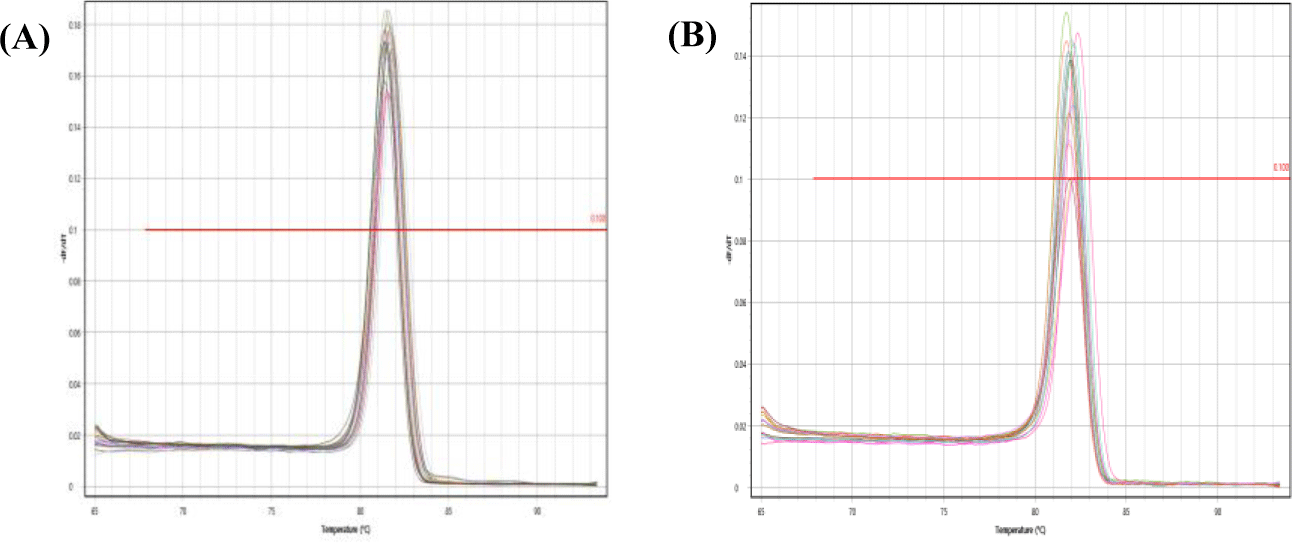
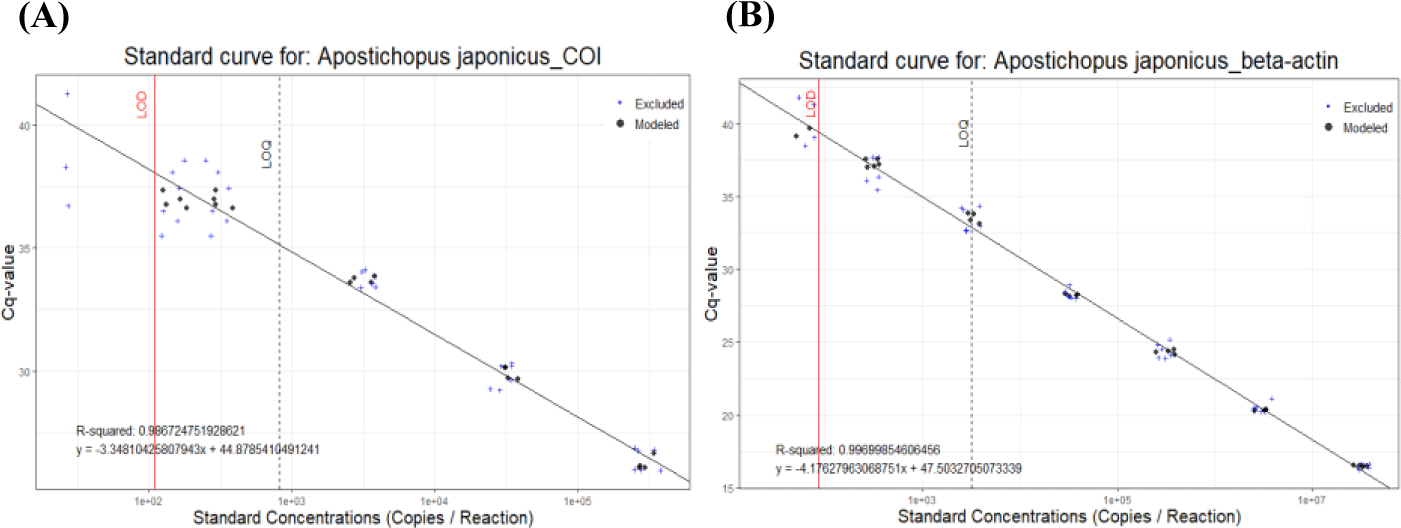
Feasibility of two previously designed species-specific primer sets, AjaCOI and AjaβActin, were examined. Both AjaCOI and AjaβActin produced a single PCR amplicon with 80 ± 2°C, 81 ± 1°C in melting temperature, respectively (Fig. 1). LOD and LOQ values of each primer were also measured. The LOD and LOQ of AjaCOI was 108.78 and 814 copies, while those of AjaβActin 86.16 and 3,174 copies, respectively (Fig. 2). The efficiency of AjaCOI and AjaβActin was 98.92% and 73.56%, respectively, indicating relatively lower efficiency of AjaCOI. However, both primers were suitable for the quantitative analysis of sea cucumber eDNA with high specificity and sensitivity.
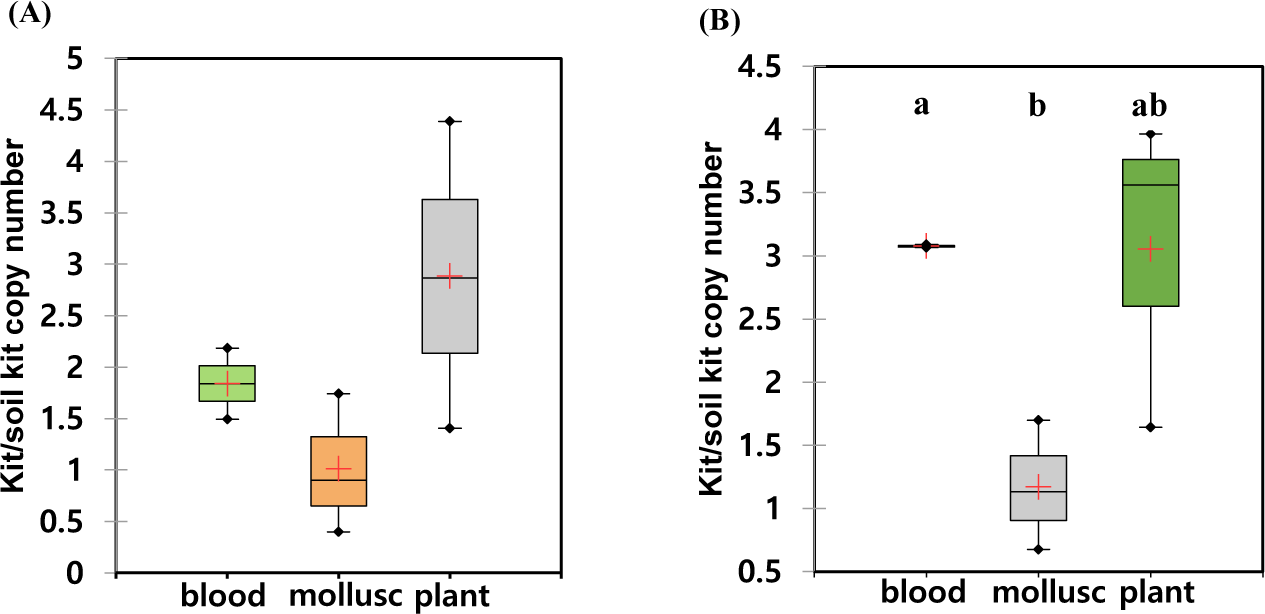
The recovered eDNA copies using different commercial kits were quantified by qPCR using two sea cucumber-specific primers. Since the eDNAs released from the individual sample were highly variable, we calculated the relative amount of DNAs in each individual experiment (Table 2). All the experiments, the lowest amounts of eDNA were isolated from DNeasy® PowerSoil Kit. Therefore, relative amounts of the isolated DNAs were calculated by those from DNeasy® PowerSoil Kit (Fig. 3). Among the compared four commercial kits, the highest amount of eDNA was recovered using DNeasy® Plant Mini Kit. The relative amount of recovered AjaCOI and AjaβActin copies by DNeasy® Plant Mini Kit were 12,677,454.00 ± 4,640,279.78 and 1,700,818.00 ± 352,004.62, respectively. DNeasy® Blood & Tissue Kit also showed similar yields rates in which 11,824,142.53 ± 4,784,888.92 and 1,465,559.53 ± 577,000.14 was identified (Table 2). The mollusc DNA Extraction Kit, a different product from the other three providers, fell behind from the other two kits showing similar yield rates to DNeasy® PowerSoil Kit. Regardless of the kits, averaged ratios of AjaCOI copy numbers to AjaβActin ranged from 8.77 ± 4.95 to 14.23 ± 11.98, similar in all examined extraction kits (Table 2). Collectively, both DNeasy® Plant Mini Kit and DNeasy® Blood & Tissue Kit outperformed the other two kits recovering approximately 3.04-fold higher DNAs (Fig. 3). However, DNeasy® Plant Mini Kit were chosen for further experiment in this study simply due to the slightly higher yields to DNeasy® Blood & Tissue Kit.
The optimal incubation time for eDNA recovery of A. japonicus were measured. During the observed incubation times from 10 to 60 min, the recovered eDNAs were not statistically different with high degree of variation in each experiment (Figs. 4A and 5A). However, the median yields increased over time, in which 62,756 copies/mL of AjaCOI and 33,991 copy number/mL of AjaβActin respectively increased in every 10 min (Table 2). The median value in the ratio of COI to β-actin tended to increase as incubation times increased, indicating increased eDNA by the longer incubation times was mainly due to the increased shedded mitochondrial DNAs rather than nulcear DNA (Fig. 6B). The mortality rate was zero in all the experiments.
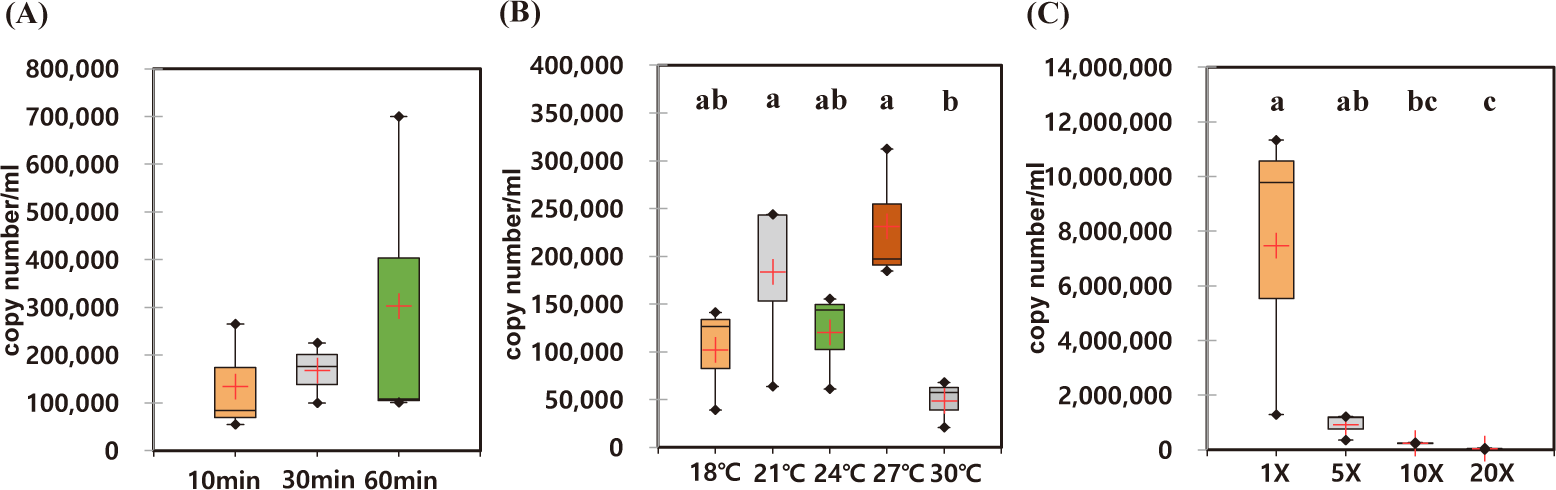
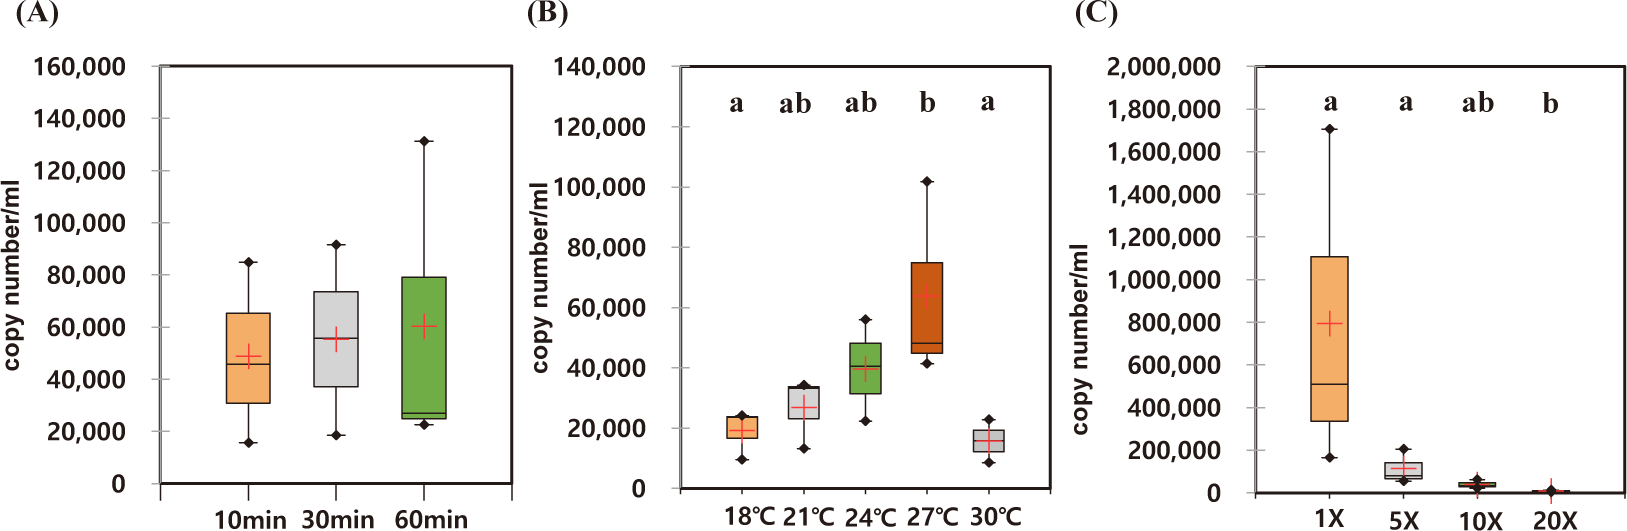
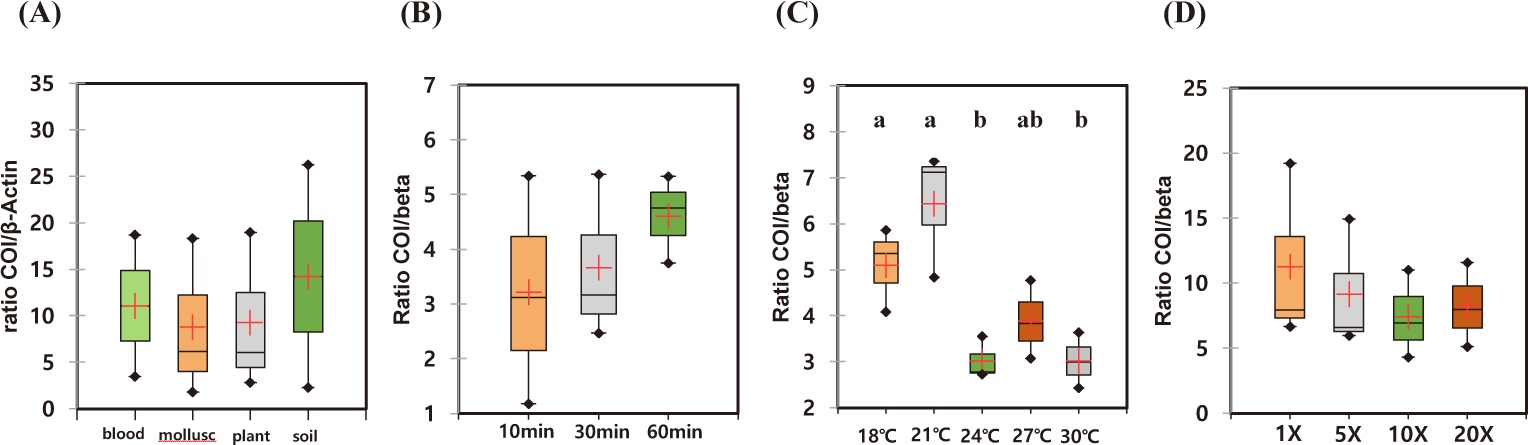
Among the compared different water temperature from 18°C to 30°C, the recovered copy numbers of both mitochondrial and nuclear DNAs tended to increase as the temperature increased (Figs. 4B and 5B). However, the recovered DNA copy numbers dramatically decreased at 30°C. The ratio of COI to β-actin significantly decreased from 24°C in water temperature indicating higher nuclear DNAs were shedded from the sea cucumber than mitochondrial DNAs (Table 2 and Fig. 6C). The mortality rate was zero in all the experiments.
As the amount of artificial seawater was reduced, more environmental DNA could be obtained (Figs. 4C and 5C). The copy numbers of both COI and β-actin incubated in the seawater equal volume (mL) to the weight of sea cucumber (g) were approximately 68-fold higher than those in 20 times higher volume (Table 2). There was no significant difference in the ratio of COI to β-actin by different water volumes indicating water volume did not affect the any preferential shedding of eDNAs.
Discussion
Based on the results of this study, sea cucumber genetic research can be conducted non-destructively through environmental DNA analysis method. Genetic analysis through traditional collection methods requires a relatively large amount of times and efforts during sample collection and observation. However, the newly established methods in this study using eDNA made it possible to investigate them rapidly obtaining the eDNA approximately in 1 min for each sample. The price for each membrane filters to secure environmental DNA is about less than $1 per piece, which is more economically efficient than securing sea cucumbers. Since the mortality rate in all the experiments was 0, suggesting its little impact on the environment of the survey area, which was similar to the previous studies (Yunwei et al., 2005). After eDNA collection, individuals can be released to the habitat indicating that this method is considered to be an essential method to protect the ecosystem of the surveyed area.
We successfully quantify the copy numbers of sea cucumber species using qPCR with both nuclear and mitochondrial species-specific primers (AjaβActin and AjaCOI). Among the two primers used in this study, AjaCOI primers outperformed AjaβActin. Both LOD (108.78 copies) and LOQ (814 copies) values of the AjaCOI primers lied within the acceptable range of LOD (2.19−26 copies/reaction) and LOQ (6−839 copies/reaction) values as suggested in the previous study (Klymus et al., 2020). However, AjaβActin primer showed a relatively high degree of LOQ value (3,174 copies), suggesting its low sensitivity for the analysis of nuclear DNA. This result indicated that AjaβActin primer may not be suitable for the measurement of AjaβActin gene. In fact, there are multiple copies of cytosolic actin genes in the sea cucumber (Ortiz-Pineda et al., 2009), it is difficulty to design a gene-specific primer set for actin gene of sea cucumber. However, low quality of the AjaβActin primer would not change our result for several reasons. The copy numbers of all the examined samples in this study ranged from 15,676 to 11,344,190 copies, which was far higher than LOQ. Therefore, the sensitivity of AjaβActin was not considered to be problematic in this study. Besides, the object of AjaβActin primer is to estimate the copy numbers of nuclear gene not actin gene and the estimated copy numbers of AjaβActin with the template far higher concentration of LOQ successfully reflected the copy numbers of nuclear genes. In this study, we simply estimated the copy numbers of both nuclear and mitochondrial eDNAs by qPCR but the gene-specific primers for each individual purpose should be evaluated using LOQ and LOD values. Although there have many previous studies (Hoshino & Inagaki, 2012; Jo et al., 2020; Kwong et al., 2021) to quantify environmental DNAs, the evaluation of each primer set would be essential for the low copy numbers of eDNAs in the water sample. Therefore, it is highly recommended to examine the reliability of primer set with proper LOD/LOQ values prior to the quantitative analysis (Thalinger et al., 2021).
We identified that is DNeasy® Plant Mini Kit and DNeasy® Blood & Tissue Kit were most efficient in recovering eDNA from the seawater containing A. japonicus, among the compared commercial DNA extraction kits obtaining approximately 3-fold higher than the other two kits. As shown in this study, majority of previous studies showed that Qiagen kits outperformed in yields and quality from various samples among the compared commercial kits from different suppliers (Claassen et al., 2013; Dauphin et al., 2009; El Bali et al., 2014; Tomaso et al., 2010). Therefore, we excluded most of the other commercial kits in this study and it was not surprised to see Qiagen kits outperformed in the yields of the recovered eDNA. We here specifically compared mollusc DNA Extraction Kit presumably due to the high amount of mucus secretion from A. japonicus, but yields were lower than DNeasy® Plant Mini Kit. Surprisingly, DNeasy® PowerSoil Kit, which is specifically formulated for the soil samples containing high amounts of inhibitory components such as humic acids, underperformed in eDNA extraction from seawater samples. Choice of DNA extraction kit was one of essential factors in eDNA genetic analysis considering the trace amount of eDNA from the water sample. Although we used DNeasy® Plant Mini kit for eDNA analysis of A. japonicus, evaluation of several candidate kits should be made according to the target organism with the different physiochemical characteristics to maximize the yields and quality of eDNA.
In this study, the averaged recovered copy numbers of the nuclear DNA, AjaβActin were approximately 7-fold less than those of the mitochondrial COI marker (AjaCOI). In contrast to the nuclear DNA, which contains only two copies per diploid cell, the numbers of mitochondria vary in different cell types from 100 to 10,000 (Wai et al., 2010). Besides, mtDNA exists in multiple copies in each cell and degrade at a slower rate than nuclear DNA (Allentoft et al., 2012; Bogenhagen & Clayton, 1974). Each cell contains around 1,000 mitochondria, and there are 2–10 copies of the mtDNA per mitochondrion (Merheb et al., 2019; Robin & Wong, 1988). However, it is known that mitochondrial numbers varies in tissues, developmental stages, or physiological conditions (Das, 2006; D’Erchia et al., 2015). As a diploid individual, sea cucumber carries only two copies of nuclear DNA per cell, which showed relatively low copy numbers than mtDNA. Therefore, higher amount of water samples may be needed for the analysis of nuclear DNA using eDNA, compared with those for mtDNA. However, in this study, averaged copy numbers for AjaβActin was high enough for the analysis (109,394 copies/mL), which were sufficient for the analysis.
We here compared the recovered eDNA yields with different parameters, including incubation times, temperature, and seawater volume. The recovered eDNA yields tended to increase over the time but there was a high degree of individual variations (Figs. 4A and 5A). Based on the ratio between mitochondrial and nuclear DNAs, increased incubation times preferentially increased the mitochondrial DNA rather than nuclear one for unknown reason (Fig. 6B). However, the recovered yields of both mitochondrial DNAs (5,543,172.26 ± 4,242,047.81 copies) and nuclear one (336,312.71 ± 172,710.84 copies) would be sufficient for genetic analysis even in 1 min of incubation times when equal volume of seawater was used for the individual wet weight. Therefore, 1 min of incubation times would be sufficient for the genetic analysis of A. japonicus in the field and longer incubation times would be inefficient in analytic times and labors and may be stressful to examined specimen.
We also identified that higher water temperature increased the recovered eDNA yields (Figs. 4B and 5B). Previous experiment using fish species also showed similar result in which increased water temperature induced the higher eDNA shedding rate (Jo et al., 2019). The higher eDNA shedding rates by increased water temperature might be due to higher metabolism and physiological activity of organisms (Jo et al., 2019; Morita et al., 2010). However, we also identified that the copy numbers of both nuclear and mtDNAs at 30°C decreased dramatically. Although it is known that increased water temperature may their sharp decrease at 30°C may represent the physiological conditions of A. japonicus at the critical temperature such as apoptosis (Yunwei et al., 2005). Sharp decrease in the ratio of mitochondrial to nuclear DNA may support the hypothesis in which thermal stress would have induced the mitochondrial damage occurred by apoptosis (Dong & Dong, 2006; Liu, 1996; Yang et al., 2005). It is well known that those thermal stress influences the expression of proteins involved in various biological processes, such as cell apoptosis, and cell proliferation (Xu et al., 2016). Therefore, it would not be recommended to change the water temperature to obtain environmental DNA, which may cause the significant changes in the ratio of mitochondrial and nuclear DNA yields. We also optimized the amount of water volume. We identified that water volume equivalent to the wet body weight was enough for eDNA analysis in which highest amount of eDNA was recovered. The amount of seawater volume in which individual sea cucumber was put would be important. For instance, if the water volume was too high, DNA is diluted and the proper amount of eDNA cannot be obtained. If the amount of water is too small, all sea cucumbers would be partially submerged and enough DNA will not be obtained. We were able to obtain the highest amount of eDNA from the seawater equal to wet weight of individual specimen.
Considering all the examined pretreatment condition, we here established a standard pretreatment protocol for eDNA analysis of the sea cucumber (Fig. 7). However, we here only tested the recovered DNA yields from the seawater sample and chances of deleterious to the quality of eDNA always exist during collection, delivery or storage of seawater or eDNA samples (Takahara et al., 2015; Yamanaka et al., 2016). Although we here used the artificial seawater, this may not be applicable depending on the field condition. Use of seawater directly from the sample site implicates a variety of external factors such as temperature, inhibitors, or contaminant foreign gene, etc. Particularly, inflow of territorial waters brings various inhibitory components to the sea water during the rainy season in Korea, which would be one of main concerns of the water collection from the sample sites (Zipper et al., 2003). Special care also should be made during the delivery or storage of seawater or eDNA samples. Previous experiments showed that water should be filtered within 24 hours of sample collection (Hinlo et al., 2017) and we also had similar result (data not shown). Therefore, on-site filtration of water samples is highly recommended at each sample collection sites. Filtered membranes can be stored in the falcon tubes (15 mL) containing the lysis buffer preventing eDNA from further degradations. Storage temperature and times also affects the quality and quantity of the recovered eDNA and several chemicals such as benzalkonium chloride have shown to be effective to suppress degradation associated with storage and delivery issues. Collectively, we here established a standard protocol to obtain eDNA of the sea cucumber from water samples, which would be helpful for the scientific and efficient management of A. japonicus resource with little impact on marine ecosystem in Korea.