Introduction
Vibrio parahaemolyticus is a gram-negative, curved, rod-shaped, halophilic bacterium that can be found in marine, coastal, and estuarine environments (Broberg et al., 2011; Nelapati et al., 2012; Tran et al., 2013). It has two types of flagella that it uses to swim, swarm, and produce a capsule (Letchumanan et al., 2014; McCarter, 1999). The principal virulence factors of V. parahaemolyticus include adhesin, thermostable direct hemolysin (TDH; tdh), and TDH-related hemolysin (trh), which are involved in its pathogenesis (Letchumanan et al., 2014; Wang et al., 2015). V. parahaemolyticus foodborne illness is prevalent globally and evokes symptoms of gastroenteritis in humans (Broberg et al., 2011; Daniels et al., 2000).
V. parahaemolyticus-associated foodborne illnesses are mainly caused by the contamination of raw seafood. For example, sardines contaminated with this pathogen were first identified as the cause of seafood borne illnesses in Japan (Levin, 2006). According to the Korean official statistics by the Ministry of Food and Drug Safety (2020), 52 foodborne outbreaks in 873 patients reported between 2015 and 2019 in South Korea were caused by V. parahaemolyticus, followed by other pathogens such as Escherichia coli (221 outbreaks), Salmonella (88 outbreaks), and Campylobacter jejuni (64 outbreaks). In South Korea, V. parahaemolyticus was detected in raw Korean oysters at retail outlets (Lee et al., 2008); Jun et al. (2012) isolated V. parahaemolyticus from corb shells, short neck clams, sea mussels, sorb shells, Pacific oysters, and charm abalone purchased in 2009 at fish markets in Seoul, South Korea. In addition, V. parahaemolyticus-associated foodborne illnesses caused by cross-contamination from squids were reported in 2018 in South Korea (Jung, 2018).
Jeotgal is a Korean, salt-fermented, seasoned seafood that is commonly consumed as a nutritious side dish in South Korea (Koo et al., 2016; Lee, 2013). Jeotgal is a raw seafood delicacy prepared using squid, oyster, clam, and octopus (Koo et al., 2016), and therefore, there is a potential food vector for V. parahaemolyticus transmission. Microbial quantitative risk assessment of food is a procedure commonly used for identifying health risks, establishing regulations, determining the research needed, and deciding whether the current standards are adequate; the ultimate goal of these assessments is to provide public health services through food safety management (Lammerding, 1997; USDA, FSIS & EPA, 2012). Studies on the risk assessment of Jeotgal related to ethyl carbamate (Lee, 2013) have been performed; however, risk assessment for V. parahaemolyticus contamination in Jeotgal has not been conducted yet. The purpose of this study was to analyze the risk of foodborne illnesses caused by the consumption of Jeotgal contaminated with V. parahaemolyticus.
Materials and Methods
Among the various types, squid, clam, and oyster Jeotgal were the focus of this study. Ninety Jeotgal samples (30 squid , 30 clam, and 30 oyster) were purchased from markets in Seoul and Mokpo, as well as from online markets in South Korea. The Jeotgal samples (25 g) were placed in filter bags (3M, St. Paul, MN, USA) along with sterile 0.85% saline (225 mL) and homogenized at 230 rpm for 2 min using a stomacher (Seward, Worthing, UK). Aliquots of the homogenates (1 mL) and diluents (100 µL) were spread onto thiosulfate-citrate-bile salts-sucrose agar (TCBS; BD, Franklin Lakes, NJ, USA) and incubated at 35°C for 24 h. Colonies on the plates that were predicted to be V. parahaemolyticus were analyzed using a compact VITEK2 GN card (BioMérieux, Craponne, France) and PCR targeting the thermolabile hemolysin (tlh) gene. The PCR conditions were as follows: initial denaturation at 94°C for 3 min; 30 cycles of denaturation at 94°C for 1 min, elongation at 58°C for 1 min, extension at 72°C for 1 min, and final extension at 72°C for 5 min (Bej et al., 1999).
Based on the number of V. parahaemolyticus-positive Jeotgal samples, the prevalence was estimated using the beta distribution [RiskBeta (α: number of positive samples + 1, β: total number of samples – number of positive samples + 1)], and the initial contamination level (IC) was estimated as described by Vose (1997).
Although there are several types of Jeotgal, only one can be used to establish a predictive model for microbial risk assessment. Thus, a predictive model should be developed using model food. The prediction from the model food should be higher than that from the other types of Jeotgal. Therefore, five types of Jeotgal, prepared using squid, octopus, oyster, pollack roe, and clam, were purchased from supermarkets in Seoul, South Korea. Colonies of V. parahaemolyticus ATCC 17802, ATCC 27519, ATCC 33844, and ATCC 43996 strains were inoculated in 10 mL of marine broth (BD) and incubated at 35°C for 24 h. Aliquots (100 μL) were also inoculated in 10 mL of fresh marine broth and incubated at 35°C for 24 h. The supernatant was removed following centrifugation at 1,912×g at 4°C for 15 min using centrifuge (Combi R515; Hanil Science, Gimpo, Korea). The washed cell suspensions were then mixed and diluted with phosphate buffered saline (8.0 g of NaCl, 1.5 g of Na2HPO4∙7H2O, 0.2 g of KH2PO4, and 0.2 g of KCl in 1 L of distilled water; pH 7.4) to obtain 6.0 Log CFU/mL. Jeotgal samples were inoculated with the prepared solution, to obtain a concentration of 4.0 Log CFU/g. Inoculated samples were stored at 20°C for 96 h, during which alkaline peptone water (20 mL) (APW; BD) was placed in a conical tube (BD) containing 10 g of Jeotgal, that had been homogenized by vortexing for 1 min. The homogenates were decimally diluted in APW, followed by spread-plating on TCBS agar and incubation at 35°C for 24 h. V. parahaemolyticus cell counts obtained in the five types of Jeotgal were compared. The type of Jeotgal that had the highest survival rate of V. parahaemolyticus was selected as the model food for developing predictive models.
Among the Jeotgal, squid Jeotgal retained the most live bacteria, and thus, squid Jeotgal was selected for predictive models. Ten-gram portions of squid Jeotgal, purchased from a supermarket in Seoul, South Korea, were inoculated with V. parahaemolyticus to obtain a 4.0 Log CFU/g concentration. The inoculated samples were stored at 7°C, 15°C, 25°C, and 35°C, considering the exposable temperature of Jeotgal during distribution and storage. During storage, 10 g of each Jeotgal sample was diluted with 20 mL of APW, and the samples were then homogenized by vortexing for 1 min. Homogenates (0.1 mL) diluted in APW were inoculated onto TCBS agar by spreading. The plates were incubated at 35°C for 24 h, after which V. parahaemolyticus cell counts were confirmed. To describe the kinetic behavior of V. parahaemolyticus in Jeotgal, a primary model was developed by fitting the Weibull model [Log (N) = Log (N0) – (time/δ)ρ; N, cell counts; N0, initial cell counts; δ, treatment time for the first decimal reduction; ρ, curve shape parameter] (Mafart et al., 2002) to the V. parahaemolyticus cell counts. A secondary model was developed by fitting a polynomial model [Y = 1 / (a + b × T + c × T2); a, b, and c, constant; T, storage temperature] with δ values as a function of the storage temperature. This model was used to describe the effect of temperature on the kinetic parameters. To validate the model performance, squid Jeotgal was inoculated with V. parahaemolyticus, and the samples were exposed to the temperatures 10°C and 23°C. V. parahaemolyticus cell counts (observed values) were compared to the values predicted by the developed models. The root-mean-square error (RMSE; Baranyi et al., 1996) was calculated as follows:
Distribution time and temperature data for the Jeotgal, including transportation, storage, and display at market, were collected via personal communication with an administrator who is in charge of Jeotgal sales at a major market in Korea. Storage time at home was collected via personal communication, and the distribution model for food temperature at home storage was constructed as described by Lee et al. (2015).
Among the various types, squid Jeotgal is the most commonly consumed Jeotgal in South Korea; hence, the risk in the simulation may be overestimated if the data of consumption for all types of Jeotgal is applied in this scenario. Thus, only the consumption data for squid Jeotgal were collected and analyzed. Data on the daily consumption frequency and amount of squid Jeotgal in South Korea were collected from the 2016 Korea National Health and Nutrition Examination Survey (KNHNES; KCDC, 2018). The appropriate probability distribution from this data was analyzed using the @RISK program (version 7.6, Palisade, Ithaca, NY, USA).
The probability of illness/person/day was calculated using a beta-Poisson dose-response model associated with V. parahaemolyticus, which was evaluated as a well-described model and generally used by FAO & WHO (2011) and Iwahori et al. (2010). The full simulation model included data on V. parahaemolyticus prevalence and initial concentration, the predictive models applied to distribution condition, consumption amount and frequency, and the dose-response model. The risk was estimated using a comprehensive simulation in the @RISK program.
Kinetic parameters (δ and ρ values) from the predictive models which were developed by three repetitions of experiments were established using the general linear model in SAS® (version 9.3, SAS Institute, Cary, NC, USA). The kinetic parameters at different storage temperatures were compared using pairwise t-test with least squared means at α = 0.05.
Results and Discussion
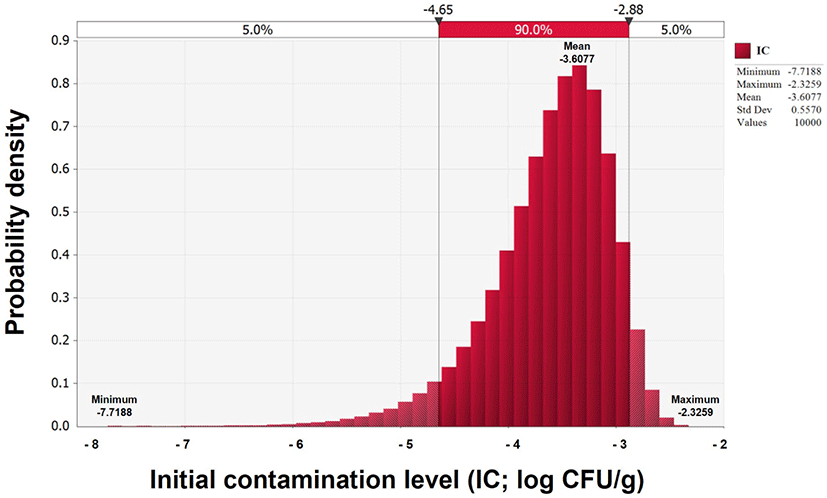
V. parahaemolyticus contamination was not detected in any of the 90 Jeotgal samples; thus, the IC was estimated using a beta distribution [BetaRisk(1,91)] model. The average IC estimated was –3.6 Log CFU/g (Fig. 1).

In the preliminary experiments, V. parahaemolyticus in squid Jeotgal survived for the longest time compared to that in other Jeotgal (data not shown). The pH (6.0) of squid Jeotgal was relatively high compared to that of other types (octopus: 5.73, oyster: 5.45, pollock roe: 5.63, and clam: 5.61). The water activity (Aw) of squid Jeotgal was 0.980, which is similar to the values of other types of Jeotgal (octopus: 0.983, oyster: 0.989, pollock roe: 0.988, and clam: 0.981). The salinity of squid Jeotgal was 4.73%, which was different from those of the other types (octopus: 34.3%, oyster: 3.02%, pollock roe: 4.50%, clam: 7.80%). Considering the overall characteristics, including optimal NaCl concentration (2%–4%), pH (pH 7.6–8.6), and Aw (0.936–0.995), V. parahaemolyticus could survive the longest time in squid Jeotgal (Jay et al., 2005; Miles et al., 1997; Parveen et al., 2013).
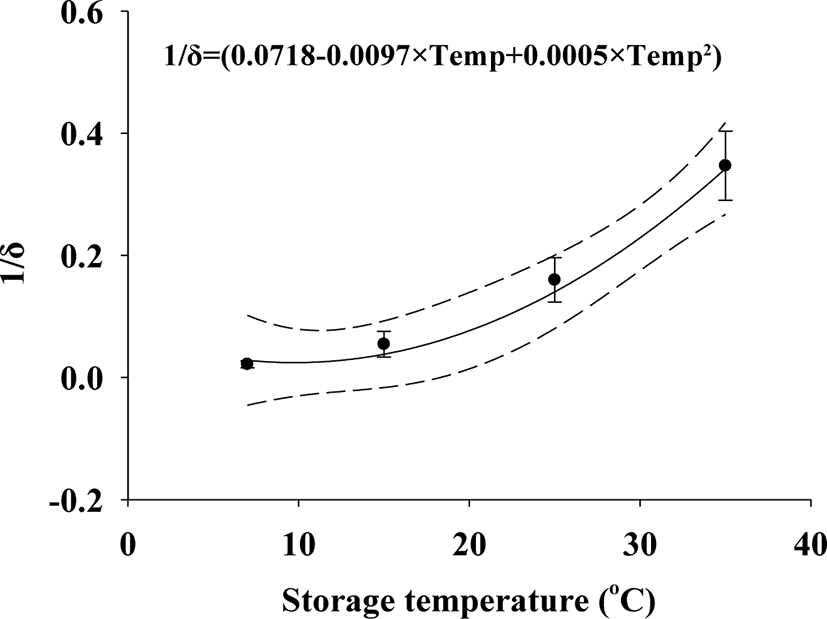
Squid Jeotgal was ultimately selected to develop a predictive model (Table 1). V. parahaemolyticus δ values decreased with increasing temperature: 7°C (δ = 56.77), 15°C (δ = 25.11), 25°C (δ = 7.23), and 35°C (δ = 3.02) as the storage time progressed. The ρ values in the Weibull (primary) model were 0.72 (7°C), 0.56 (15°C), 0.53 (25°C), and 0.66 (35°C). The goodness of fit for the primary model was evaluated with an R2 value of 0.899−0.936 (Table 1), which were close to the R2 values calculated by Ha et al. (2019) that was the range of 0.869–0.967 in the Weibull models. Considering the correlation between the δ values and temperature, the polynomial (secondary) model for δ values was developed as δ = 1 / (0.0718 – 0.0097 × T + 0.0005 × T2), resulting in an R2 value of 0.860 (Fig. 2). The R2 of the δ values derived from the polynomial (secondary) model developed by Lee et al. (2019) was 0.890, which is similar to the resulting values of this study; however, the ρ values showed no correlation with temperature, eliminating the need for a secondary model. The average ρ value (0.6158) from the primary model was used in the simulation. The predictive model was validated for performance at different temperatures (RMSE: 0.746 for 10°C and 0.470 for 23°C) and in different types of Jeotgal (RMSE: 0.394). Ha et al. (2019) reported that an RMSE of 0.618 indicated appropriate model performance. The RMSE in this study indicates that the model appropriately describes the kinetic behavior of V. parahaemolyticus in Jeotgal.

The Jeotgal products were transported from manufacturers to markets within 4, 5, or 7 h from manufacturing, which were collected through personal communication with the person in charge of the products at the market, and thus facilitating the analysis of time using the Pert distribution [RiskPert(4,5,7)]. The data on food temperature during transport, which were collected through personal communication with the person in charge of the products at the market, were fitted with a Weibull distribution [RiskWeibull(1.3219,2.8404, RiskShift(3.1093), RiskTruncate(1,40))]. The Jeotgal products were stored at 0°C−10°C for 0.17−0.5 h, and the uniform distribution was fitted using the parameters RiskUniform(0,10) and RiskUniform(0.17,0.5), respectively. At the markets, the Jeotgal products were displayed at 2.2281°C−20.272°C for 0−4,320 h (mean: 720 h); thus, RiskUniform(2.2281,20.272) and RiskPert(0,720,4320) were applicable, respectively to the model. After purchase, the Jeotgal products were stored in refrigerators at home for 0–720 h (shelf life) until consumption. Thus, the data for the storage time at home were fitted to a uniform distribution with the parameter RiskUniform(0,720), and food temperature during home storage was described using the LogLogistic distribution [–29.283,33.227,26.666, RiskTruncate(–5,20)] (Lee et al., 2015; Table 2).
| Input model | Variable | Formula | Reference |
|---|---|---|---|
| Product | |||
| Pathogen contamination level | |||
| V. parahaemolyticus prevalence | PR | = RiskBeta(1,91) | This study; Vose, 1997 |
| Concentration (CFU/g) | C | = –LN (1 – PR) / 25 g | Sanaa et al., 2004 |
| Initial contamination level (Log CFU/g) | IC | = Log(C) | |
| Market | |||
| Market transportation | |||
| Transportation time (h) | Mark-timetrans | = RiskPert(4,5,7) | Personal communication1) |
| Food temperature during transportation (°C) | Mark-Temptrans | = RiskWeibull(1.3219,2.8404,RiskShift(3.1093),RiskTruncate(1,40)) | Personal communication |
| Death | |||
| Treatment time for the first decimal reduction | δ | = 1 / (0.0718 – 0.0097 × Mark-Temptrans + 0.0005 × Mark-Temptrans2) | This study |
| Curve shape parameter | ρ | Fixed 0.6158 | This study |
| V. parahaemolyticus survival model | C1 | = IC – (Mark-timetrans / δ)ρ | Mafart et al., 2002 |
| Market storage | |||
| Storage time (h) | Mark-timest | = RiskUniform(0.17,0.5) | Personal communication |
| Food temperature during storage (°C) | Mark-Tempst | = RiskUniform(0,10) | Personal communication |
| Death | |||
| Treatment time for the first decimal reduction | δ | = 1 / (0.0718 – 0.0097 × Mark-Tempst + 0.0005 × Mark-Tempst2) | This study |
| Curve shape parameter | ρ | Fixed 0.6158 | This study |
| V. parahaemolyticus survival model | C2 | = C1 – (Mark-timest / δ)ρ | Mafart et al., 2002 |
| Market display | |||
| Display time (h) | Mark-timedis | = RiskPert(0,720,4320) | Personal communication |
| Display temperature in market (°C) | Mark-Tempdis | = RiskUniform(2.2281,20.272) | Personal communication |
| Death | |||
| Treatment time for the first decimal reduction | δ | = 1 / (0.0718 – 0.0097 × Mark-Tempdis + 0.0005 × Mark-Tempdis2) | This study |
| Curve shape parameter | ρ | Fixed 0.6158 | This study |
| V. parahaemolyticus survival model | C3 | = C2 – (Mark-timedis / δ)ρ | Mafart et al., 2002 |
| Home | |||
| Home storage | |||
| Storage time (h) | Home-timest | = RiskUniform(0,720) | Personal communication |
| Food temperature during storage (°C) | Home-Tempst | = RiskLogLogistic(–29.283,33.227,26.666,RiskTruncate(–5,20)) | Lee et al., 2015 |
| Death | |||
| Treatment time for the first decimal reduction | δ | = 1 / (0.0718 – 0.0097 × Home-Tempst + 0.0005 × Home-Tempst2) | This study |
| Curve shape parameter | ρ | Fixed 0.6158 | This study |
| V. parahaemolyticus survival model | C4 | = C3 – (Home-timest / δ)ρ | Mafart et al., 2002 |
| Consumption | |||
| Daily consumption average amount (g) | Consump | = RiskPareto(0.60284,1.32,RiskTruncate(0,155)) | KCDC, 2018 |
| Daily consumption frequency (%) | ConFre | Fixed 0.8 | KCDC, 2018 |
| Daily non-consumption frequency (rate) | CF(0) | = 1 – 0.8 / 100 | KCDC, 2018 |
| Daily consumption frequency (rate) | CF(1) | = 0.8 / 100 | KCDC, 2018 |
| Distribution for consumption frequency | CF | = RiskDiscrete ({0,1},{CF(0),CF(1)}) | KCDC, 2018 |
| Daily consumption average amount considered frequency | Amount | = IF(CF = 0,0,Consump) | KCDC, 2018 |
| Dose-response | |||
| V. parahaemolyticus amount (CFU) | D | = 10C4 × Amount | |
| Parameter | α | Fixed 0.17 | FAO & WHO, 2011; Iwahori et al., 2010 |
| Parameter | β | 1.18 × 10⁵ | FAO & WHO, 2011; Iwahori et al., 2010 |
| Risk | |||
| Probability of illness/person/day | Risk | =1 – (1 + D / β)-α | FAO & WHO, 2011; Iwahori et al., 2010 |
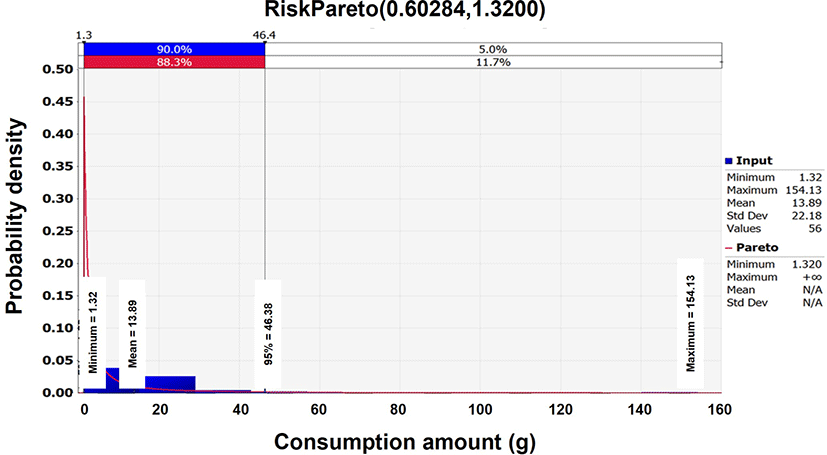
According to the 2016 KNHNES (KCDC, 2018) dataset, the daily consumption frequency of squid Jeotgal was 80.0%, with an average mass consumption of 13.9 g in South Korea. For the consumption related data, the Pareto distribution [(0.60284,1.32, RiskTruncate(0,155)] was determined to be the optimal probabilistic distribution analyzed by the @RISK program (Table 2 and Fig. 3).

The Beta-Poisson dose-response model [1 – (1 + D / β)−α, α = 0.17, β = 1.18 × 10⁵] was selected for V. parahaemolyticus (FAO & WHO, 2011; Iwahori et al., 2010), where D is the viable V. parahaemolyticus cell count consumed and calculated from consumption amount (g) of Jeotgal × V. parahaemolyticus cell counts (CFU/g). Consumption amounts were calculated from the initial concentration to home storage derived from the predictive models, responding to the distribution and storage conditions (time and temperature) (Table 2).
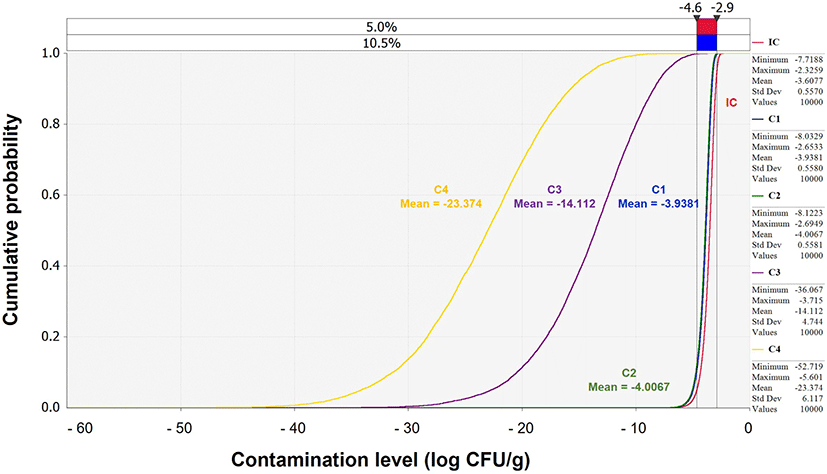
The simulation for V. parahaemolyticus-associated illness following the consumption of contaminated Jeotgal was performed for a scenario consisting of different stages categorized as product, market, home, consumption, dose-response, and risk (Table 2). Specifically, transportation, storage, and display were associated with the market stage, and daily consumption frequency and average daily consumption amount were associated with the consumption stage. The IC calculated from the product stage was applied to the predictive models at the market and home stages, as a response to the environment (time and temperature). In the consumption and dose-response stages, the final contamination level was applied. The probability of illness per person per day was calculated and applied to the scenario described above. The mean probability of illness per person per day was zero. This low risk was derived from the continuously decreasing cumulative contamination levels of V. parahaemolyticus: –3.61 (IC), –3.94 (market transportation), –4.01 (market storage), –14.11 (market display), and –23.37 Log CFU/g (home storage) (Fig. 4).

Conclusion
Jeotgal containing raw seafoods could be a vector of V. parahaemolyticus-associated foodborne illness. In this study, V. parahaemolyticus was not detected in all Jeotgal and the contamination level was decreased as the distribution carried on in the simulation. The risk of V. parahaemolyticus infection in Jeotgal was very low, as analyzed by quantitative risk assessment, with respect to the distribution in South Korea. The result suggested that the low contamination level and distribution environment could be important factors to decrease the probability of V. parahaemolyticus-associated foodborne illnesses.


