Introduction
Chum salmon, Oncorhynchus keta belongs to the family Salmonidae and is one of eight species of Pacific salmonids in the genus Oncorhynchus. O. keta has the widest natural geographic and scattering distribution among Pacific salmonids, primarily because its range extends farther along the shores of the Arctic Ocean than other salmonids (Groot & Margolis, 1991). It has been documented to live from Korea and the Japanese island of Honshu, around the rim of the North Pacific Ocean, to Monterey bay in southern California. This species may historically have been the most abundant of all salmonids, Neave (1964) estimated that before the 1940s, O. keta contributed almost 50% of the total biomass of all salmonids in the Pacific Ocean.
Korea is one of the coastal countries where O. keta returns and is located in the southernmost part of the many countries where it returns. Since the 1970s in Korea, O. keta release projects have been actively conducted for the purpose of creating coastal fisheries resources on the east coast, and many studies have been reported on stocks classification (Jung et al., 2003; Kang et al., 2003; Kim et al., 2007), geographical distribution (Hong et al., 2020), and migration characteristics of O. keta (Kim et al., 2020).
The timing of seasonal changes in river flow and water temperatures is probably the most important factor in constructing the history of freshwater life of anadromous salmonids. However, the degree of change in temperature and precipitation within the distribution range of O. keta is not clear, and the environmental boundaries are still unclear (Johnson et al., 1997). The rearing water temperature for O. keta is stated to be preferred at 11.2°C to 14.6°C, and it has been reported that the appropriate water temperature is 13.5°C, and the upper lethal is 25.8°C (Beschta et al., 1987). In addition, O. keta is most consistently observed to spawn in the range of 7°C to 12.8°C (Beacham & Murray, 1986; Bjornn & Reiser, 1991; Hicks, 2002). In Elliott (1981), the lower critical range of O. keta was found to be 0°C to 7°C, and the upper critical range was found to be 22°C to 28°C, so it was confirmed that high-temperature resistance of O. keta was low among salmonid fish species. Brett (1952) reported that the lethal upper water temperature of O. keta fry is 23.7°C, and it was shown that a significant lethality was shown when continuously exposed at 22°C (Hicks, 2002). A study by Hicks (2002) recommended that the daily maximum temperature should not exceed 21°C to prevent mortality of O. keta.
Recently, fish mortality due to water temperature has been increasing, and abnormal weather conditions and heat stress are the main causal mechanisms for fish mortality (Fey et al., 2015). It is known that a combination of high-water temperatures, accelerated maturation and aging, increased stress, impaired ion regulation function, and disease are responsible for salmonid migration deaths (Hinch et al., 2012). Studies that have been observed so far have reported that water temperatures may threaten the life cycle of salmonid, given regional warming (Bowerman et al., 2016; Eliason et al., 2011; von Biela et al., 2021; Westley, 2020).
When the water temperature rises, the physiological activity of salmonids under water temperature stress is similar to that of other fish species. Cortisol is the most common glucocorticoid hormone in salmonid fish and has been frequently used as a measure of stress (Donaldson, 1981; Sadoul & Geffroy, 2019). The increase in blood cortisol concentration due to stress is initiated by the release of the hormone corticoid-releasing factor (CRF) from the hypothalamus. CRF stimulates the pituitary gland to release another hormone, adrenocorticotropin (ACTH). ACTH increases the level of the corticosteroid hormone in the plasma, which is released by the interrenal tissue of the kidneys (Fevolden et al., 1993; Sumpter et al., 1986). A rapid increase in cortisol levels due to short-term stress is easy to recover, but a long-term increase in cortisol levels may be immunosuppressive and have harmful effects (Fast et al., 2008; Pickering & Pottinger, 1985). In addition to an increase in blood cortisol levels in response to stress, glucose levels in fish also increase (Pottinger & Carrick, 1999). In the short term, high glucose levels are mainly mediated as a result of the rapid increase in blood catecholamines that occurs during the stress response (Mazeaud et al., 1977; Vijayan & Moon, 1994), and in the long term, it may be due to cortisol-dependent gluconeogenesis (Vijayan et al., 1997). Therefore, a comparison of blood cortisol and glucose levels as markers for stress response in fish involving salmonid has been used in many studies (Gallant et al., 2017; Jhingan et al., 2003; Martínez-Porchas et al., 2009; Tromp et al., 2018).
In this study, an experiment in which different water temperature stimulation was applied to O. keta according to water temperature and experiments inducing high temperature stress for each period was performed. Then, through hematological analysis, we tried to investigate the changes in plasma cortisol and glucose levels that differ according to water temperature conditions. Through analysis, the water temperature conditions in which stress is induced in O. keta were confirmed, and the water temperature fluctuation conditions suitable for breeding O. keta were established.
Materials and Methods
All procedures were performed in accordance with guidelines for the ethical treatment of animals and were approved by the Institutional Animal Care and Use Committee of Mokpo National University (no. 1183; December 17, 2013).
All experiments were performed using artificially seeded salmon juvenile in Gyeongsangbuk-do Fisheries Resources Institute. The experimental fish were first acclimated to a water temperature of 16°C for 7 days and were fed twice a day at 9 am and 4 pm. Dissolved oxygen (DO) was maintained a level of 8 mg/L with liquid oxygen, and the water temperature was maintained with thermostat and controller. The size of the fish tank was ∅1.6 m × 0.6 m, the flow rate per minute was 11 L, and the flow rate per day was 13 turns.
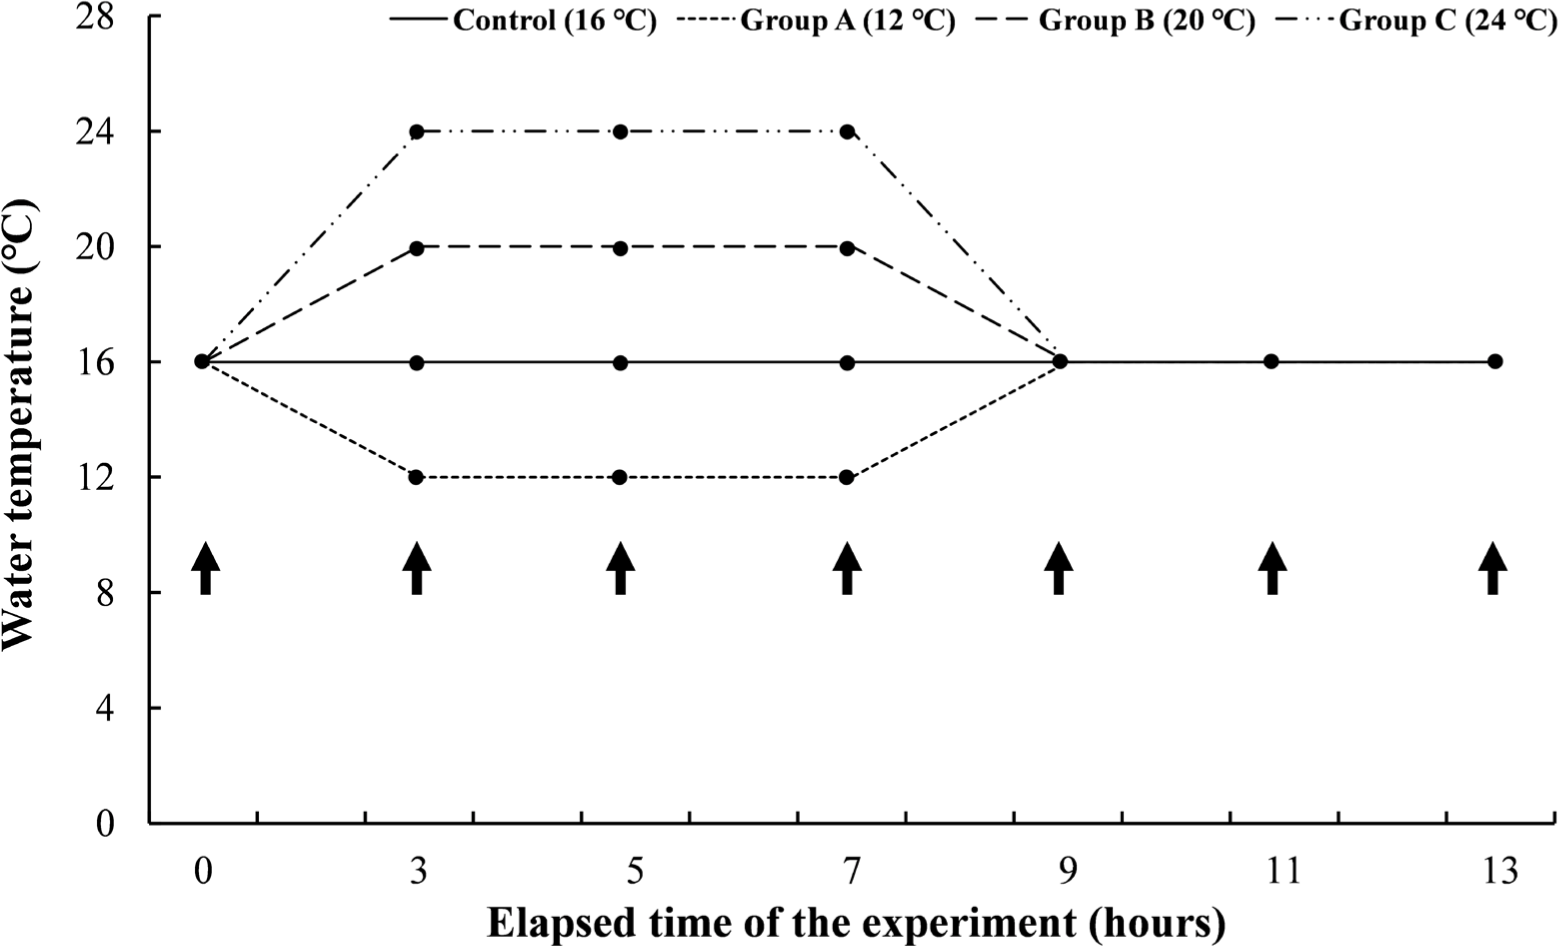
Experiment I was a short-term experiment by water temperature. The mean length and body weight of O. keta (n = 168) was 27.8 ± 2.0 cm and 73.7 ± 13.0 g, respectively. The experimental fish were housed in three tanks containing 14 O. keta for each experimental group. The same water temperature as the natural water for O. keta during the experiment period, 16°C, was set as a negative control, and the experimental groups were set to 12°C, 20°C, and 24°C. All experimental groups started at 16°C and lowered or raised the water temperature for 2 hours to reach the set temperature for each group. The experimental groups gave water temperature stimulation for 4 hours at each water temperature, raising or lowering the water temperature again for 2 hours to 16°C, and then giving recovery time for 4 hours (Fig. 1). Even during the experimental period, DO was maintained at 8 mg/L or higher, and the water temperature was adjusted by thermostat and controller. During the experiment, feed was supplied twice a day, and the flow rate was the same as the acclimation period.
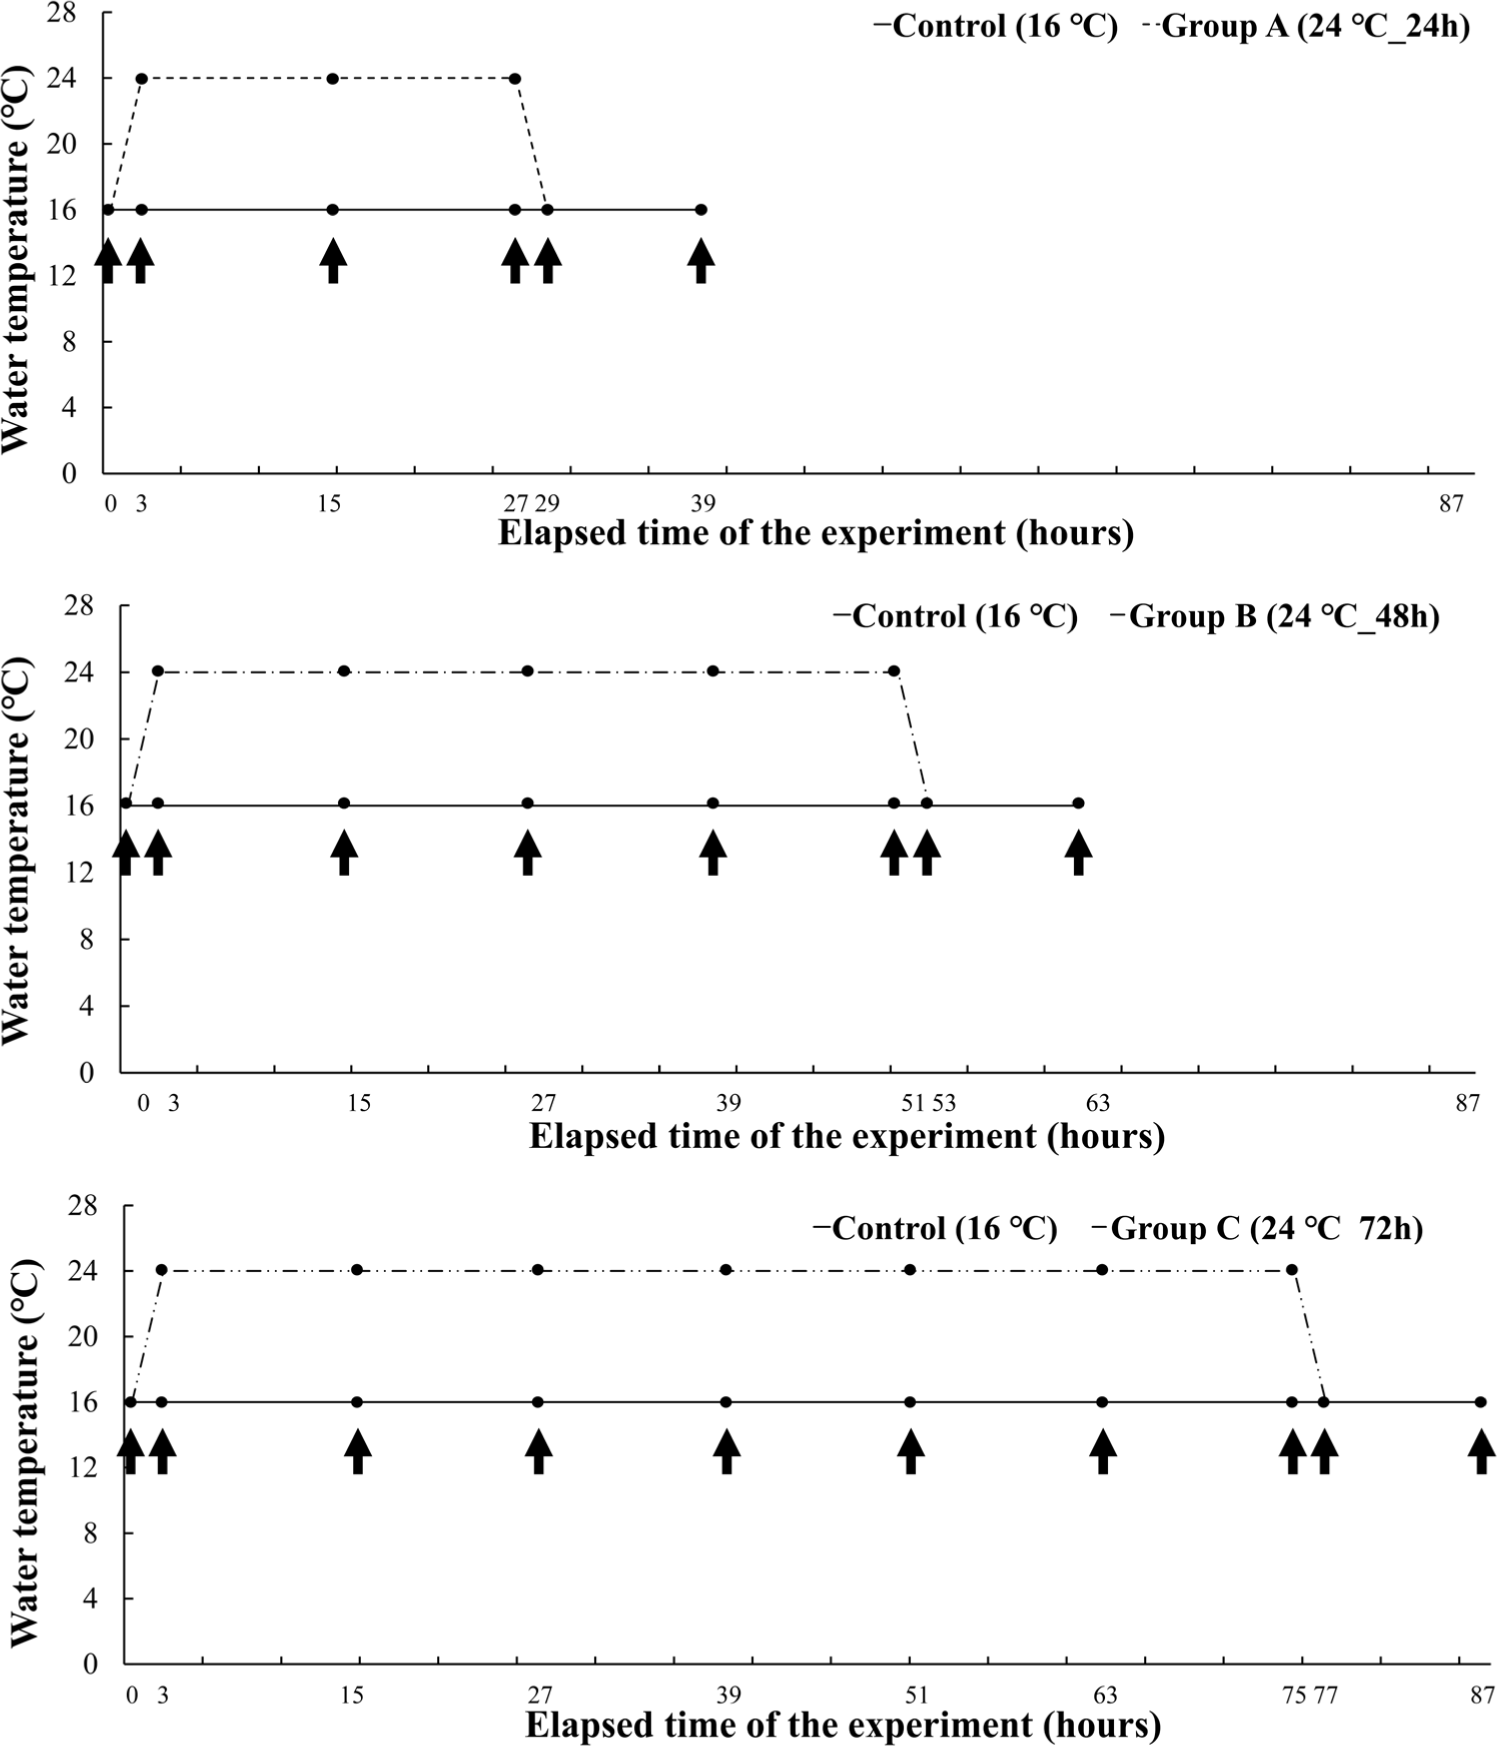
In Experiment II, a short-term experiment for each period was conducted on the water temperature judged to be critical in Experiment I. The mean length and body weight of O. keta (n = 160) was 21.4 ± 1.6 cm and 73.6 ± 15.5 g, respectively. The experimental fish were housed in three tanks containing 64 O. keta for each experimental group. The experimental groups started at 16°C and raised the water temperature for 2 hours to induce heat stress for 24 hours, 48 hours, and 72 hours, respectively, at a high temperature of 24°C. All experimental groups recovered for 12 hours after heat stress (Fig. 2). Even during the experiment period, DO, water temperature, feed supply, and flow rate were performed in the same way as in Experiment I.
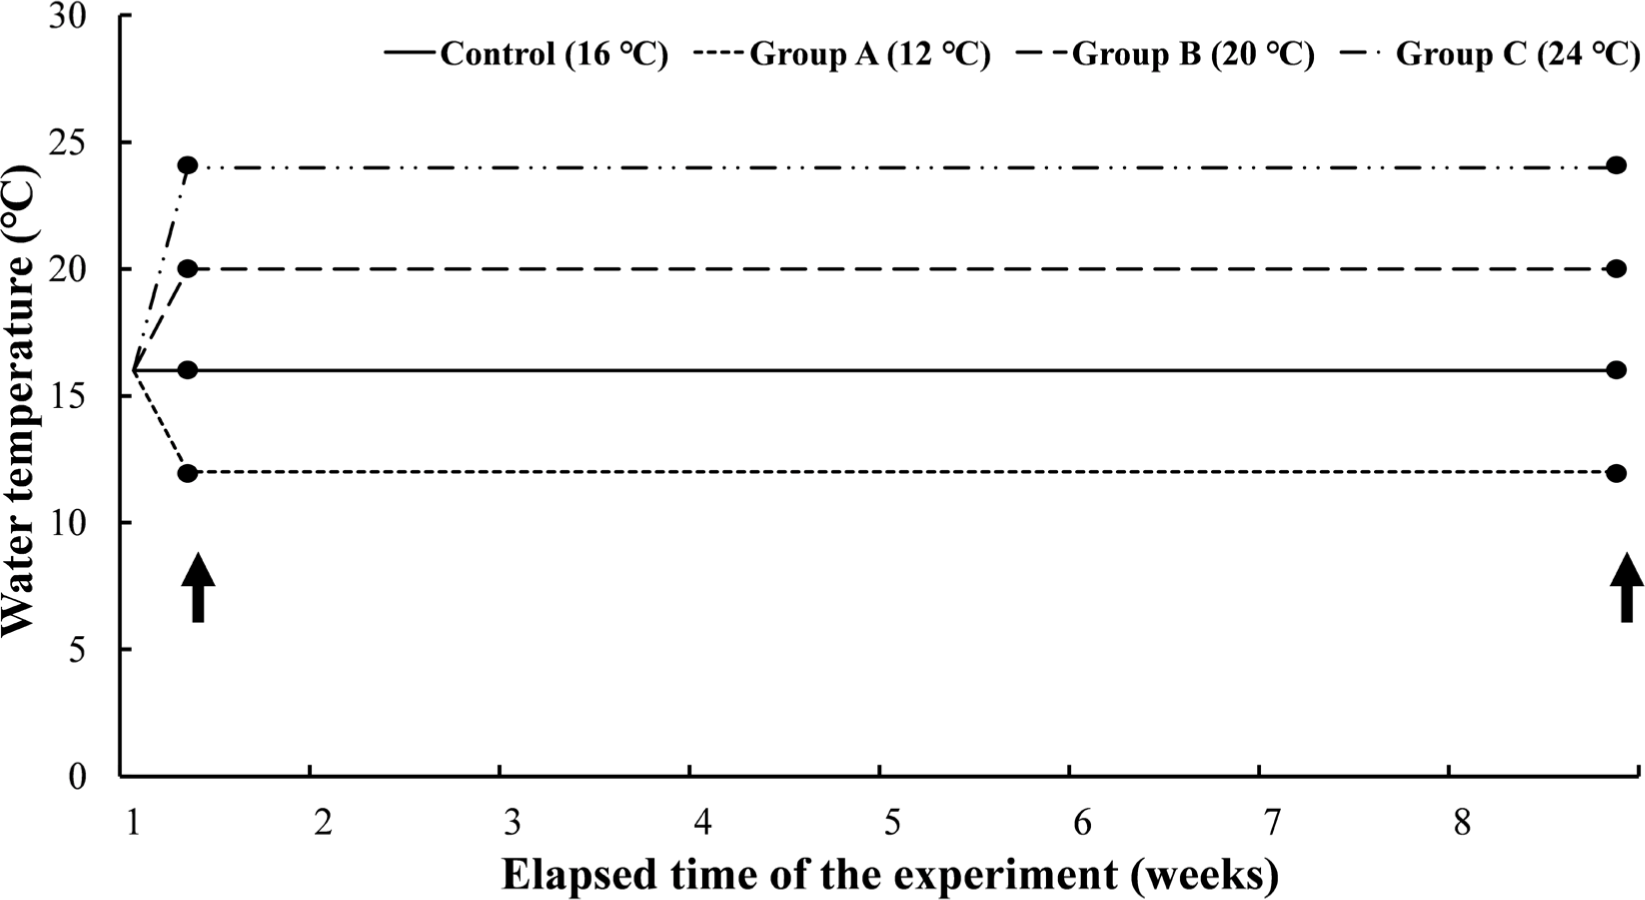
Experiment III was a long-term experiment by water temperature, which gave long-term water temperature stimulation for 8 weeks at the water temperatures set in Experiment I. The mean length and body weight of O. keta (n = 240) was 22.6 ± 0.9 cm and 97.9 ± 14.2 g, respectively. The experimental fish were housed in three tanks containing 60 O. keta for each experimental group. Similar to Experiment I, 16°C, the same water temperature as natural water, was set as a negative control, and the experimental groups were 12°C, 20°C, and 24°C. All experimental groups started at 16°C and lowered or raised the water temperature for 2 hours to reach the set temperature for each group and were reared at the water temperature for 8 weeks (Fig. 3). Even during the experimental period, DO was maintained at 8 mg/L or higher, and the water temperature was adjusted by thermostat and controller. During the experiment period, the feed was supplied twice a day. Feed amount was measured from the start to the end of the experiment, and the total length and weight of the experimental fish were measured at 0.1 cm and 0.1 g, respectively, using vernier calipers and an electronic scale.
Fish were anesthetized with 20 mg/L tricaine methane sulfonate (MS-222, Sigma-Aldrich, St. Louis, MO, USA) before blood samples were collected. Blood samples were obtained from the caudal vein of fish from each tank using 23 G syringes with heparin sodium, respectively. Blood samples were centrifuged at 1,000×g for 10 min. Plasma was collected and stored at −80°C until analysis.
In order to investigate the survival rate of fish, the survival of turned over the body was checked at intervals of 2 hours. Blood sampling was performed at the start of the experiment, immediately after stimulation, at the 2nd hour of stimulation, at the 4th hour of stimulation, at the start of recovery, at the 2nd hour of recovery, and at the 4th hour of recovery, respectively.
Survival rate surveys were performed in the same method as in Experiment I. Blood sampling was performed at the start of the experiment, immediately after stimulation, and every 12 hours after stimulation in all experimental groups. And blood sampling was performed at 1 hour and 12 hours after recovery after the 24 hours, 48 hours, and 72 hours of water temperature stimulation, respectively. All experimental groups were conducted simultaneously to reduce the variables, and the experiments were terminated in chronological order.
All the experimental samples of Experiment I, Experiment II, and Experiment III were analyzed for plasma cortisol and glucose levels in the following way. The plasma levels of cortisol were measured using a Fish Cortisol ELISA kit (MyBioSource, San Diego, CA, USA), and all plasma samples were analyzed in duplicate. For the assay, 50 μL of fish plasma sample and 50 μL of the standard solution were added per well. 50 μL of the antibody-horseradish peroxidase-conjugate solution was added to each well except blank, and mixed well, incubated for 1 hour at 37°C. Then, the solution of each well was removed and washed three times with 250 μL of 1X wash buffer. 50 μL of substrate A and 50 μL of substrate B solution were added to each well and incubated for 15 min at 37°C. After adding 50 μL of stop solution, determined the optical density (OD) of each well within 5 min, using a SpectraMax 190 microplate reader (Molecular Devices, San Jose, CA, USA) set to 450 nm. The standard curve was constructed, and the concentration of samples can be determined by regression analysis.
Plasma levels of glucose were measured using a Glucose Assay Kit (MyBioSource). 50 μL of each glucose standard and plasma sample was added per well, and 50 μL of reaction mix solution was added to each well. Then, incubated for 40 min at 37°C protected from light. After incubation, the absorbance was measured using a microplate reader in the 540–570 nm range. The concentration of glucose within samples was calculated by comparing the sample OD to the standard curve. In Experiment I, the inter-assay coefficients of variability (CV) of cortisol assay was 0.6%–13.4% while intra-assay CV was 0.7%–6.7%, and the inter-assay CV of glucose assay was 0.5%–12.2% while intra-assay CV was 0.4%–8.3%. In Experiment II, the inter-assay CV of cortisol assay was 0.2%–11.7% while intra-assay CV was 0.5%–9.6%, and the inter-assay CV of glucose assay was 1.2%–8.5% while intra-assay CV was 0.4%–6.9%. In Experiment III, the inter-assay CV of cortisol assay was 0.2%–11.7% while intra-assay CV was 2.2%–13.7%, and the inter-assay CV of glucose assay was 1.2%–15.4% while intra-assay CV was 0.8%–8.4%.
The measurements obtained from the experiment were expressed as the mean ± SE, and the significance of differences among the treatment groups was performed using one-way analysis of variance and Duncan’s multiple range test (p < 0.05), and Student’s t-test with SPSS software (version 24; IBM, Armonk, NY, USA).
Results
The cumulative survival rates of the experimental groups of Experiment I are shown that all experimental groups had a 100% survival rate during the experiment period (data not shown).
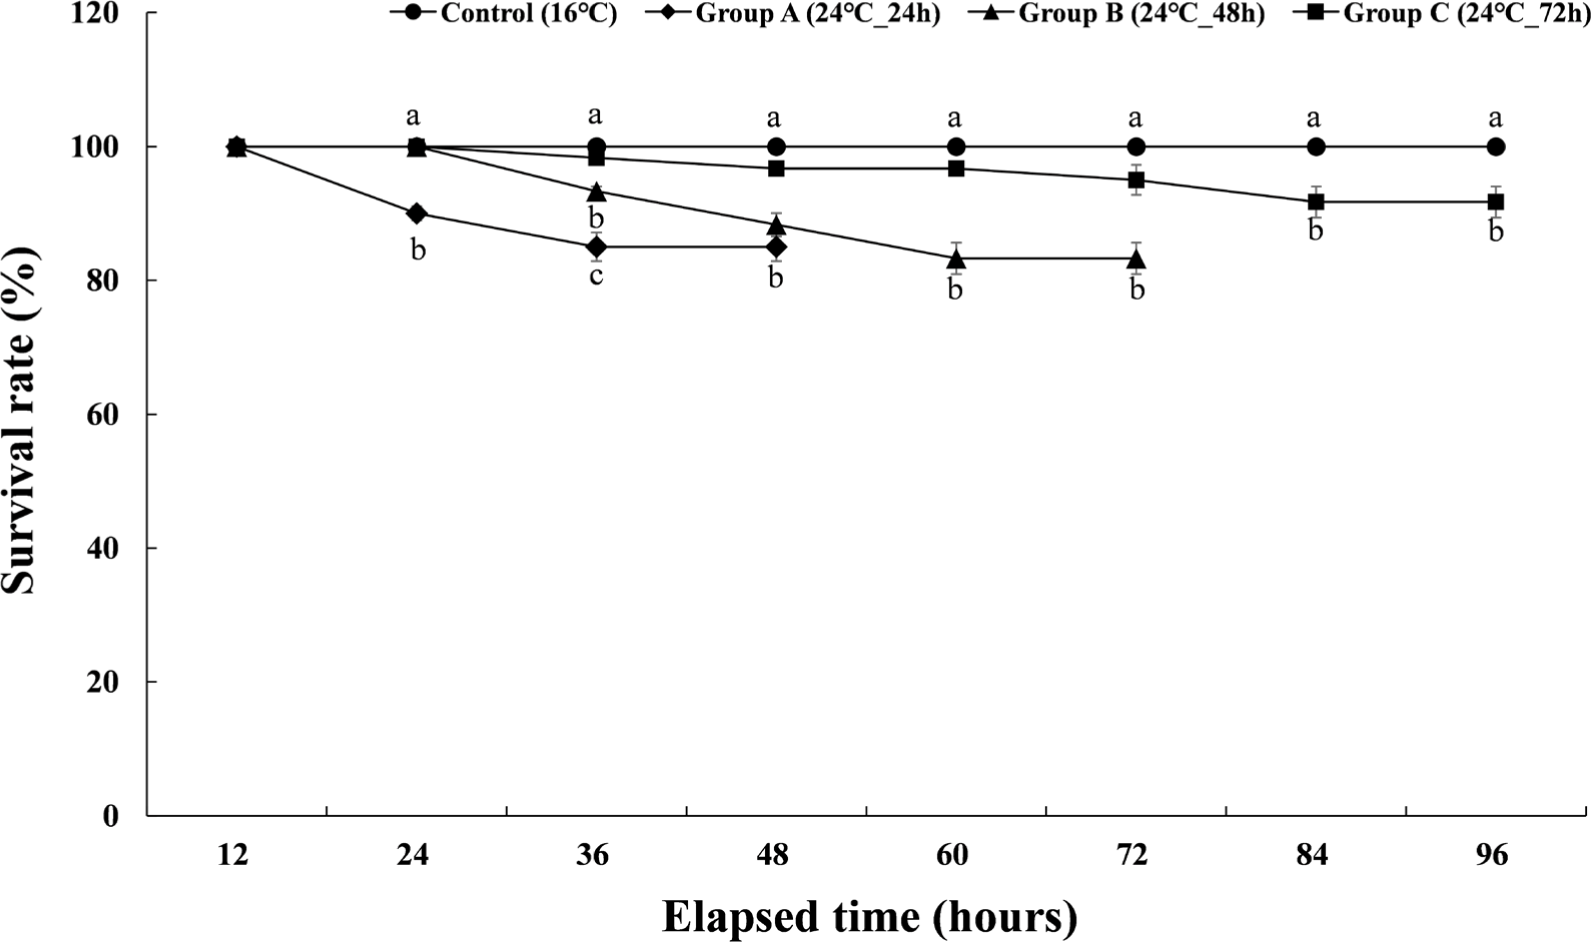
The cumulative survival rates of the experimental groups of Experiment II are shown in Fig. 4. The control group showed a survival rate of 100% during the experiment period, and group A, which was given a high temperature of 24°C for 24 hours, showed a survival rate of 90% at 24 hours after the stimulation was finished. And the survival rate during the recovery period was 85%. Group B, which was given a high temperature of 24°C for 48 hours, showed a survival rate of 93.9% at 36 hours after the stimulation and 88.3% at 48 hours. The survival rate during the subsequent recovery period was 83.3%. Group C, which had been subjected to high-temperature stress at 24°C for 72 hours, started to decrease survival rate from 36 hours after the stimulation and showed a survival rate of 95% at 72 hours. After that, the survival rate during the recovery period was 91.7%.
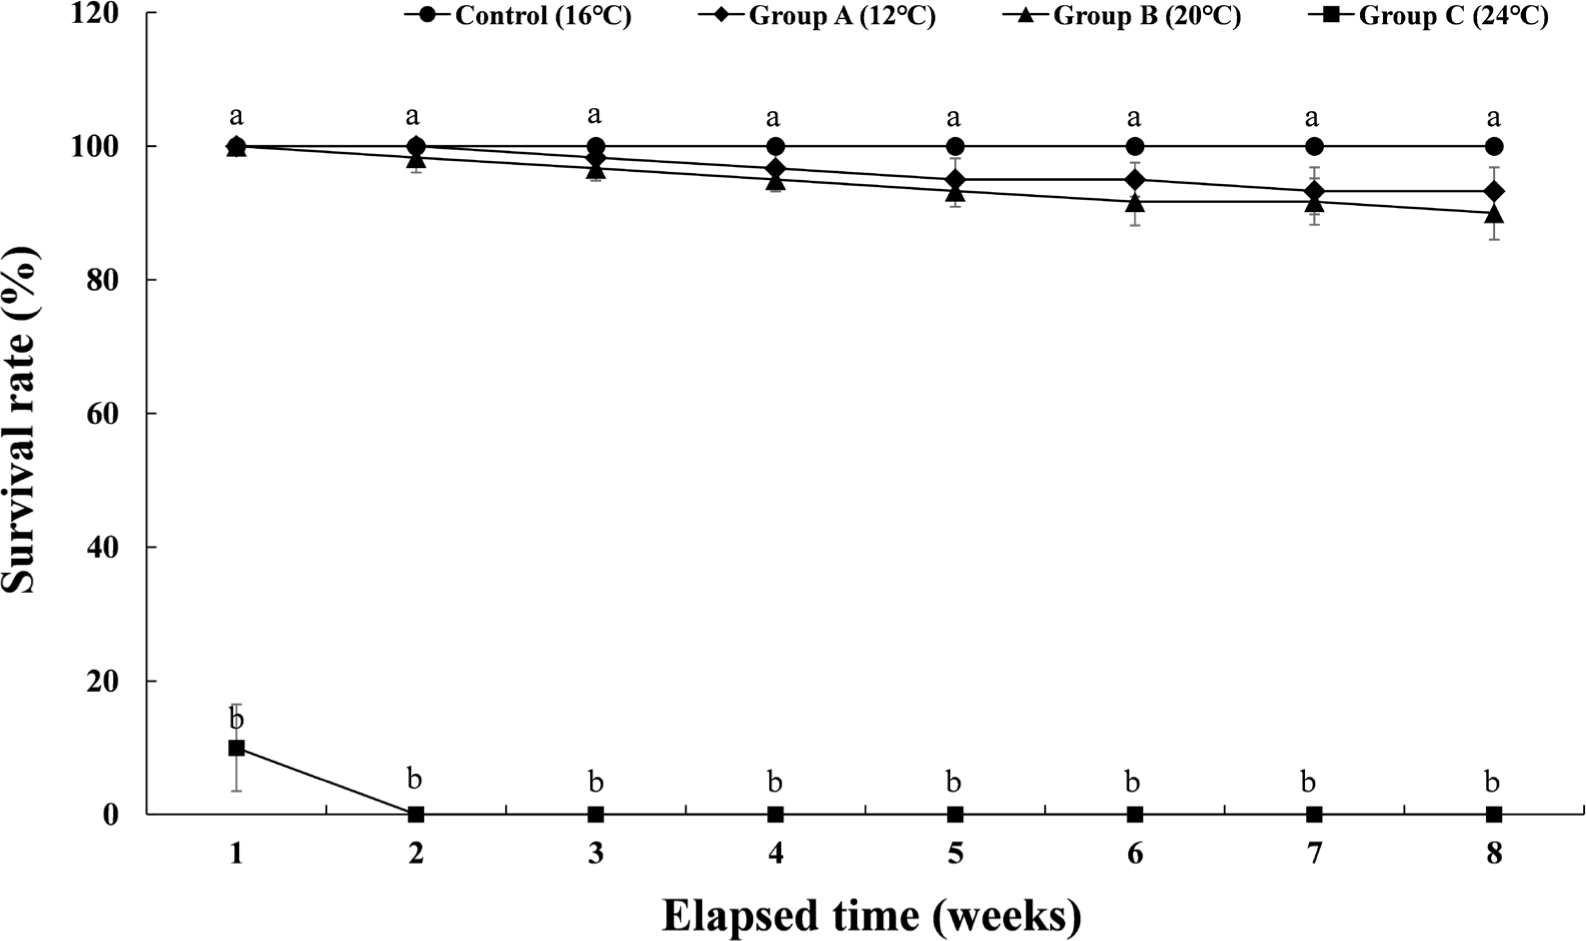
The cumulative survival rate of Experiment III is shown in Fig. 5. The control group had a survival rate of 100% during the 8 weeks of the experiment. In group A, which maintained the water temperature of 12°C for 8 weeks, the survival rate decreased to 98.3% from the 3rd week, and the cumulative survival rate was 93.3% at the 8th week when the experiment was finished. In group B, which maintained the water temperature of 20°C for 8 weeks, the survival rate decreased to 98.3% from the 2nd week and gradually decreased. At 8 weeks after the end of the experiment, the survival rate was 90%. In group C, which was housed at a water temperature of 24°C for 8 weeks, 90% of the experimental fish died in the first week of raising the water temperature. All of them died in the second week of the experiment. Table 1 shows the initial body weight, final body weight, the percent of weight gain, daily growth rate, feed efficiency, daily food intake rate, and condition factor of each experimental group. In the case of group C, it could not be included in Table 1 due to total mortality.
Weight gain: (final body weight – initial body weight) / initial body weight × 100; specific growth rate: [ln(final body weight) – ln(initial body weight)] / days reared × 100; feed efficiency: (wet weight gain / feed intake) × 100; daily feed intake: F / [(initial body weight + final body weight + dead fish weight) × days reared / 2] × 100; condition factor: (final body weight / total length3) × 100.
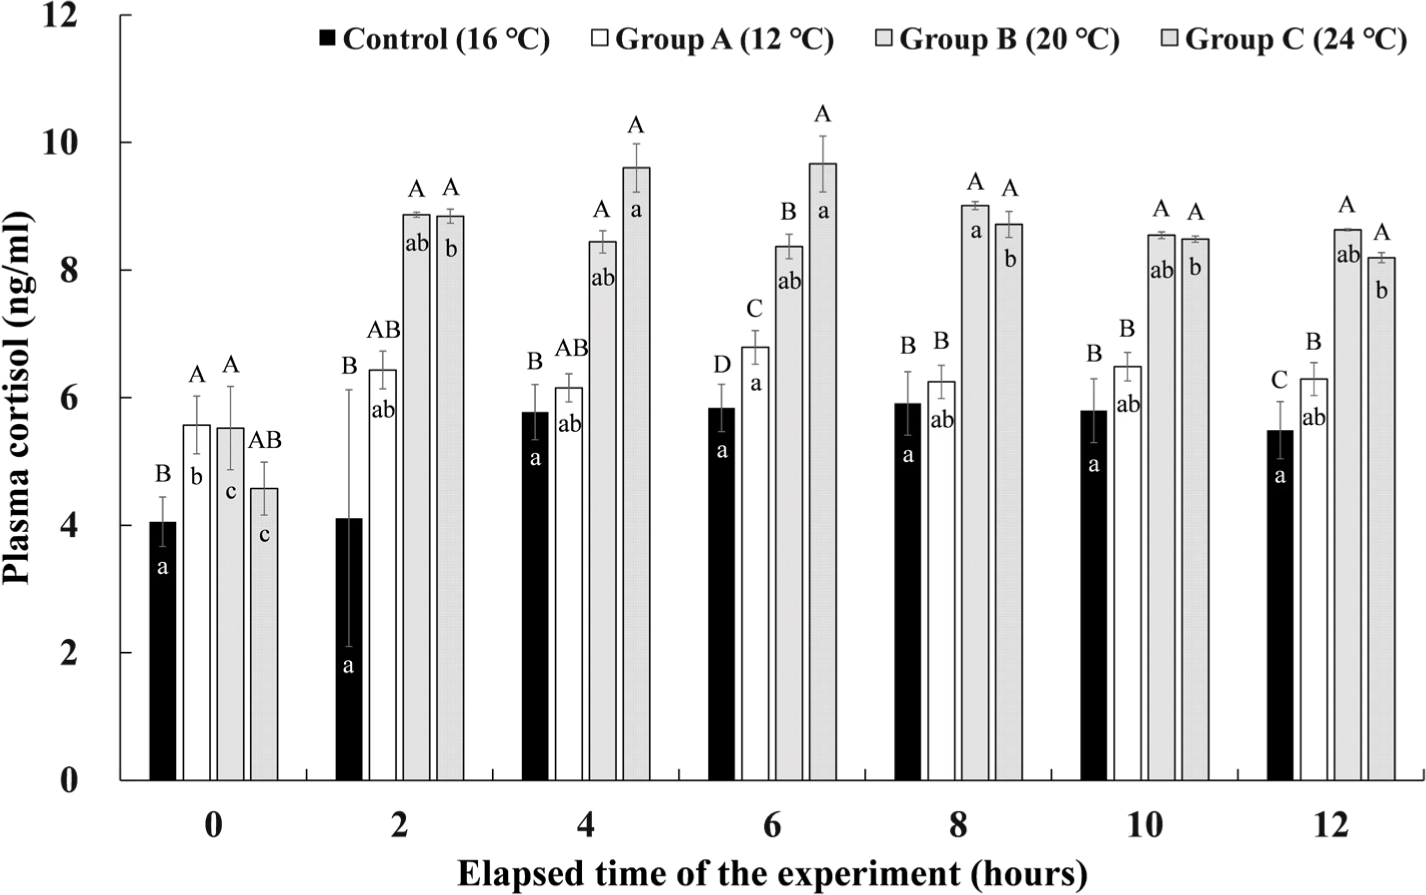
The cortisol concentrations in the plasma of Experiment I are shown in Fig. 6. The control group maintained at 16°C showed no significant change in plasma cortisol concentration during the experimental period. Group A, which lowered the water temperature to 12°C and maintained it for 4 hours, showed the highest cortisol concentration of 6.79 ± 0.26 ng/mL at 6 hours after the end of the water temperature stimulation. However, there was no significant difference in the remaining sections except before the start of the experiment. In group B, where the water temperature was raised to 20°C and maintained for 4 hours, the plasma cortisol concentration increased rapidly immediately after raising the water temperature, and the highest concentration of 9.01 ± 0.06 ng/mL was found at 8 hours after the experiment started when the water temperature was lowered again to 16°C. As in group A, there were no significant differences in the remaining sections except before the start of the experiment. In group C, where the water temperature was raised to 24°C and water temperature stimulation was given for 4 hours, the plasma cortisol concentration rapidly increased after raising the water temperature, and it was significantly higher values of 9.60 ± 0.38 ng/mL and 9.66 ± 0.44 ng/mL at 2 hours and 4 hours after the water temperature stimulation (4 hours and 6 hours after the experiment elapsed). Thereafter, the plasma cortisol concentration gradually decreased during the recovery time.
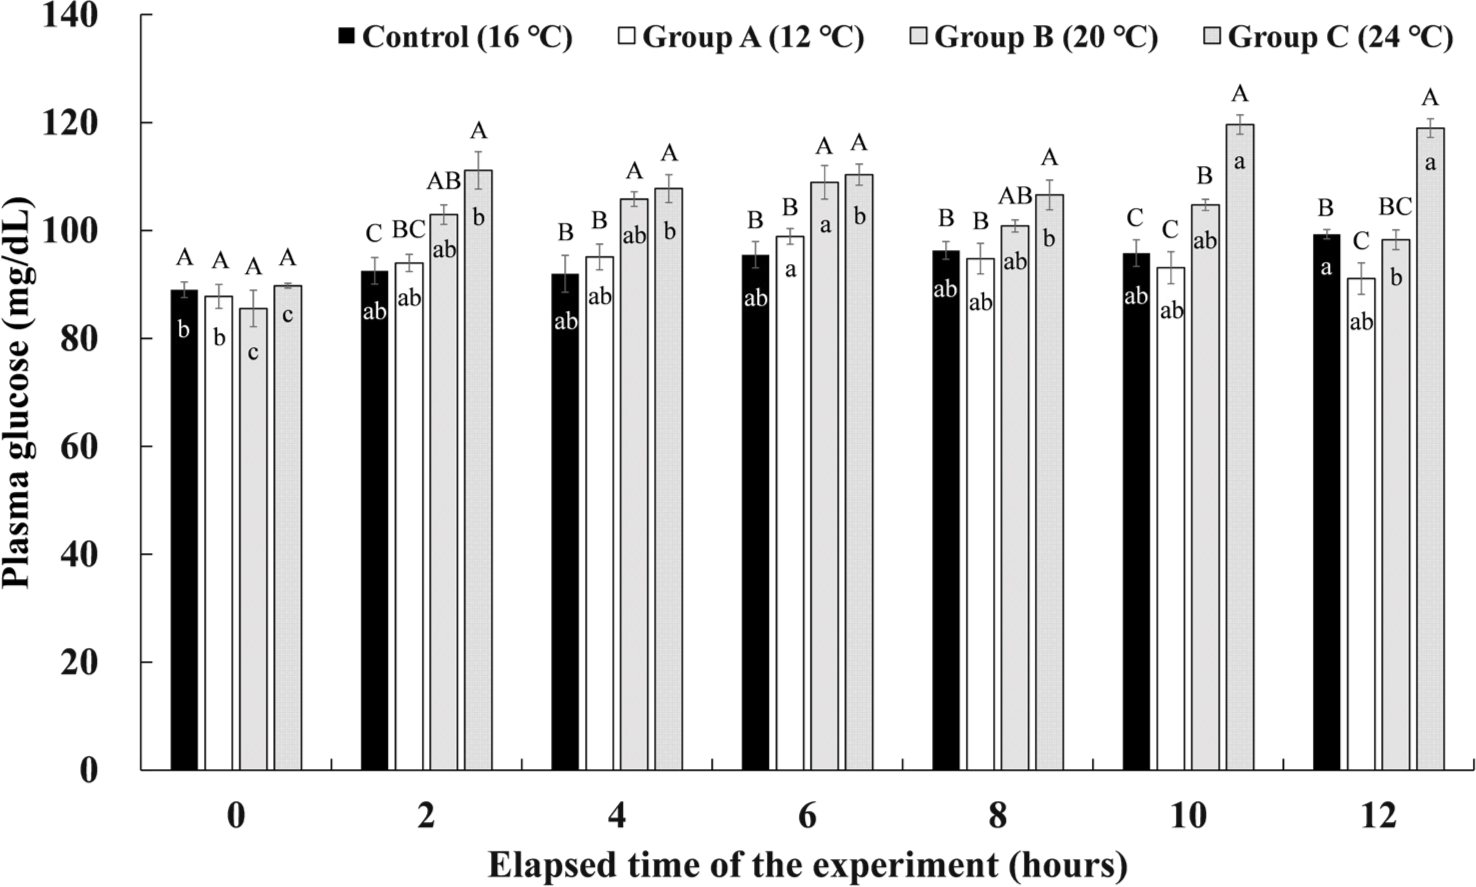
The plasma glucose levels of Experiment I are shown in Fig. 7. The control group showed the highest glucose level of 99.32 ± 0.87 mg/dL in the plasma at 12 hours after the experiment, but there was no significant difference from other periods. In group A, the highest plasma glucose level of 98.90 ± 1.44 mg/dL was seen 6 hours after the 12°C of water temperature stimulation was finished, and there was no significant difference from the rest of the periods except before the start of the experiment. In group B, the highest glucose level of 108.91 ± 3.11 mg/dL in the plasma was found at the 6th hour after the 20°C of water temperature stimulation for 4 hours. It was found that it decreased significantly to 98.27 ± 1.83 mg/dL at 12 hours after the experiment, which is the 4th hour of recovery. Group C showed the significantly highest glucose levels of 119.63 ± 1.79 mg/dL and 118.96 ± 1.74 mg/dL at 2 and 4 hours of recovery after the 24°C water temperature stimulation was finished.
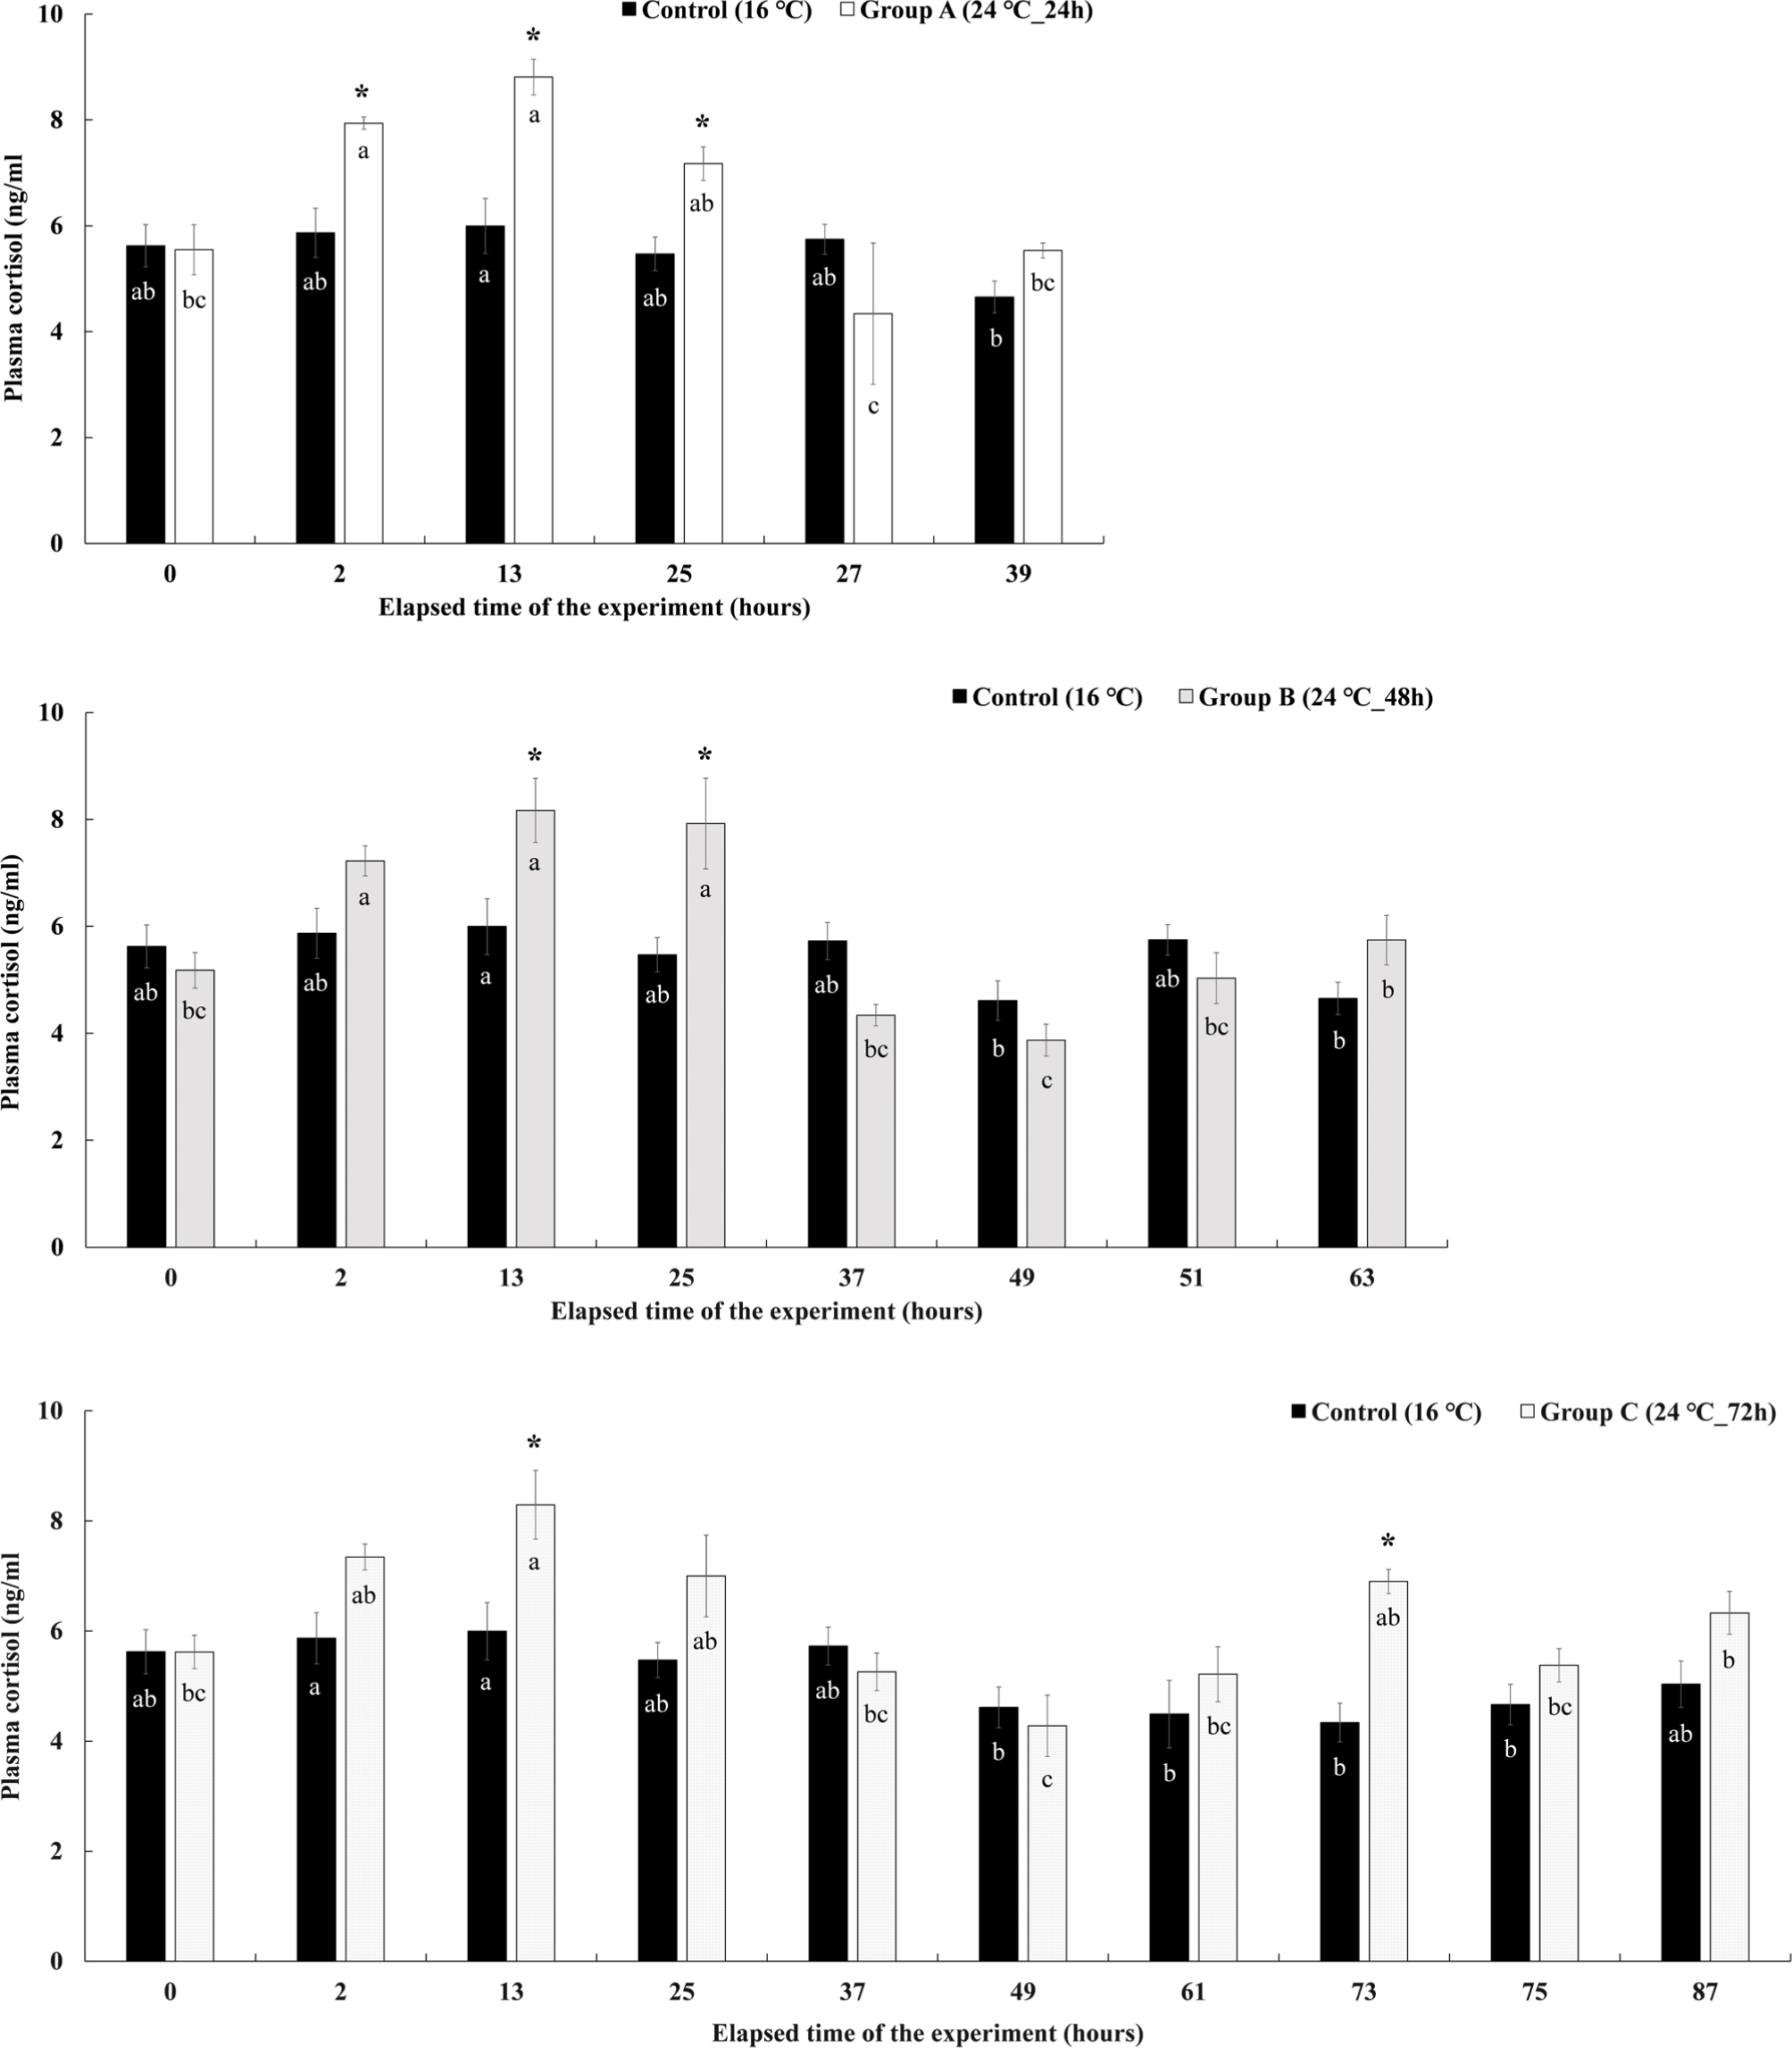
The change in the plasma cortisol concentration in Experiment II is shown in Fig. 8. In group A, which was given a high temperature of 24°C for 24 hours, the concentration of cortisol in the plasma increased significantly to 7.94 ± 0.12 ng/mL at the 2nd hour immediately after the water temperature was raised, and the highest concentration of 8.81 ± 0.34 ng/mL was shown at the 13 hours after the experiment. Thereafter, it gradually decreased at 25 hours after the end of the water temperature stimulation, but the cortisol concentration was found to be significantly higher than that of the control group. Thereafter, the concentration decreased to 4.34 ± 1.34 ng/mL and 5.53 ± 0.14 ng/mL at the recovery time of 27 and 39 hours, and there was no significant difference with the control group. The plasma cortisol concentration of group B maintained at 24°C of high temperature for 48 hours, started to increase significantly after raising the water temperature, and showed significantly higher values of 8.17 ± 0.60 ng/mL and 7.92 ± 0.85 ng/mL at 13 and 25 hours after experiment elapsed. However, the concentration decreased sharply from the 37 hours, and there was no significant difference with the control group during the recovery time after the water temperature stimulation was finished. In group C, the high temperature of 24°C was maintained for 72 hours, and the plasma cortisol concentration showed a significantly higher value of 8.29 ± 0.63 ng/mL at the 13 hours after the experiment elapsed, and then gradually decreased. There was no significant difference from the control group in the remaining sections except for the 13 and 73 hours.
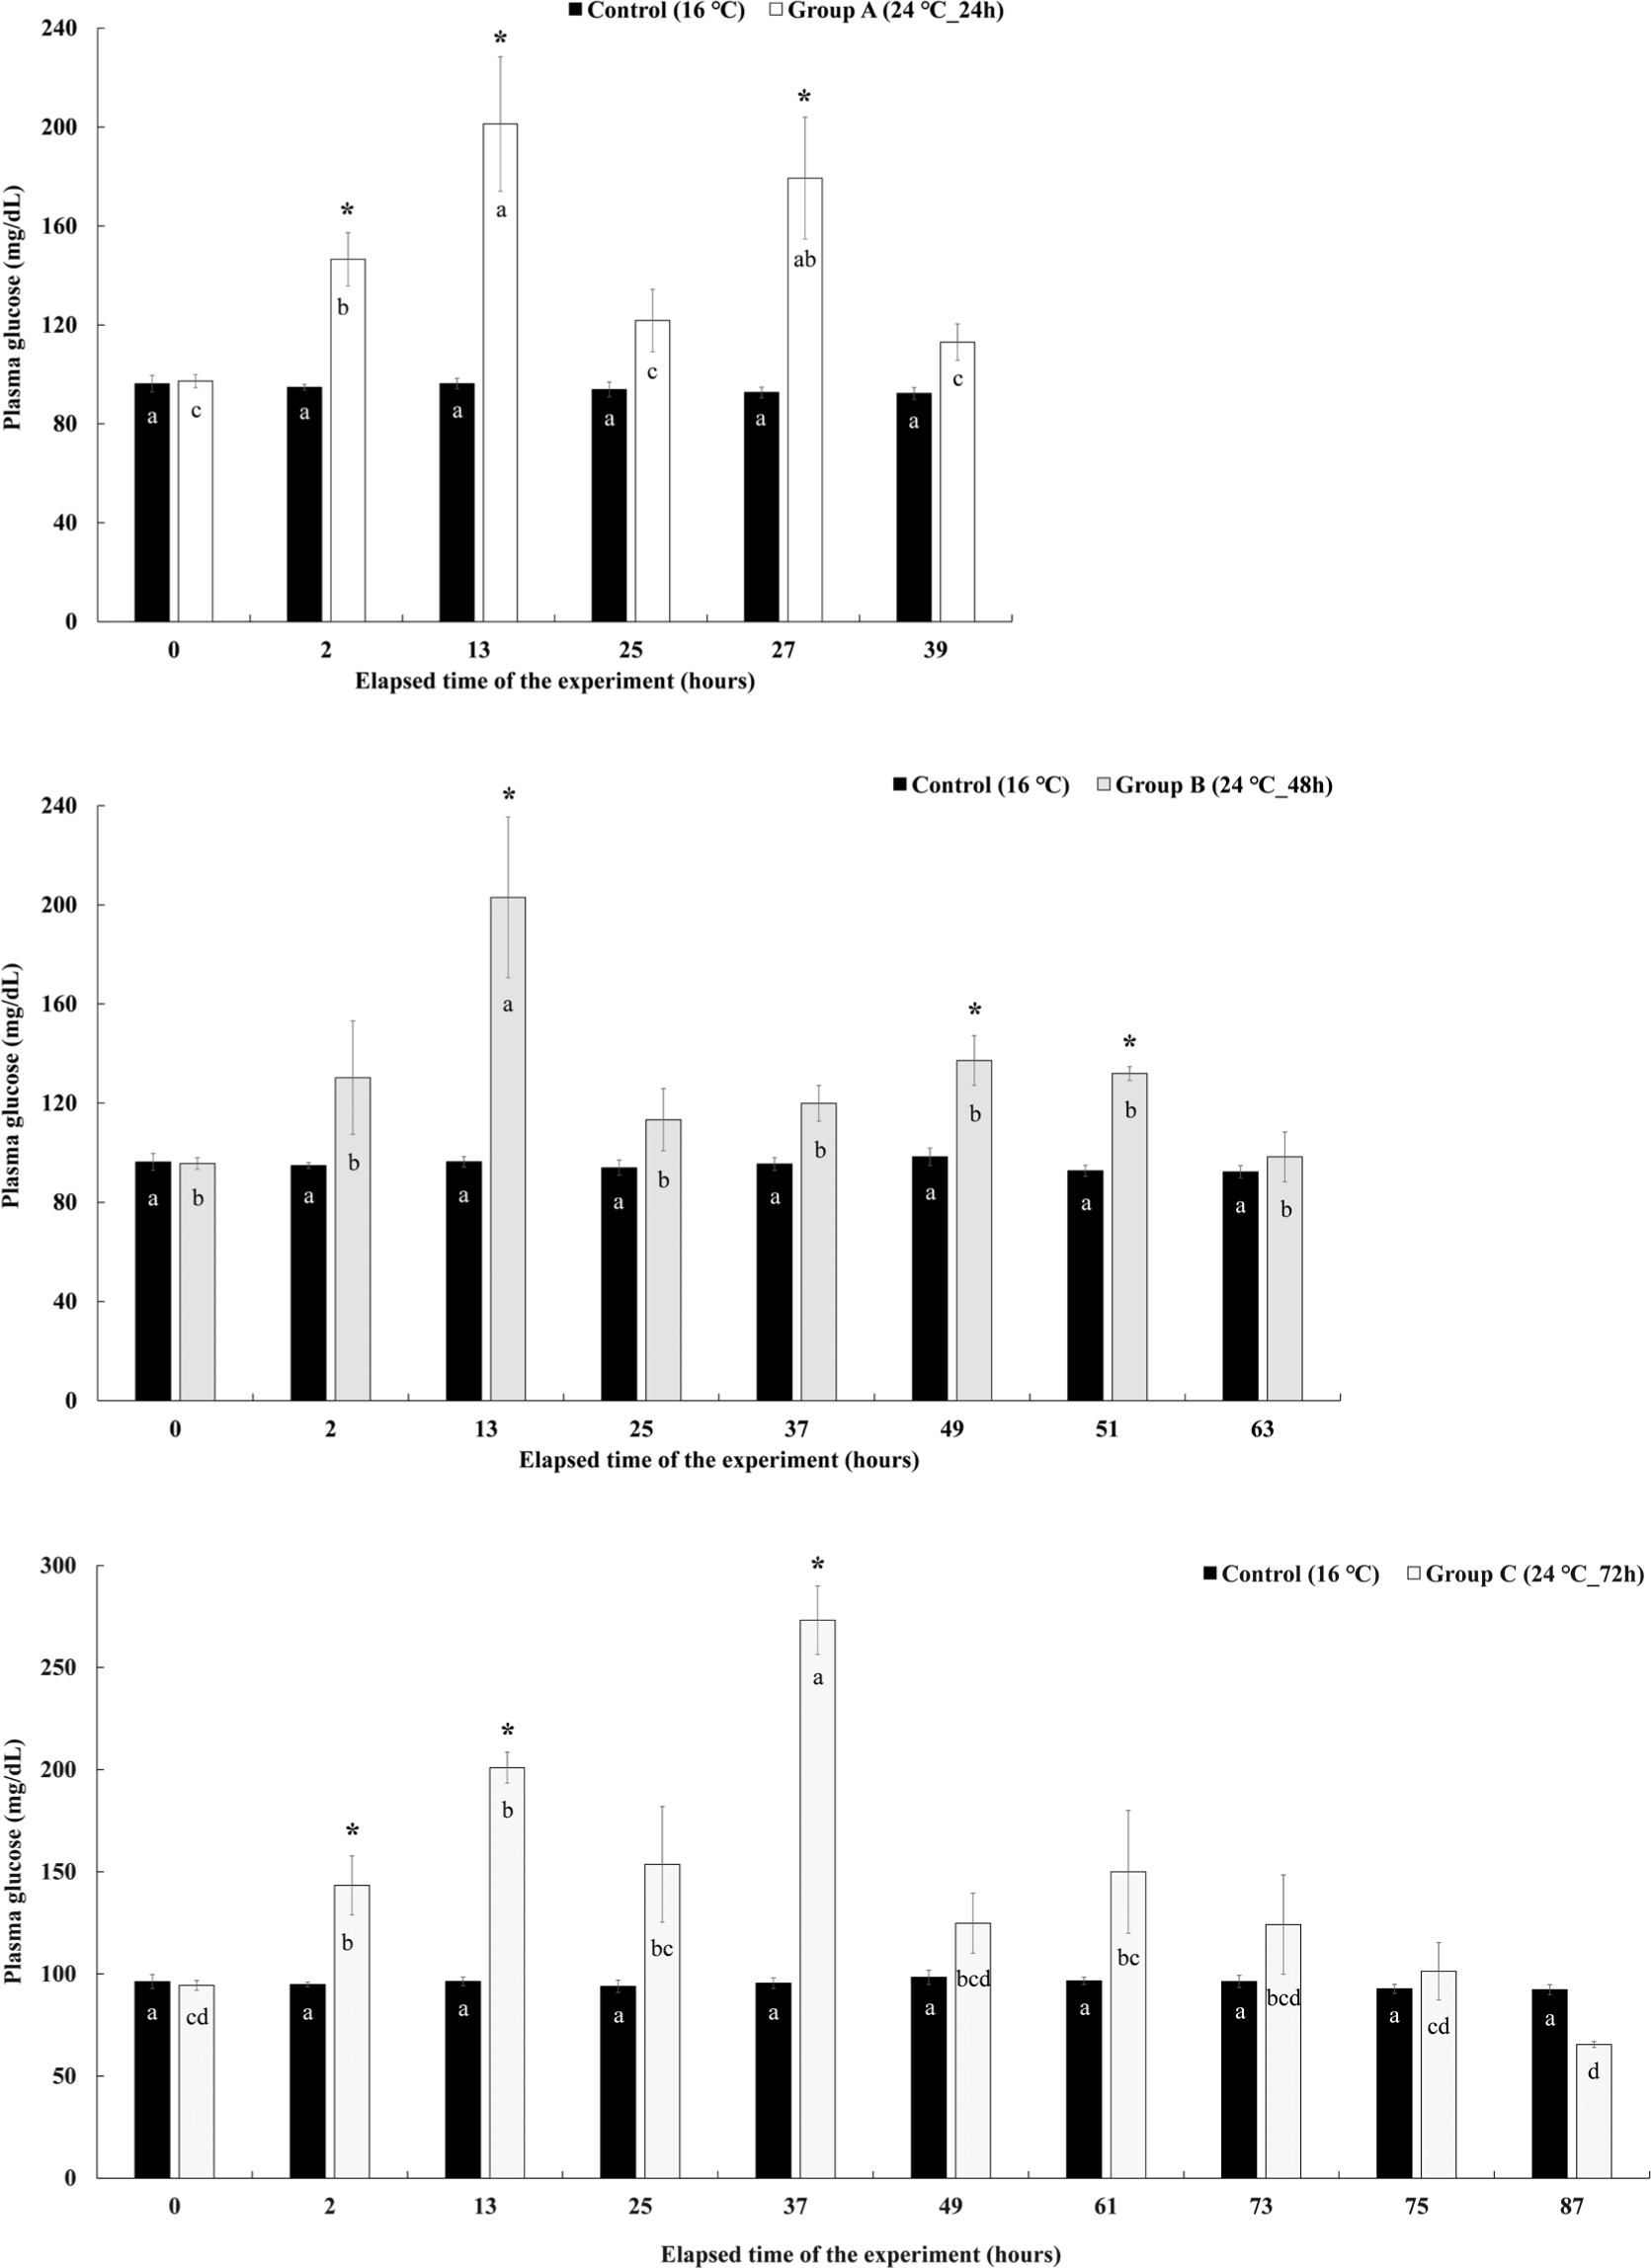
Changes in plasma glucose level in Experiment II are shown in Fig. 9. The plasma glucose levels of group A were significantly increased compared to the control group at the 2 hours after the experiment elapsed and showed the highest value of 201.25 ± 27.21 mg/dL at the 13 hours. At 25 hours after the end of the water temperature stimulation, there was no significant difference with the control group. However, it increased again after the recovery started, showing a significantly higher glucose level of 179.35 ± 24.65 mg/dL in the plasma than in the control group. After 4 hours of recovery, it decreased again. The plasma glucose levels of group B increased rapidly at the 13th hour of the experiment, showing a significantly higher value of 203.01 ± 32.43 mg/dL than that of the control group. Thereafter, it decreased, but increased significantly compared to the control group at 49 hours after the end of the water temperature stimulation and at 2 hours after recovery. At 4 hours of recovery, it decreased again and did not show a significant difference from the control group. The plasma glucose levels of group C started to increase significantly at 2 hours after water temperature stimulation and showed significantly higher values of 200.96 ± 7.58 mg/dL and 273.13 ± 16.75 mg/dL than that of the control group at 13 and 37 hours after the start of the experiment. Thereafter, it decreased and there was no significant difference compared to the control group.
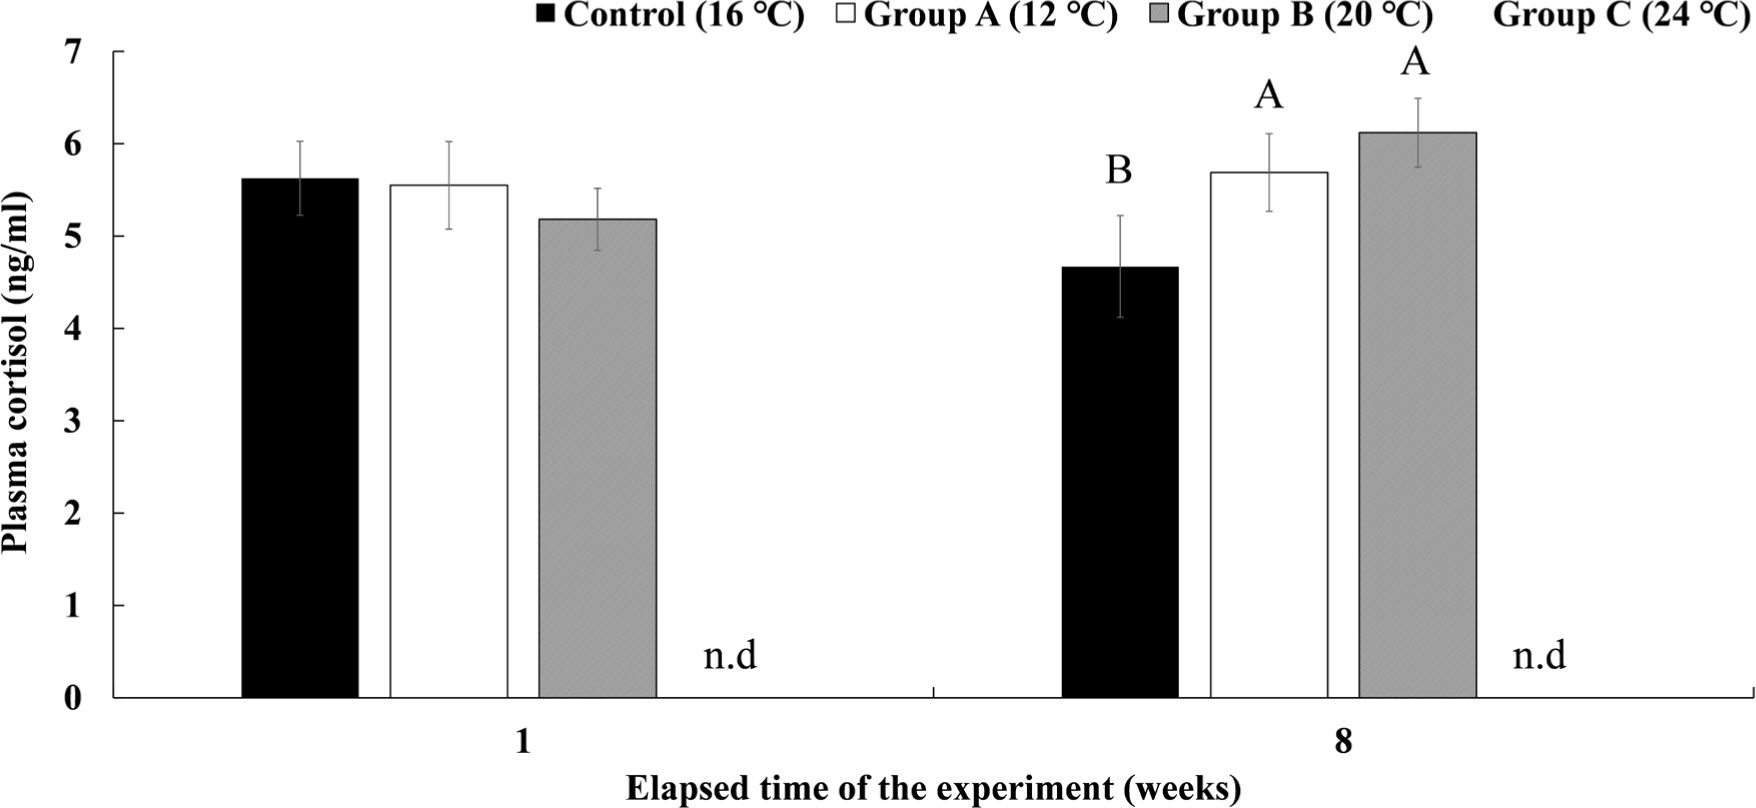
The plasma cortisol concentration in Experiment III is shown in Fig. 10. Group A, which was housed for 8 weeks at a water temperature of 12°C, showed a significantly higher cortisol concentration than the control group after 8 weeks (5.69 ± 0.42 ng/mL). In group B, which was maintained at 20°C for 8 weeks, the plasma cortisol concentration after 8 weeks was not significantly different from group A but was significantly higher than that of the control group (6.12 ± 0.37 ng/mL). In group C, 90% had already died in the first week of raising the water temperature to 24°C, so plasma analysis could not be performed.
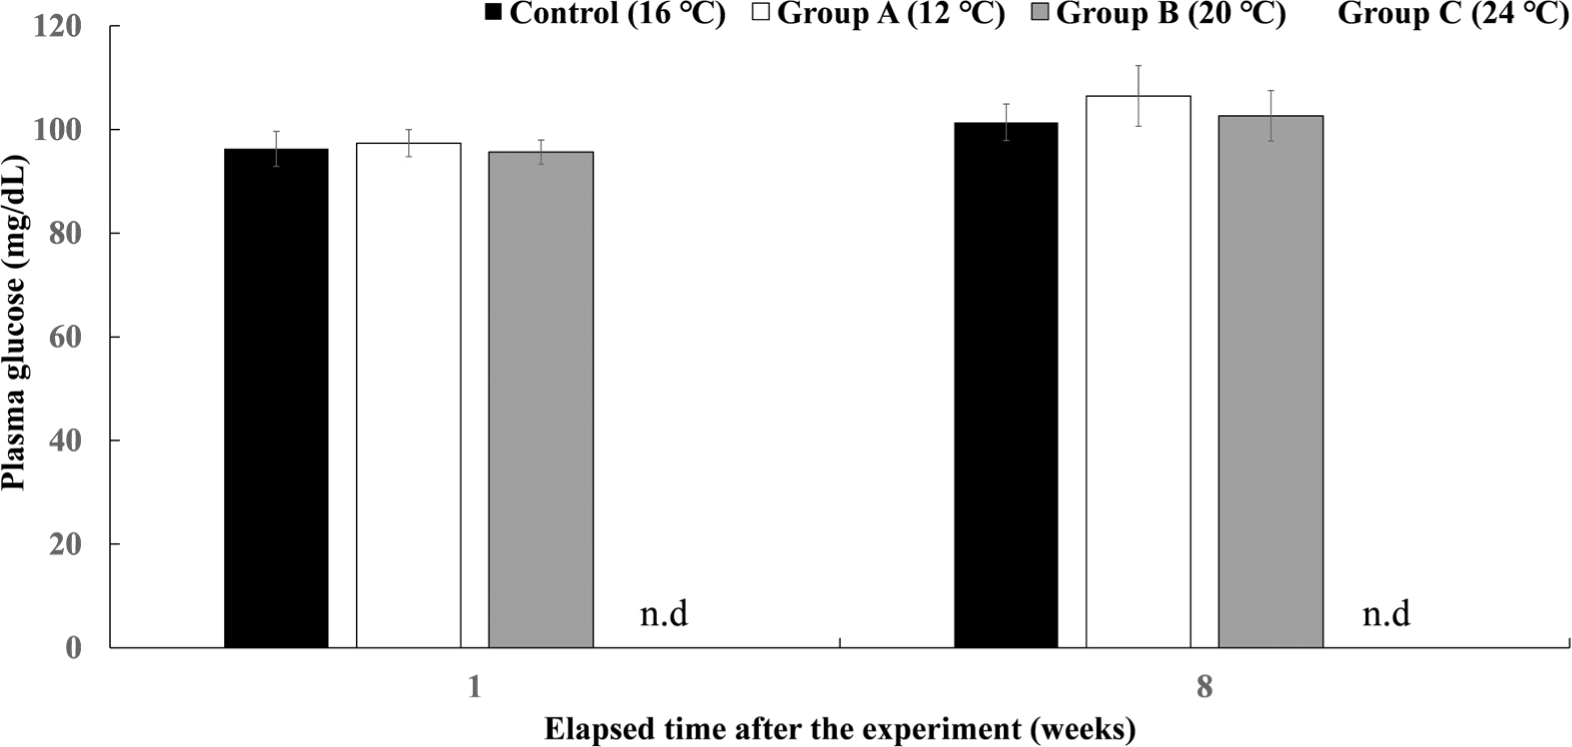
The plasma glucose levels of Experiment III are shown in Fig. 11. There was no significant difference in all experimental groups after 8 weeks.
Discussion
O. keta showed a 100% survival rate in all experimental groups in Experiment I, a short-term water temperature experiment, so it was judged that the water temperature stimulation for 4 hours did not affect the survival of O. keta. However, in the plasma analysis, in the case of the 20°C and 24°C experimental groups (group B, C), the plasma cortisol concentration increased rapidly immediately after the water temperature stimulation, and during 4 hours of stimulation, these two experimental groups showed significantly higher values than the control group, showing a stress response to the water temperature increase. It was confirmed in the case of group A with a water temperature of 12°C, there was no significant difference in plasma cortisol concentration from that of the control group. The change in plasma glucose concentration showed the highest value in group C, which was subjected to water temperature stimulation at 24°C for 4 hours from the start of water temperature stimulation to recovery time. When fish are faced with a stressful environment, the primary endocrine response involves the rapid release of stress hormones, catecholamines, and cortisol into circulation (Barton, 2002). Cortisol is released from interrenal tissues located in the head kidney in response to various pituitary hormones (Iwama, 1998). In particular, the adrenocorticotropic hormone, ACTH strongly stimulates the production of cortisol. The secreted cortisol activates several metabolic pathways that cause alterations in hematology. Among them, it is a kind of glucocorticoid hormone, which causes glycogen to be secreted from the fish liver through the blood to release glucose (Mommsen et al., 1999). This is a secondary response to stress, in order to cope with the energy demand required by the stress for the animal to cope with it metabolically. Glucose production serves as an energy substrate for tissues such as the brain, gill, and muscle to cope with the energy demands equivalent to stress (Costas et al., 2008). Cortisol has been shown to increase glucose production in fish by inducing both gluconeogenesis and glycogenolysis and is known to play an important role in stress-related plasma glucose concentrations (Faught & Vijayan, 2016). Measuring cortisol concentration has been used as an excellent approach to assessing the effectiveness of a given stressor on fish (Sadoul & Geffroy, 2019). It has been successfully applied in various studies to evaluate the stress level of salmonids according to the water temperature (Basu et al., 2001; Fevolden et al., 1993; Palmisano et al., 2000). In this study, the plasma cortisol concentration of group C, the 24°C of water temperature stimulation experimental group of Experiment I, increased significantly immediately after stimulation, and the plasma glucose concentration also increased after stimulation, showing the highest value at the end of stimulation. These results indicate that cortisol secretion was activated as a primary stress response due to the increase in water temperature, and the activated cortisol increased plasma glucose levels.
In Experiment II, there was no significant difference in the difference in survival rate among the experimental groups except for the control group, indicating that there was no effect on the survival rate according to time at a high temperature of 24°C. In Fig. 4, the reason why the survival rate according to water temperature was higher in group C than in other group A and group B may be the difference between individuals who included healthy individuals in the tanks, or they adapted to a water temperature of 24°C for 3 days. As a result of the analysis of plasma cortisol concentration, all experimental groups were significantly higher than the control group at 12 hours of stimulation, and cortisol concentration decreased during 12 hours of recovery, indicating that cortisol secretion was activated at the beginning of the experiment due to stress caused by water temperature. The plasma glucose concentration of all experimental groups except the control group showed the same pattern as the cortisol concentration and increased until the 12th hour of stimulation and gradually decreased during the recovery period. In studies in which high-temperature stress was applied to O. keta, 50% of the fish died within 1 minute when the fish was moved from 15.6°C to 26.7°C, and 100% mortality on 15 seconds with a transfer from 15.6°C to 32.2°C (Snyder & Blahm, 1971). These studies investigated the mortality rate by giving high-temperature shock in a short time to O. keta, and it is thought that different results in survival rate were obtained because the water temperature setting in our study was not sharp and the water temperature was raised slowly while the fish was housed.
In Experiment III, which was reared for 8 weeks by water temperature, all fish of the experimental group C at 24°C died while raising the water temperature, and there was no significant difference in survival rate between the control group and the experimental groups at 12°C and 20°C. There was no significant difference in the plasma cortisol concentration of the experimental groups in Experiment III at week 1, and at week 8, groups A and B were significantly higher than the control group, and there was no significant difference in glucose concentration in all groups. As a result, it is judged that the water temperature of 12°C and 20°C is the water temperature to which chum salmon can adapt in the long term. The standard of 15°C weekly average temperature can be seen as the upper temperature of the temperature conditions that provide suitable rearing conditions for O. keta juvenile (Beschta et al., 1987; Brett, 1952; Hicks, 2002). However, recently, many studies have been conducted on heat adaptation and plasticity of cold-water fish species (Drinan et al., 2012; Whitney et al., 2014), and if there is an adaptation period of a certain period, it is judged that they can adapt to the water temperature of 12°C or 20°C without being affected by water temperature fluctuations.
In this study, a hematological analysis of O. keta according to water temperature and period was performed. Water temperature fluctuations from 16°C to 12°C in short-term water temperature stimulation did not appear to have any effect on O. keta. It was judged that the water temperature fluctuations to 20°C and 24°C showed a stress response according to the water temperature as plasma cortisol and glucose concentrations increased. In the experiment during the period at high temperature, plasma cortisol and glucose increased after stimulation in all experimental groups except the control group, and then decreased during the recovery period, and there was no significant difference according to the stimulation period. In the case of long-term water temperature stimulation for 8 weeks, the water temperature of 24°C died within 1 week, and the water temperature of 24°C was judged to be fatal for O. keta. Water temperature fluctuations to 12°C and 20°C increased only the plasma cortisol concentration and there was no significant difference in glucose concentration, suggesting that the adaptation mechanism could be shown during the 8 weeks. It is judged that the water temperature fluctuation suitable for breeding O. keta is between 12°C and 20°C, and it is thought that it is necessary to pay attention to the high temperature of 24°C or more when breeding in summer at the aquaculture industry. The results of this study can be used as basic data on the water temperature of O. keta, the most abundant salmonid in Korea.


