Introduction
Surimi is stabilized myofibrillar protein obtained from deboned fish flesh (Dey & Dora, 2011). The surimi manufacturing process consists of fish fillet washing, mincing, refining, dehydrating, treating with cryoprotectants, molding, and freezing (Boziaris, 2014). The addition of cryoprotectants during the manufacturing process makes it possible to maintain a high gel-forming ability (Yoon & Lee, 1990).
Surimi has been used as the main ingredient in gelling products, such as imitation crab sticks (crab-flavored surimi seafood), fish cakes, fish sausages, and fish balls (Gao et al., 2018; Vidal-Giraud & Chateau, 2007). The gel strength of surimi is the most fundamental factor that determines its quality grade, and a high gel strength usually contributes to a high grade (Yoon & Lee, 1990). To date, studies on surimi-based products have focused on the effects of ingredients and processing conditions on rheological characteristics, such as gel strength and texture profiles (Bashir et al., 2017).
Surimi can also be used to produce fish snacks or grain-based snacks that do not require gel formation, and has been developed and commercialized mainly in Asia. Dried surimi powders have been used as the main or supplementary ingredient to prepare fish snacks or to prepare protein-fortified grain-based snacks (Santana et al., 2012). Most previous studies on fish snacks focused on the quality characteristics and manufacturing processes of non-frozen surimi or surimi powders (Ramesh et al., 2018). Frozen surimi from various fish species is commercially distributed worldwide in the food industry. However, studies have not yet been conducted on snacks made with frozen surimi.
Therefore, this study aimed to compare the quality properties of fried fish snacks prepared with frozen surimi of different grades, including Alaska pollock (AP; FA, A, RA) and threadfin bream (TB; FA, AA), which are the most commercially used worldwide. To investigate the physicochemical and sensory properties of fried fish snacks, the drying behavior, color, expansion, hardness, oil content, sensory evaluation, electronic tongue, and electronic nose were measured.
Materials and Methods
AP (Gadus chalcogrammus) and TB (Nemipterus spp.) surimi were used as the main materials for fried fish snacks. Their characteristics and specification are shown in Table 1. Frozen surimi was divided into 600 g blocks, sealed, and stored at –80°C in a deep freezer until use in this study. Tapioca starch was purchased from Daejin Food (Chungnam, Korea). Baking powder was purchased from Ottogi (Anyang, Korea). Salt was purchased from Sajo (Seoul, Korea). Palm oil was purchased from Lottefood (Seoul, Korea). All chemicals and solutions were of analytical grade.
Surimi snacks were prepared according to the following procedure: Surimi (60 g) was blended for 1 min in a hand blender (HR1673; Elektro-PLAST, Kaposvár, Hungary), followed by the addition of tapioca starch (1.5 g), baking powder (1 g), and water (28.5 g). The mixture was then blended for 5 min. The resulting dough was molded by placing a 2-mm thick stainless steel molding frame with a circular hole (3 cm in diameter) on a silicone plate and coated with a spatula. The molded dough was then dried at 50°C for 4 h using an air dryer (WFO-700; EYELA, Tokyo, Japan). To obtain puffed snacks, the dried intermediate products were deep-fried in palm oil at 190°C for 40 s.
Proximate compositions were measured using the standard analytical methods described by the Association of Official Analytical Chemists (AOAC, 2012). The moisture content was estimated using the oven-drying method. The amount of crude protein in each sample was determined using the micro-Kjeldahl method, the lipid content was estimated using the soxhlet extraction method, and the ash content was measured using the dry-ashing method. All analyses were performed in triplicate and are presented as average values.
Frozen surimi (1.5 kg) was placed and sealed in a polyethylene bag and then maintained at 5°C below room temperature (20°C). The samples were stirred with a hand blender (HR1673; Elektro-PLAST), followed by the addition of 3% salt, grinding, and crushing for at least 10 min to prepare a homogenized dough. The homogenized dough was placed in a 30 mm polyvinylidene chloride tube using an 18 mm diameter stuffing tube, and filled with approximately 150 g of paste. Next, the tube was tied at both ends. After the sample tube was heated in hot water at 85°C–90°C for 30 min, it was immediately cooled in cold water and left at room temperature for at least 3 h. A rheometer (CR-100D; Sun Scientific, Tokyo, Japan) was used to measure the gel strength and deformability of the surimi samples using a spherical plunger with a diameter of 5 mm and speed of 80 mm/min. Gel strength measurements were repeated 10 times.
To observe the drying properties, the surimi samples were placed in a hot-air dryer (WFO-700; EYELA) at 50°C for 6 h. The moisture content of each sample dried for 30 min, 1, 2, 3, and 4 h was measured and determined according to standard methods (AOAC, 2012). All analyses were performed in triplicates.
To measure the surface color of the fried fish snacks, a chromaticity instrument (SP60; Lovibond, Amesbury, UK) was used. A white standard board was used for calibration (L = 93.2, a = 0.3133, b = 0.3192). Hunter color values are expressed as L (lightness), a (redness), and b (yellowness). Each sample was measured five times and the average value was calculated.
A texture analyzer (CT3 4500; Brookfield Engineering Laboratories, Middleboro, MA, USA) was used to determine the hardness of fried fish snacks. The samples were fried in oil and cooled sufficiently before use. A spherical probe with a trigger force of 6.8 g and speed of 0.5 mm/s was used to puncture the sample at a distance of approximately 3 mm. Each sample was measured 10 times, and the average value was calculated.
The oil content of fried fish snacks was measured using soxhlet extraction with petroleum ether (Mai Tran et al., 2007). All analyses were performed in triplicate and the results were averaged.
The linear expansion of snacks was determined based on a previously described method (Cheow et al., 2004; Kawas & Moreira, 2001). The length of the samples before and after frying in oil at 190°C was measured by marking a line using a marker pen, and each sample was measured in five replicates. The linear expansion rate was calculated using the following equation:
Thickness expansion was measured using a steel caliper (MG Tool Company, NY, USA), and the measurement was repeated five times. The degree of thickness expansion was measured using the equation (Kawas & Moreira, 2001):
The microstructures of the snacks were visualized using scanning electron microscopy (SEM; JSM-6490LV; JEOL, Tokyo, Japan). Each sample was immersed in petroleum ether for 24 h and freeze-dried at the same time. A gold layer was then fixed on the samples using an ion sputter device (E-1010; Hitachi, Tokyo, Japan), and the upper surface of the sample was observed using SEM at an accelerating voltage of 15 kV.
The sensory evaluation was performed by 10 trained panels (gender: 5 females and 5 males, age: 21–26 years) using a 9-point hedonic rating scale (9 = excellent; 1 = extremely poor). Six sensory attributes for color, crispiness, oiliness, taste, aroma, and overall acceptance were evaluated and expressed as an average value.
An electronic tongue system (ASTREE II, Alpha MOS, Toulouse, France) with five sensors was used to investigate compounds related to the basic taste intensity and pattern of the sample sets. The five different sensors (SRS, STS, UMS, SWS, and BRS) corresponded to the five basic tastes (sourness, saltiness, umami, sweetness, and bitterness). Each ground sample (10 g) was dissolved in 100 mL of distilled water at 60°C for 10 min with mild agitation, and the extract was filtered through Whatman No. 1 filter paper (GE Healthcare, Little Chalfont, UK). Taste intensity was analyzed for 120 s using a dipping sensor. Taste responses from each sensor were calculated using relative scores ranging from 1 to 12. Each analysis was performed five times, and taste intensities were analyzed using principal component analysis (PCA), which performs a relative comparison among the tastes (Boo et al., 2020).
The volatile compounds in the samples were investigated using an electronic nose system (HERACLES Neo, Alpha MOS). Three grams of each ground sample in a headspace vial were stirred at 500 rpm at 50°C for 20 min to extract volatile compounds. Each 2,000 μL of volatile vapor was transferred to an injection port for gas chromatography analysis. The analytical column used was MXT-5 (HERACLES Neo) with an acquisition time of 230 s, trap absorption temperature of 20°C, and incubation at 50°C for 10 min. Volatile compounds were identified using AroChemBase (Alpha MOS) based on the retention index with Kovat’s index library and retention time. All analyses were performed five times. The discriminant patterns of volatile compounds in the samples were investigated using PCA (Boo et al., 2020).
The results are expressed as the mean ± SD. All statistical analyses were performed using one-way analysis of variance followed by Duncan’s test using the statistical software SPSS (version 22.0; IBM, Armonk, NY, USA). Differences were considered statistically significant at p < 0.05.
Results and Discussion
To evaluate the fundamental specifications of the frozen surimi used in fish snacks, the proximate composition was determined (Table 2). The protein content is considered an important indicator of gel formation (Wei et al., 2018). A significantly higher protein content was observed in AP surimi (17.1%–18.2%) compared with that in TB surimi (14.2%–15.3%), consistent with the results of a previous study (Majumder et al., 2017). The moisture content of all the surimi ranged from 73.8% to 76.9%.
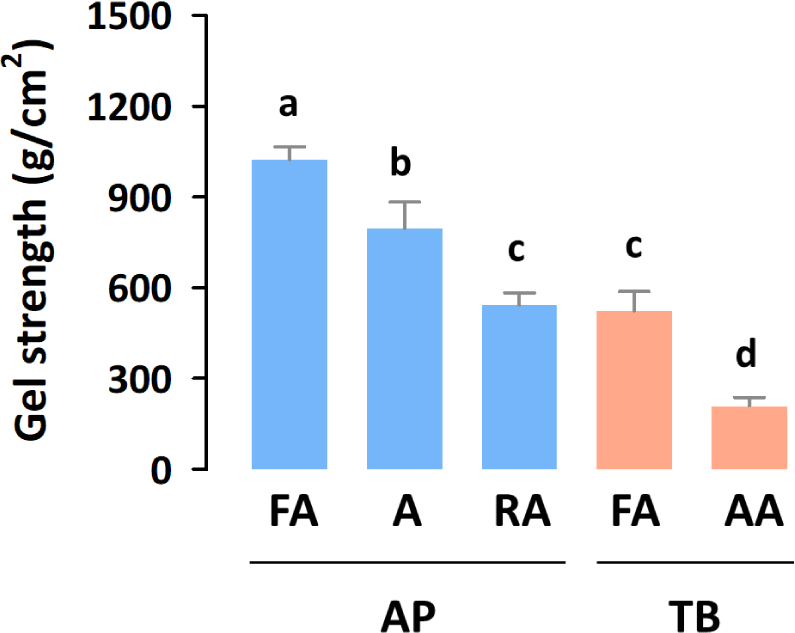
Gel strength, which affects gel formation in foods, such as imitation crab sticks, is the primary determinant of surimi quality (Campo-Deaño et al., 2009). Therefore, gel strength determines surimi grades, such as SA, FA, A, and RA (Velazquez et al., 2008). AP and TB surimi are the most widely used surimi worldwide because of their suitable processing properties, such as their high gel-formation ability (Boziaris, 2014). As shown in Fig. 1, AP (542–1,023 g/cm2) showed a higher gel strength than TB (209–524 g/cm2) did, which is due to the higher protein content of AP compared with that of TB (Wangtueai & Noomhorm, 2009). Within both AP and TB surimi, the gel strength increased as their grade increased, which is consistent with a previous study (Heu et al., 2010).
For the preparation of fried fish snacks, there are two important processes: drying the surimi mixture with ingredients and frying the dried intermediate products (Kaewmanee et al., 2015). The moisture content of dried intermediate products significantly influences the physicochemical and sensory properties of fried fish snacks (van der Sman & Broeze, 2013). In industrial production, the drying rate determines the production cost and efficiency (Huang & Zhang, 2012). Therefore, it is important to investigate the drying behavior of surimi mixtures for the manufacture of fish snacks.
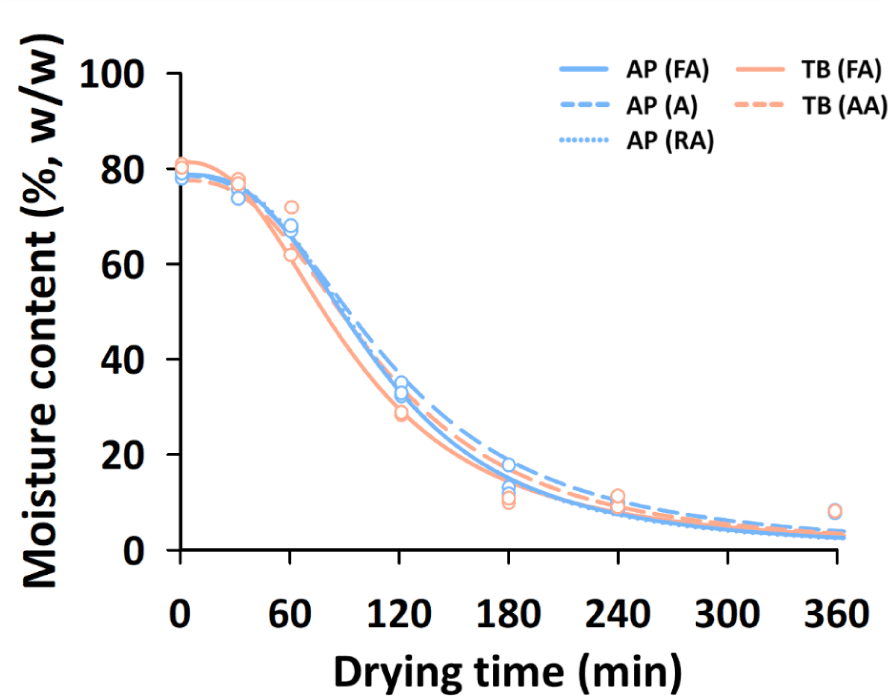
Fig. 2 shows the changes in the moisture content (%, w/w) of the different surimi mixtures according to the drying time. The drying curves of all the samples showed a similar pattern, and the determination coefficients of the drying curve equation were over 0.9 (data not shown). This pattern of drying behavior of the surimi mixtures with a moisture content of about 76.3%–81.2% was also observed in the drying of high-moisture foods (Giner, 2009). The drying rate increased from 30 min to 120 min and decreased after 120 min. After 240 min of hot-air drying, the moisture content of all surimi samples was in the range of 8.3%–10.9%, indicating that drying was almost complete, as revealed in a previous report (Kaewmanee et al., 2015). In our previous study, the optimal conditions for the texture and overall acceptance of surimi snacks were found to be in the 10% moisture content range (Kim et al., 2019). In this study, the same amount of moisture was added to prepare the surimi mixture. However, it was necessary to determine the additional moisture content according to the quality characteristics and types of fish snacks.
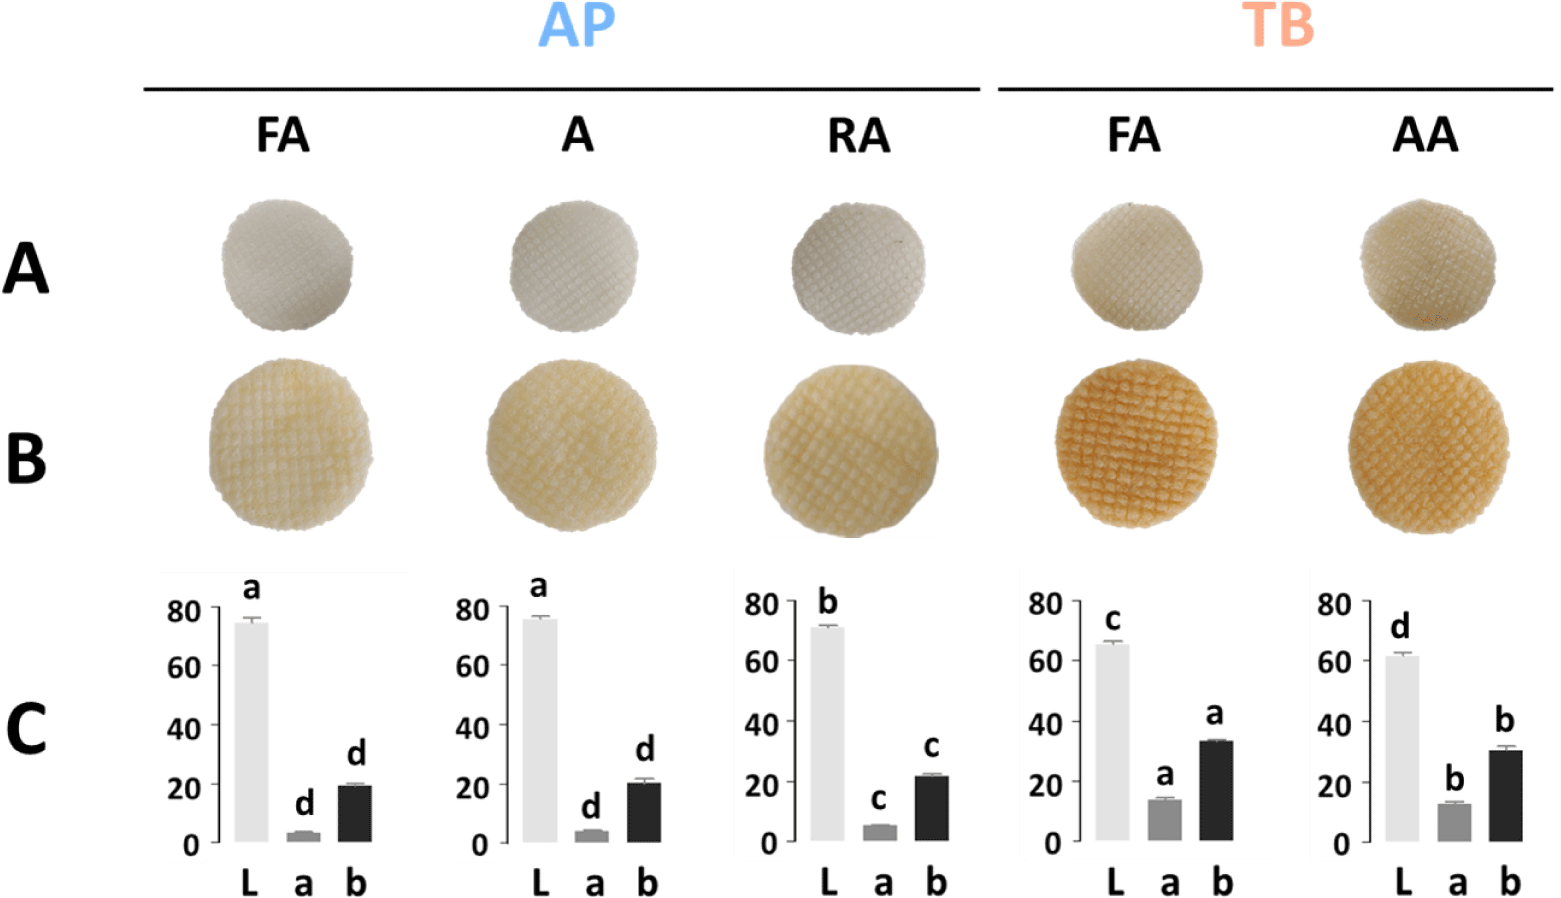
The appearance of snack products is closely related to sensory preferences; therefore, it is important to examine the snack color (Ahza et al., 2015). Fig. 3A and 3B show the appearance of the dried intermediate products and fried fish snacks, respectively. Both the dried and fried samples were affected by the color of the raw material of the frozen surimi. Fish snacks made from AP surimi with high whiteness showed a relatively light brown color and high L values (Fig. 3C). Among the fish snacks of AP surimi, the RA grade had a significantly lower L value than those of the FA and A grades because it contained recovery fish. Generally, RA is one of the lowest grades of surimi and has many impurities and low whiteness (Ahn et al., 2019). TB fish snacks had significantly lower L values and higher a and b values than AP fish snacks did, consistent with a darker brown appearance. All the commercial frozen surimi, except for TB surimi that contained only 6% sucrose without sorbitol, contained cryoprotectants, including sucrose, sorbitol, and their blend (Fahrizal et al., 2018). The browning of sugar during frying at high temperatures caused by heat affects the snack color (Onipe et al., 2018). Hence, it is critical to consider the fish species, types, and contents of cryoprotectants to produce fried fish snacks of desirable colors.
Hardness is an important physical property affecting the texture of fried snacks (Ramesh et al., 2018). Generally, hardness is negatively correlated with crispiness (Norizzah et al., 2016; Nurul et al., 2009; Ramesh et al., 2018). Fish snacks made from AP surimi showed significantly higher hardness than those made from TB (Fig. 4A). In addition, we evaluated the correlation between the hardness of the fried snacks and the gel-forming ability of the surimi (Fig. 4E). Gel strength and hardness showed a high correlation with a linear regression coefficient (R2) of 0.9124, suggesting that the gel strength of surimi affects the hardness of fish snacks. This result shows that it is not necessary to use expensive high-grade surimi to manufacture crispy-fried surimi snacks.
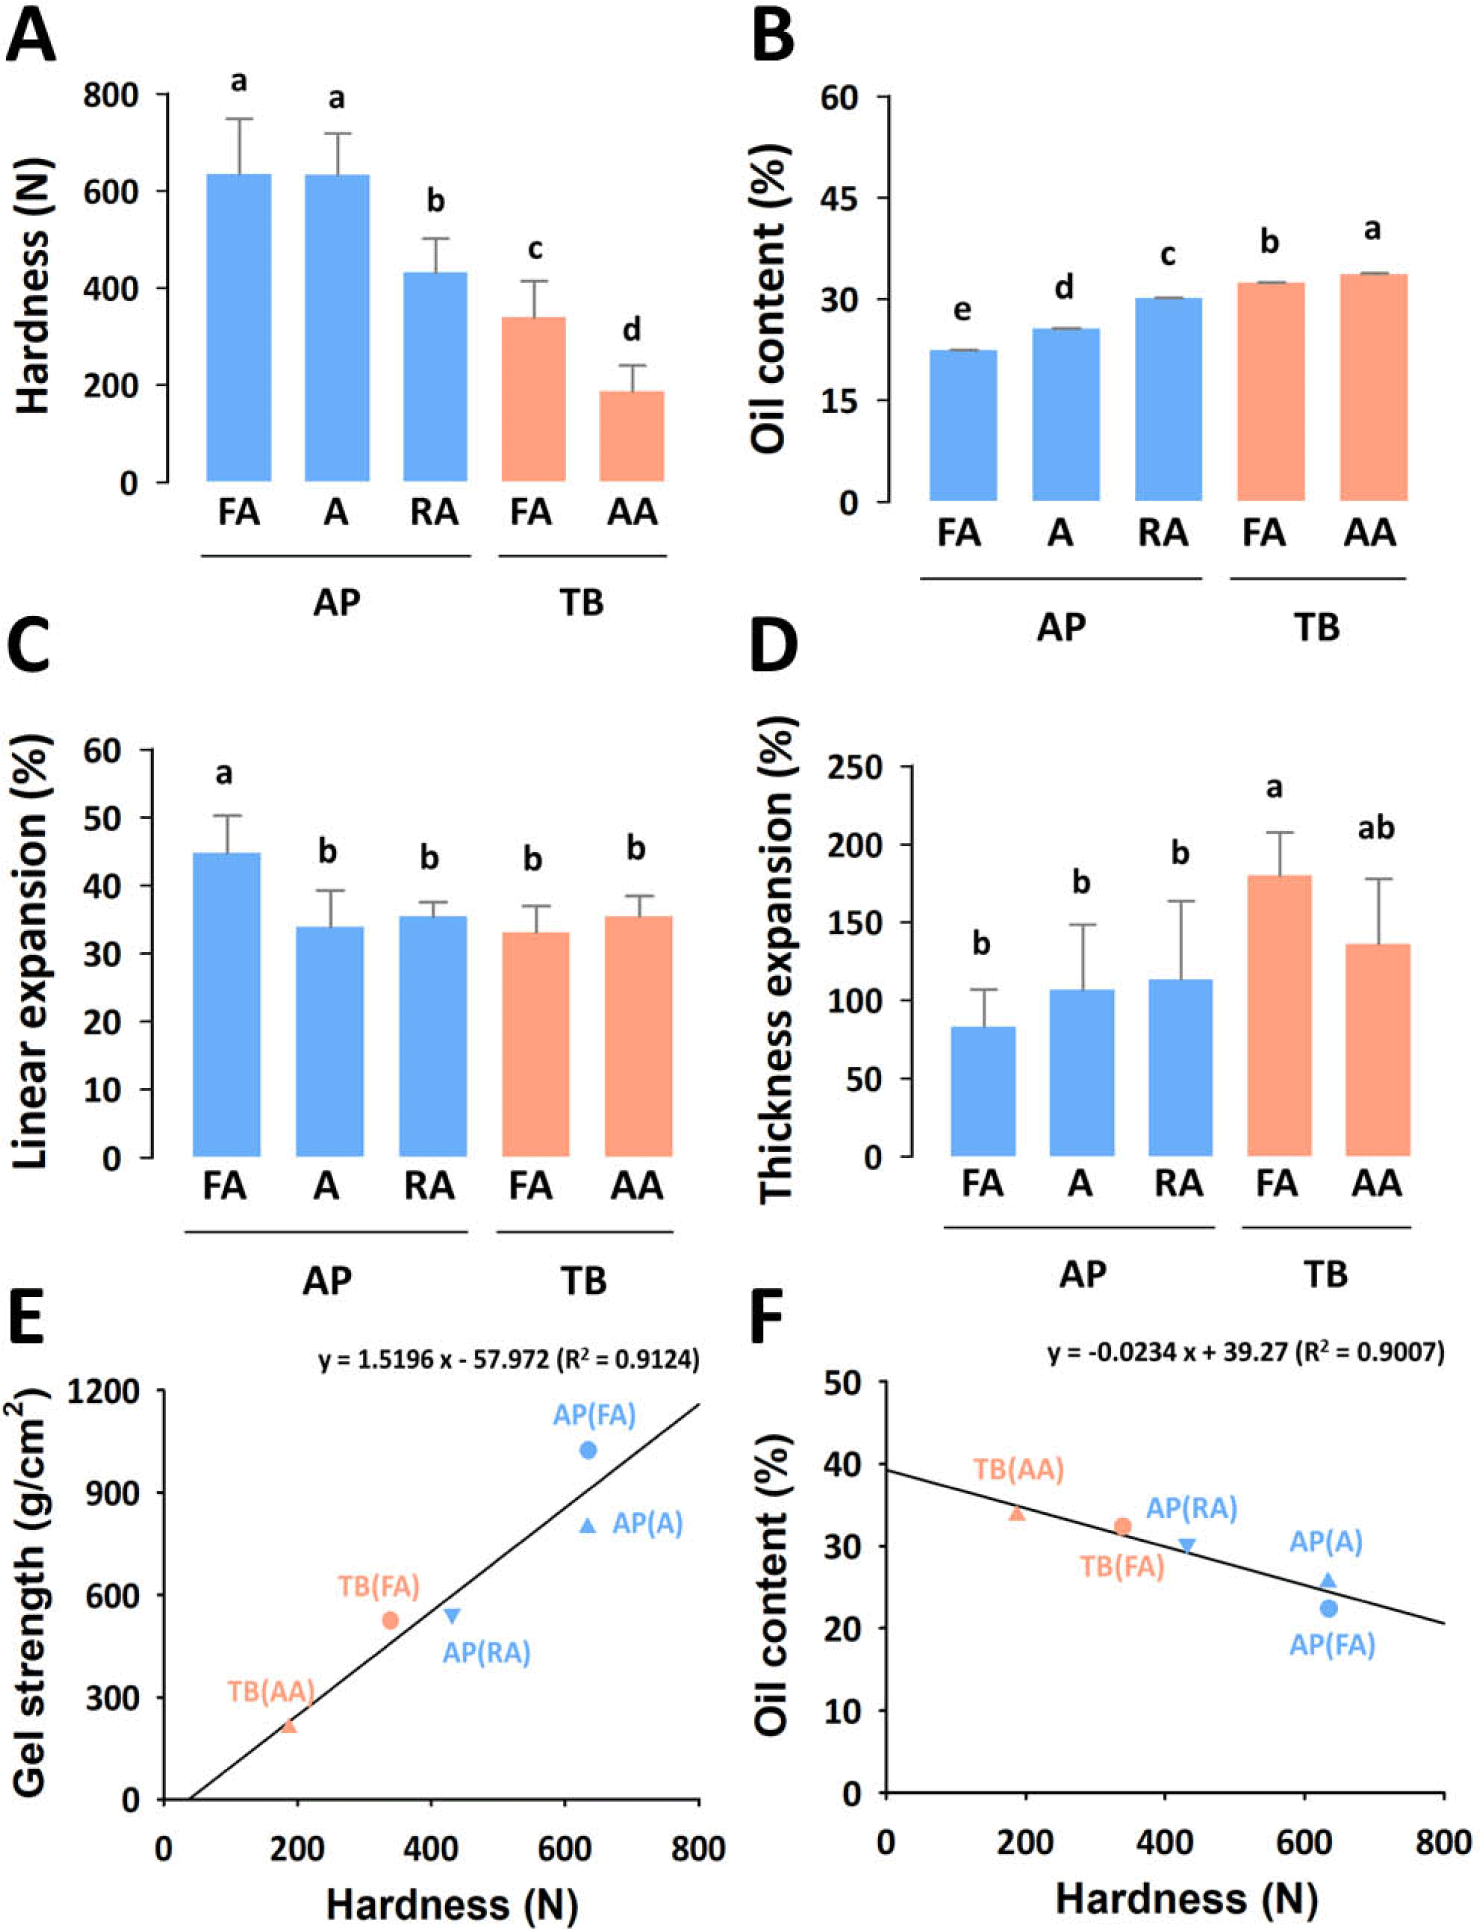
The oil content of fried fish snacks is an important quality indicator, and there has been a trend of reduced oil intake for health in recent years (Arslan et al., 2018). As shown in Fig. 4B, the oil content of all fish snacks ranged between 22%–33%, which was comparable to that reported in another study (Kaewmanee et al., 2015). TB fish snacks had a significantly higher oil content than AP did, which is related to the pores inside the snack. The greater the expansion, the higher the surface area; hence, more oil was trapped in the surface layer of the larger air cells (Noorakmar et al., 2012). As shown in Fig. 4F, hardness was negatively correlated with the oil content, with a correlation coefficient of 0.9007. According to a previous study, fish snacks that absorbed more oil had a lower hardness (Nurul et al., 2009). In the industrial production of fried fish snacks, an appropriate de-oiling process, such as centrifugation, can be adopted to reduce the oil content.
The expansion of the fried snack is an important factor that affects texture. The linear expansion of fish snacks is shown in Fig. 4C (Ramesh et al., 2018; Yamsaengsung et al., 2011). The snack made from the FA grade AP surimi showed the highest linear expansion, whereas the other samples showed no significant difference in expansion. The thickness expansion of fried fish snacks is shown in Fig. 4D. TB fish snacks showed a significantly higher thickness expansion value than AP fish snacks did. Thickness expansion had an inverse correlation with hardness and was positively related to crispiness (Veronica et al., 2006).
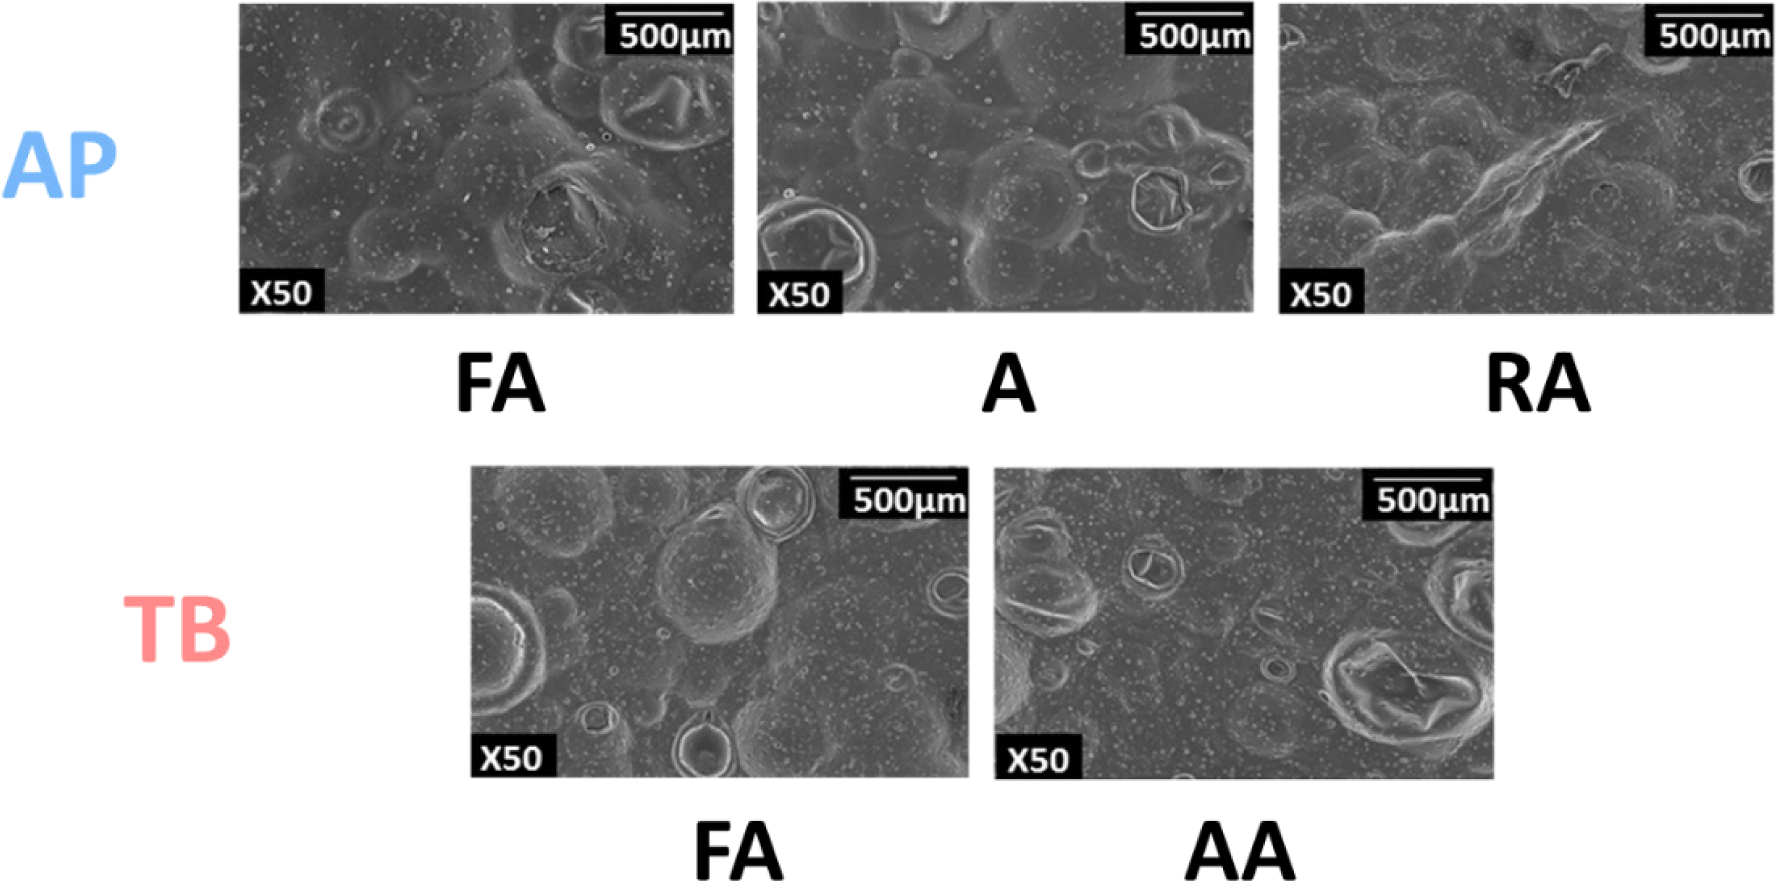
The micrograph image, which is closely related to texture, was obtained using SEM to further understand the physical properties of the fish snacks (Ahza et al., 2015). As shown in Fig. 5, the fish snacks of TB surimi had more blisters than those of AP. A previous study indicated that lower hardness resulted in more blistering, which is consistent with the lower hardness value of TB than that of AP (Fig. 4A) (Chae et al., 2019). In addition, the particles swell larger during frying as the hardness decreases, which causes an increase in crispiness (Surojanametakul et al., 2020; van Koerten et al., 2015). Several factors, such as hardness, expansion, and oil content, affect the cell content and size of blisters in the SEM microstructure (Guillermic et al., 2021).
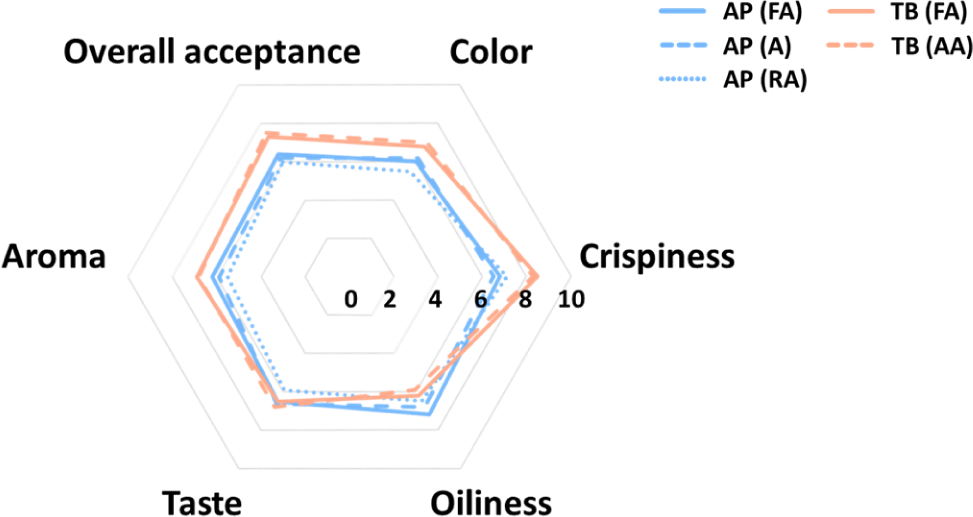
The sensory evaluation of the fried fish snacks is shown in Fig. 6. Regarding color, TB scored higher than AP overall, and it seemed that high brownness affected high sensory preference. This was previously found to be due to the raw material of surimi being made from different recovery fish with low whiteness (Ahn et al., 2019). Moreover, the browning reaction caused by the Maillard reaction is accelerated in TB. For samples other than TB, it is necessary to induce browning by adding more sugar or increasing the frying temperature or time to increase the color preference (Onipe et al., 2018). For crispiness, TB had a higher preference than AP because the low hardness value of TB increased crispiness (Nurul et al., 2009). Regarding oiliness, AP scored higher than TB, and this was influenced by the lower oil content in AP. There was no significant difference between taste and aroma in all snacks, but TB had slightly higher values than AP did. This was because more flavors were produced owing to the Maillard reaction, which is supported by the electronic nose results. In terms of overall acceptance, TB scored higher than AP due to the higher preference for crispiness, color, taste, and aroma. This result indicated that TB showed a superior preference overall compared to AP, so it is considered suitable as a snack material.
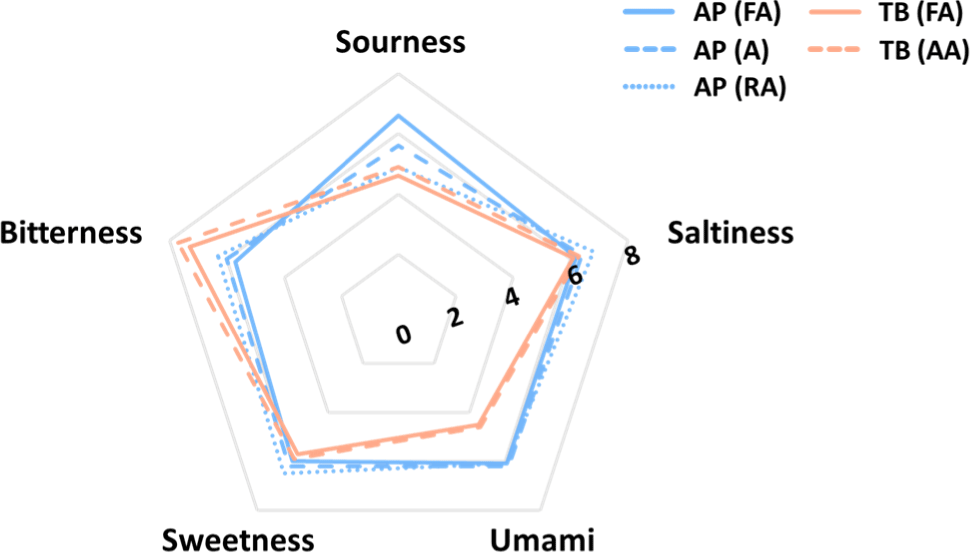
The e-tongue system was used to determine the taste components of the samples, and the results are shown in Fig. 7. Five basic taste intensities were compared using an electronic tongue system. TB and AP showed different taste patterns, whereas they showed similar patterns among the surimi grades of the same species. In terms of sour taste intensity, AP (FA) samples showed the highest strength (6.6), whereas TB (FA) samples showed the lowest (4.6). Sourness is recognized by the dissociation of hydrogen ions in food (Da Conceicao Neta et al., 2007). In terms of saltiness, there was no significant difference between samples; the highest intensity (6.8) was found in AP (RA) samples and the lowest (6.1) in TB (FA) samples. Umami taste showed the highest intensity (6.2) in AP (A) samples and the lowest (4.5) in TB (FA) samples. Depending on the species, AP was significantly higher in umami intensity than TB. Umami is one of the tastes used in the expression of “taste enhancer”, and related compounds are known to be associated with amino acids, peptides, and nucleotides (Wang et al., 2020). Sweetness is the taste most closely related with our daily dietary intake, and is mainly perceived when eating foods rich in carbohydrates, sugar alcohols, and amino acids (Belloir et al., 2017). There was no significant difference in sweetness between the samples. Bitterness was higher in TB than that in AP; among all the samples, TB (AA) had the highest bitterness intensity (7.7) and AP (FA) had the lowest (5.7). The Maillard reaction is responsible for the development of a bitter taste, which is why TB has a stronger bitter taste than AP does (Frank et al., 2003). The overall taste intensity was high in the AP group and relatively low in the TB group.
The samples were analyzed using an electronic nose system to determine their volatile components, and the results are listed in Table 3. The electronic nose system identified 29 compounds in the five samples. Among the 29 volatile components, perfluorohexanes, 5-methyl-4-nonene, 2-ethyl-3,6-dimethylpyrazine, acetaldehyde, methyl formate, propanoic acid, pentan-2-one, and terbacil were the main volatile components. Notably, the 2-ethyl-3,6-dimethylpyrazine content was the highest in the tested samples, except for samples that were odorless in the sensory description. 2-Ethyl-3,6-dimethylpyrazine gives food burnt, cocoa, earthy, musty, nutty, potato, pungent, and roast flavors and is known to be produced in the non-enzymatic browning reaction generated by the Maillard reaction (Cui et al., 2022). TB, which was shown to generate a lot of heated aroma due to the more active Maillard reaction, had more aroma components than AP. In the AP sample group, AP (FA) was found to have a relatively low volatile content compared with that of AP (A) and AP (RA). In the TB group, TB (FA) had a relatively lower volatile content than TB (AA) did. This suggests that the lower the surimi grade, the more flavorful is the fish snack product.
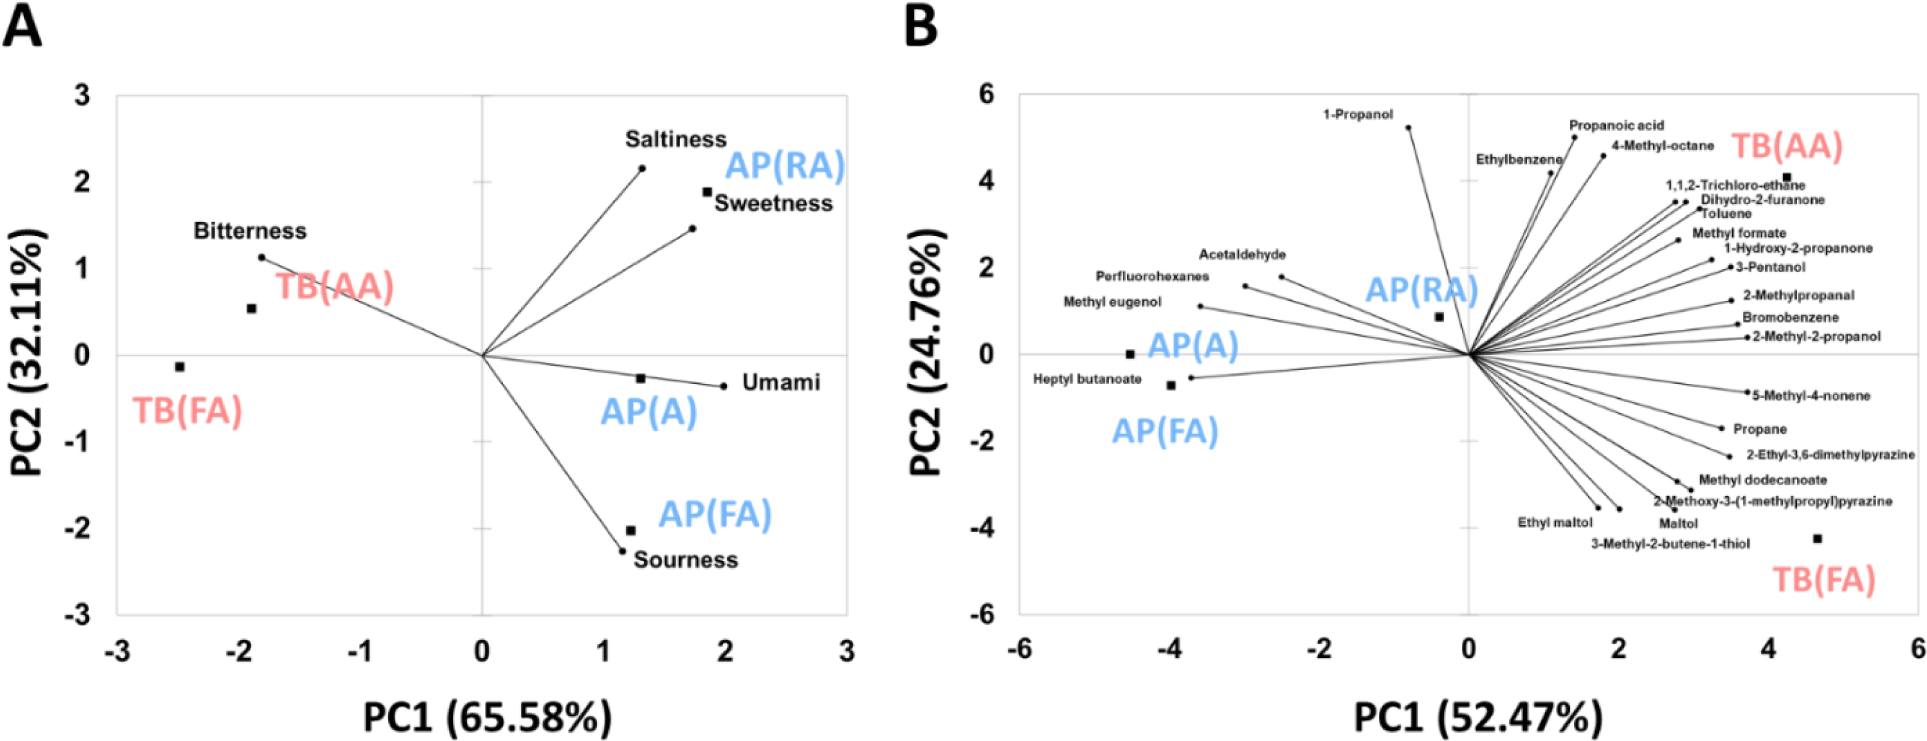
Comparison patterns using PCA of taste intensities, determined using the e-tongue, and volatile components, determined using the e-nose, are shown in Fig. 8A and 8B, respectively. In Fig. 8A, the bi-plot created using PCA for the taste components showed 65.58% variance in PC1 and 32.11% variance in PC2. The PCA plot for taste components showed a higher separation than the volatile PCA plot in Fig. 8B. In the correlation between the five basic tastes and samples, the TB (AA) and TB (FA) samples were shown to be correlated with bitterness. The AP (RA) samples were correlated with saltiness and sweetness, and the AP (FA) samples were correlated with sourness. In addition, the AP (A) samples were correlated with umami. Through PCA pattern analysis and multivariate analysis, the patterns of volatile compounds and taste components in each sample were successfully segregated. However, almost no difference was observed between the taste and aroma samples in the sensory evaluation. The electronic nose and tongue cannot correspond to the complicated and delicate human olfactory receptor system but can present objective information about the taste patterns of each sample (Lee et al., 2019). Fig. 8B shows a variance of 52.47% for PC1 and 24.76% for PC2. The AP (FA) and AP (A) samples were highly correlated with heptyl butanoate, methyl eugenol, perfluorohexanes, and acetaldehyde. In contrast, AP (RA) samples were found to be relatively less correlated with volatile compounds. TB (FA) and TB (AA) samples contained more volatile compounds, which were negatively correlated with AP (A) and AP (FA) samples. TB (FA) is highly correlated with 3-methyl-2-butene-1-thiol, methyldodecanoate, and 2-methoxy-3-(1-methylpropyl) pyrazine. TB (AA) was highly correlated with dihydro-2-furanone and 1,1,2-trichloro-ethane, which give foods sweet, caramelized, and pleasant scents.
Conclusion
Surimi, which has a gel-forming ability, has been used as the main ingredient in gelling foods. However, in non-gelling foods, such as snacks, gel strength, which determines the quality properties of surimi, was not an absolute factor based on the results of this study. Our study indicates that TB has lower gel strength than AP, but much higher values in terms of texture profile, including crispiness and sensory properties, including snack flavors. These results indicate that low-cost fish are valuable materials for fish snacks in terms of cost-effectiveness. Additional research is needed to optimize the drying, frying, and de-oiling processes to produce surimi snacks with specific crispiness and hardness.


