RESEARCH ARTICLE

Determining the optimal range of vitamin C for early red drum (Sciaenops ocellatus) juveniles

Nguyen Thi Thuy1, Khuong V. Dinh1,*https://orcid.org/0000-0003-0766-9148, Ngo Van Manh1, Trung Si Trang1
Author Information & Copyright
1Cam Ranh Centre for Tropical Marine Research and Aquaculture, Institute of Aquaculture, Nha Trang University, Nha Trang City 65000, Vietnam
*Corresponding author: Khuong V. Dinh, Cam Ranh Centre for Tropical Marine Research and Aquaculture, Institute of Aquaculture, Nha Trang University, Nha Trang City 65000, Vietnam, Tel: +84-909-743-745, E-mail:van.k.dinh@ibv.uio.no

Copyright © 2023 The Korean Society of Fisheries and Aquatic Science. This is an Open Access article distributed under the terms of the Creative Commons Attribution Non-Commercial License (http://creativecommons.org/licenses/by-nc/4.0/) which permits unrestricted non-commercial use, distribution, and reproduction in any medium, provided the original work is properly cited.

Received: May 10, 2023; Revised: Jun 04, 2023; Accepted: Jun 23, 2023

Published Online: Sep 30, 2023

Abstract

Vitamin C plays an important role for fish survival, growth and disease resistance. However, the optimal vitamin C for rearing red drum Sciaenops ocellatus juveniles in Vietnam is not known. To address this issue, a 70-day feeding trial was conducted to evaluate the optimal dietary vitamin C requirements for red drum juveniles. Seven isonitrogenous (55.35% protein) and isolipidic (9.07% lipid) diets were formulated to include graded vitamin C concentrations of 23.2, 124.5, 235.2, 423.8, 626.7, 824.6, and 1,027.3 mg/kg, respectively. The results showed that fish fed on 423.8 mg/kg vitamin C diet had the highest growth rate, which can be linked to the increased feed utilization. Broken-line analysis indicated that the optimal dietary vitamin C requirements of red drum juveniles were 342.92 and 405.80 mg/kg for growth parameters, feed utilization, body composition and biochemical parameters of serum. Based on these parameters the optimal vitamin C supplementation level for red drum juveniles was estimated in the range of 342.92–405.80 mg/kg vitamin C in the diets with direct applications in producing artificial feed for rearing juveniles of this species in Vietnam.

Keywords: red drum; Sciaenops ocellatus; vitamin C; growth; body composition

Introduction

Vitamin C is a water‐soluble micronutrient essential for normal physiological functions, and immune and stress responses, thereby being integral to growth rate and survival of aquaculture fish (Dawood & Koshio, 2018; Le et al., 2021). Vitamin C plays multiple roles in fish such as collagen synthesis, iron absorption, immune response, wound healing, and proximate body composition of the fish (Darias et al., 2011; Dawood & Koshio, 2018; Padayatty & Levine, 2001). However, fish have to acquire vitamin C from food as they cannot synthesize it (Dawood & Koshio, 2018; Fracalossi et al., 2001). Fish that do not acquire enough vitamin C show various symptoms of disorders such as malformations, immunodepression, reduced growth, increased susceptibility to diseases, and increased mortality (Dawood & Koshio, 2018; Le et al., 2021).

The red drum (Sciaenops ocellatus) has been a valuable seafood and recreational fishery resource throughout its natural range for over 20 years. This species has become a popular farmed species in the United States and Asia, particularly in Vietnam due to its high tolerance to the environmental condition, large size, high meat yield, nutritious meat, and high market price (Yen et al., 2021). The nutritional requirements of S. ocellatus have been studied extensively in recent years, particularly the protein levels (Watson et al., 2020), lipid (González-Félix et al., 2018); vitamin E (Peng & Gatlin, 2009); inorganic and organic dietary copper (Chen et al., 2020). A previous study has found that a minimum vitamin C level of 15 ± 3 mg/kg in their diet is required for the growth and normal activities of red drum juveniles with an initial body weight (BW) of ~3.6 g (Aguirre, 1999). However, the optimal vitamin C levels for growth and fish health are currently unknown. Therefore, this study aimed to assess the general effects of vitamin C on the growth, body composition, and biochemical parameters of red drum juveniles.

Materials and Methods

Ethics statement

The red drum (S. ocellatus) is not on the list of endangered, precious, and rare species of wild plants and animals, in the National Regulations for the Use of Animals in Research in Vietnam: The Law of Animal Husbandry of Vietnam, 2018 and The Government Decree 32/2006/ND-CP. Therefore, ethical approval requirements for conducting experiments with this species are not required in Vietnam. However, the authors have implemented their best practice following the guidelines of using animals in research based on EU directive 2010/63.

Experimental animals

Red drum (S. ocellatus) juveniles were bred at Cam Ranh Centre for Tropical Marine Research and Aquaculture, Institute of Aquaculture, Nha Trang University, Vietnam. Before the experiment, we acclimatized fish juveniles (size: BW = 1.82 ± 0.40 g and total length = 5.75 ± 0.41 cm) to laboratory conditions for 14 days, which was similar to our previous study (Le et al., 2021). Ten juveniles were assigned to a rectangular fiberglass tank (length × weight × height = 0.8 × 0.5 × 0.5 m, a total of 21 tanks filled with pre-filtered 200 L seawater). During the acclimation period, fish were fed a commercial diet (~5% BW; INVE, Wachirabarami, Thailand), two times a day at around 08:00 and 17:00. The rearing conditions such as temperature, salinity and pH were kept at 29 ± 0.5°C, 29 ± 3.1 ppt and 7.6–7.8, respectively. Ammonia was lower than 0.05 mg/L, and dissolved oxygen was maintained above 6.0 mg/L by continuous aerations in each tank.

Experimental treatments

The basal diet (crude protein: 55%, lipid: 9%) was formulated according to the marine finfish feed requirement and feed content illustrated in Table 1. Ascorbic acid (vitamin C) powder (Acid Ascorbic Vitamin C 99%-E300 DSM, Shandong Luwei Pharmacy, Shandong, China) was added to the base diet in different amounts to obtain 7 experimental treatments: control (no vitamin C supplement to the artificial feed), 100, 200, 400, 600, 800 and 1,000 mg vitamin C equivalent/kg diet (3 replicates each treatment). We used reverse-phase high-performance liquid chromatography to analyze the ascorbic acid levels. Table 1 shows detailed information about the experimental diets after the addition of vitamin C. The experimental diets were kept cold in a refrigerator at 4°C. During the experimental period, the rearing system, water conditions and feeding levels were kept consistent with their values during the acclimation period. Tanks were cleaned every two weeks and each time was concurrent with when fish were removed and weighed. The feeding trial lasted for 10 weeks.

Table 1. Formulation and proximate composition of the experimental diets (dry matter basis, %) and vitamin C level (mg/kg)
Ingredients No vitamin C supplement 100 mg vitamin C 200 mg vitamin C 400 mg vitamin C 600 mg vitamin C 800 mg vitamin C 1, 000 mg vitamin C
Fishmeal (%) 64.44 64.44 64.44 64.44 64.44 64.44 64.44
Soybean meal (%) 7 7 7 7 7 7 7
Wheat gluten (%) 3 3 3 3 3 3 3
Rice bran (%) 3 3 3 3 3 3 3
Squid meal (%) 11 11 11 11 11 11 11
Corn gluten meal (%) 2 2 2 2 2 2 2
Wheat flour (%) 3 3 3 3 3 3 3
Fishoil (%) 1.5 1.5 1.5 1.5 1.5 1.5 1.5
Soybean oil (%) 1.36 1.36 1.36 1.36 1.36 1.36 1.36
Lecithin (%) 1 1 1 1 1 1 1
Vitamin–mineral premix (%) 1.1 1.1 1.1 1.1 1.1 1.1 1.1
Polymethylcarbamide (%) 0.5 0.5 0.5 0.5 0.5 0.5 0.5
Mono-cal (%) 0.03 0.03 0.03 0.03 0.03 0.03 0.03
Limestone/oyster shell (%) 1 1 1 1 1 1 1
Lysine (%) 0.05 0.05 0.05 0.05 0.05 0.05 0.05
Methionine (%) 0.02 0.02 0.02 0.02 0.02 0.02 0.02
Vitamin C supplement (mg/kg) 0 100 200 400 600 800 1,000
Proximate compositions
 Crude protein (%) 55.35 ± 0.13 55.28 ± 0.03 55.32 ± 0.04 55.38 ± 0.02 55.33 ± 0.05 55.37 ± 0.07 55.41 ± 0.08
 Crude lipid (%) 9.01 ± 0.07 9.05 ± 0.02 9.06 ± 0.03 9.07 ± 0.03 9.08 ± 0.06 9.11 ± 0.05 9.14 ± 0.07
 Moisture (%) 10.11 ± 0.05 10.84 ± 0.03 10.85 ± 0.04 10.53 ± 0.03 10.57 ± 0.05 10.59 ± 0.06 10.61 ± 0.08
 Ash (%) 12.58 ± 0.10 12.16 ± 0.07 12.15 ± 0.08 12.06 ± 0.03 12.08 ± 0.07 12.11 ± 0.05 12.15 ± 0.06
 Vitamin C (mg/kg) 23.2 124.5 235.2 423.8 626.7 824.6 1,027.3
Download Excel Table
Sample collections

On day 70 (the termination of the experiment), we collected a subset of 3 individuals/tank (9 individuals per treatment). We determined growth, body indices, hematological parameters including white blood cells (WBC), red blood cells (RBC), hematocrit, haemoglobin and proximate composition. Fish were first anesthetized with monophenyl ether glycol solution at a concentration of 150–200 ppm. Subsequently, we collected the blood samples from caudal veins using a 1-mL syringe. Lysozyme activity and hematological parameters in the blood samples were determined (see more details in Appendix 1). Afterwards, the BW was determined using a laboratory scale within a range 0–200 g and an accuracy of 0.01 g. We determined growth parameters including the specific growth rate (SGR, %/day) based on the natural logarithm (Ln) of final weight (LnWt) and initial weight (LnWi) during the experimental period (t, day) as 100 × (LnWt – LnWi) / t. To better understand the relationship between SGR and feed utilization, feed conversation ratio (FCR) was determined by dividing the amount of feed consumed (g, dry weight) by the increase in fish weight (g, wet weight). The protein efficiency ratio (PER) was based on the weight gain (WG, g) per protein intake (g). Protein productive value (PPV) was calculated as the retained protein (g) of the consumed protein (g): PPV = (final protein content – initial protein content) × (protein consumed)–1.

In the next steps, the fish liver and visceral organs were collected. BW (g), liver (LW, g) and visceral weights (VW, g) were determined. Similarly, we determined hepatosomatic index (HSI, %) = LW / BW × 100, and the viscerosomatic index (VSI, %) = VW / BW × 100. The vitamin C concentrations in the liver and the body were measured (Appendix 1). Finally, the fish body was used to measure the proximate composition (Appendix 1).

Statistical analysis

We used one-way analyses of variance for analyzing the data, and followed by using Duncan’ multiple-range test to compare differences between dietary groups. The results are described as the mean ± SEM, and the significance level was set at p < 0.05. The optimum vitamin C concentrations were estimated by using broken‐line polynomial regression analysis. All statistical analyses were performed by using SPSS 22.0 (SPSS, Armonk, NY, USA).

Results

Survival, specific growth rate (SGR), feed utilization, and organ indies

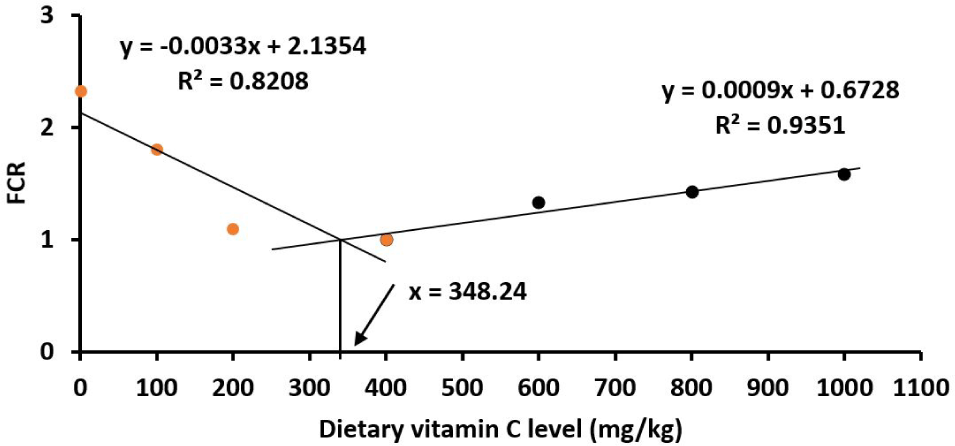
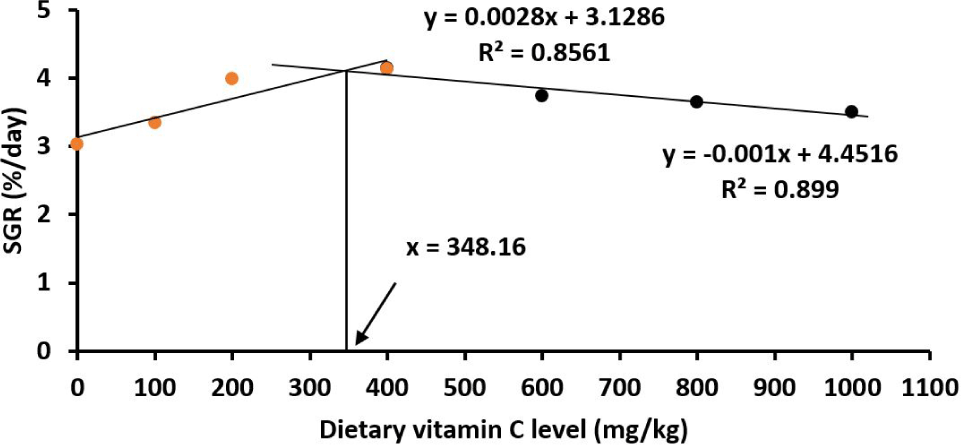
All fish survived to the end of the experiment. All the measured parameters including SGR, FCR, PER, PPV, HSI and VSI red drum juveniles were significantly affected by vitamin C (p < 0.05; Table 2). Juveniles showed an increase in WG and SGR when increasing the vitamin C levels in the diets from the basal (23.2 mg vitamin C/kg diet) to reach the highest growth at 400 mg vitamin C/kg diet, then the growth rate was steadily reduced when the vitamin C levels increased further to 600–1,000 mg/kg (p < 0.05). The patterns of PER and PPV resemble the similar pattern of the growth parameters (Table 2). Similarly, the FCR of fish juveniles was lowest at the vitamin C level of 400 mg/kg (Table 2). It was estimated by the broken‐line polynomial regression analysis that the optimal vitamin C levels were 345.88 mg/kg for WG (Fig. 1); 343.36 mg/kg for PER (Fig. 2); 348.24 mg/kg for FCR (Fig. 3) and 348.16 mg/kg SGR (Fig. 4). HSI and VSI values were not significantly different among diets (p > 0.05; Table 2).

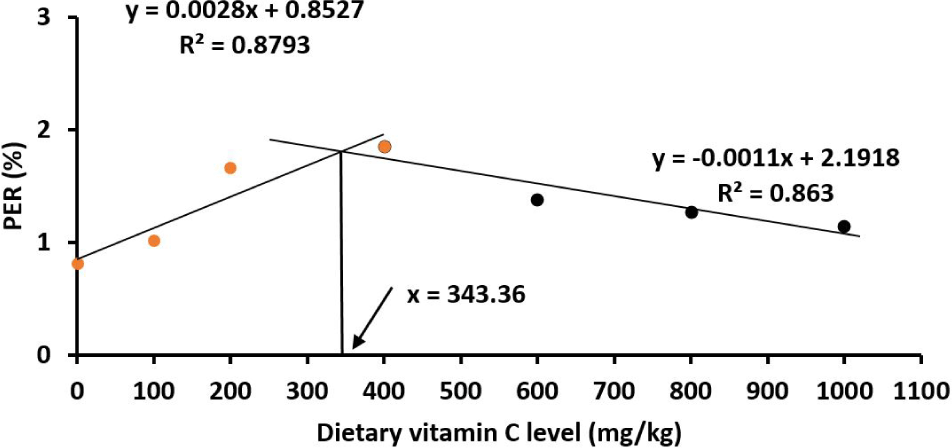
Table 2. The growth performance, feed utilization, survival and organ indices of juvenile red drum Sciaenops ocellatus fed different dietary vitamin C diets for 70 days
Parameters Vitamin C concentration (mg/kg)
0 100 200 400 600 800 1,000
IBW (g) 1.82 ± 0.40 1.82 ± 0.40 1.82 ± 0.40 1.82 ± 0.40 1.82 ± 0.40 1.82 ± 0.40 1.82 ± 0.40
FBW (g) 15.38 ± 0.82 18.88 ± 0.38 29.72 ± 0.31 32.96 ± 1.09 24.90 ± 0.54 23.17 ± 0.20 21.07 ± 0.19
GBW (g) 13.56 ± 0.82 17.06 ± 0.38 27.91 ± 0.31 31.14 ± 1.09 23.08 ± 0.54 21.35 ± 0.20 19.25 ± 0.19
WG (%) 235.84 ± 14.18 296.71 ± 6.66 485.31 ± 5.47 541.54 ± 18.95 401.45 ± 9.37 371.30 ± 3.55 334.78 ± 3.32
SGR (%/day) 3.03 ± 0.08a 3.34 ± 0.03b 3.99 ± 0.02c 4.13 ± 0.05g 3.74 ± 0.03f 3.64 ± 0.01e 3.50 ± 0.01d
HSI (%) 2.98 ± 0.40 2.92 ± 0.51 1.75 ± 0.22 1.78 ± 0.19 1.80 ± 0.20 1.86 ± 0.42 2.60 ± 0.32
VSI (%) 7.56 ± 1.03 7.46 ± 1.25 4.04 ± 0.30 4.35 ± 0.81 5.78 ± 0.42 4.95 ± 0.75 6.73 ± 0.75
PER (%) 0.81 ± 0.05 1.02 ± 0.02 1.66 ± 0.02 1.85 ± 0.06 1.37 ± 0.03 1.27 ± 0.01 1.15 ± 0.01
PPV 0.12 ± 0.00 0.25 ± 0.01 0.31 ± 0.00 0.31 ± 0.00 0.30 ± 0.00 0.30 ± 0.00 0.27 ± 0.01
FCR 2.33 ± 0.16 1.80 ± 0.04 1.09 ± 0.01 0.99 ± 0.04 1.33 ± 0.03 1.59 ± 0.01 1.43 ± 0.02
SR (%) 100 100 100 100 100 100 100

Values are means ± SE (n = 9).

a–g Values with different superscript letters within a row are significantly different (p < 0.05).

IBW, initial body weight; FBW, final body weight; GBW, gain body weight; WG, weight gain; SGR, specific growth rate; HSI, hepatosomatic index; VSI, viscerosomatic index; PER, protein efficiency ratio; PPV, Protein productive value; FCR, food conversion ratio; SR, survival rate.

Download Excel Table
fas-26-9-525-g1
Fig. 1. Broken‐line regression analysis between dietary vitamin C levels and weight gain in red drum (n = 9). The predicted requirement is 345.88 mg/kg.
Download Original Figure
fas-26-9-525-g2
Fig. 2. Broken‐line regression analysis between dietary vitamin C levels and PER in red drum (n = 9). The predicted requirement is 343.36 mg/kg. PER, protein efficiency ratio.
Download Original Figure
fas-26-9-525-g3
Fig. 3. Broken‐line regression analysis between dietary vitamin C levels and FCR in red drum (n = 9). The predicted requirement is 348.24 mg/kg. FCR, feed conversation ratio.
Download Original Figure
fas-26-9-525-g4
Fig. 4. Broken‐line regression analysis between dietary vitamin C levels and SGR in red drum (n = 9). The predicted requirement is 348.16 mg/kg. SGR, specific growth rate.
Download Original Figure
Body composition

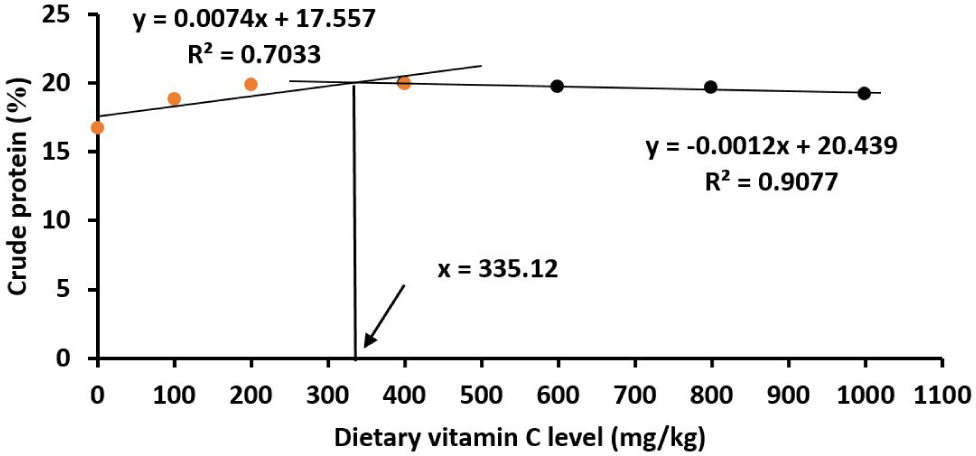
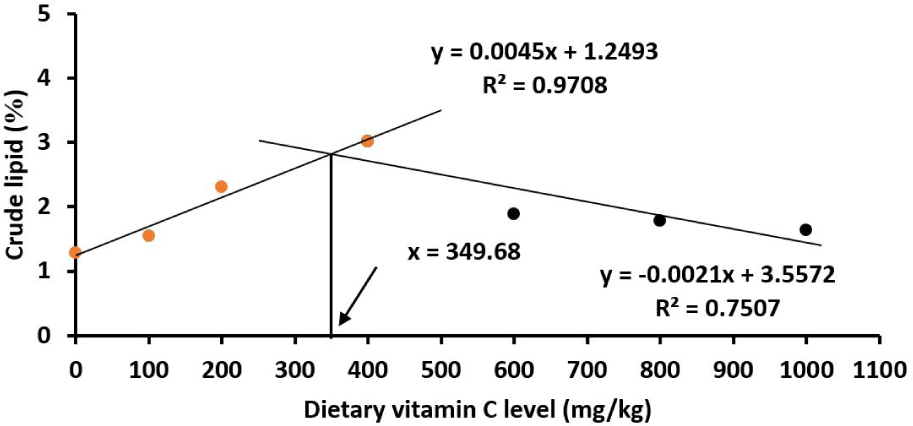
The data showed that the crude protein and lipid contents in the fish body were highest at the vitamin C level of 400 mg/kg diet (p < 0.05). Based on the broken‐line polynomial regression analysis, the optimal vitamin C levels were 335.12 mg/kg for crude protein (Fig. 5) and 349.68 mg/kg for lipid (Fig. 6). The moisture and ash contents were not affected by vitamin C in the diet as indicated by non-statistically significant differences of these two parameters in different vitamin C treatments (p > 0.05; Table 3).
fas-26-9-525-g5
Fig. 5. Broken‐line regression analysis between dietary vitamin C levels and crude protein in red drum (n = 9). The predicted requirement is 335.12 mg/kg.
Download Original Figure
fas-26-9-525-g6
Fig. 6. Broken‐line regression analysis between dietary vitamin C levels and crude lipid in red drum (n = 9). The predicted requirement is 349.68 mg/kg.
Download Original Figure
Table 3. The compositions of whole body and muscle in juvenile red drum Sciaenops ocellatus fed different dietary vitamin C diets for 70 days (g/kg wet weight)
Parameters Vitamin C concentration (mg/kg)
0 100 200 400 600 800 1,000
Protein (%) 16.73 ± 0.04a 18.83 ± 0.12d 19.89 ± 0.02d 19.95 ± 0.03d 19.71 ± 0.04b 19.65 ± 0.02d 19.20 ± 0.15c
Lipid (%) 1.29 ± 0.04abc 1.54 ± 0.01a 2.31 ± 0.07ab 3.01 ± 0.20bc 1.89 ± 0.04d 1.78 ± 0.02cd 1.64 ± 0.03ab
Ash (%) 4.34 ± 0.03a 4.50 ± 0.02e 4.68 ± 0.01bc 4.78 ± 0.01cd 4.92 ± 0.02d 5.03 ± 0.01cd 5.37 ± 0.07ab
Moisture (%) 74.20 ± 0.01d 74.39 ± 0.04c 74.55 ± 0.01a 74.70 ± 0.01a 74.76 ± 0.01b 75.00 ± 0.09b 75.61 ± 0.05a

Values are means ± SE.

a–d Values with different superscript letters within a row are significantly different (p < 0.05).

Download Excel Table

Similarly, juveniles had the highest body and liver vitamin C levels at 400 mg/kg vitamin C diet (p < 0.05; Table 4) with the estimated optimal vitamin C levels being 361.82 mg/kg in the liver (Fig. 7) and 342.92 mg/kg in the body (Fig. 8).
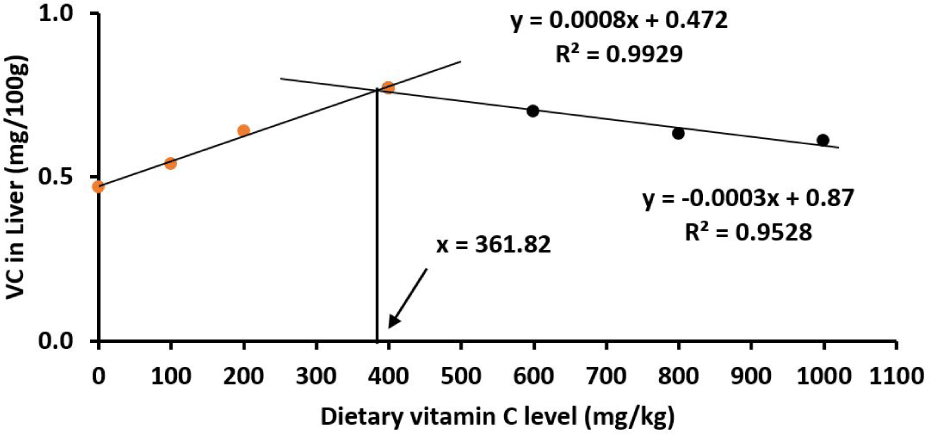
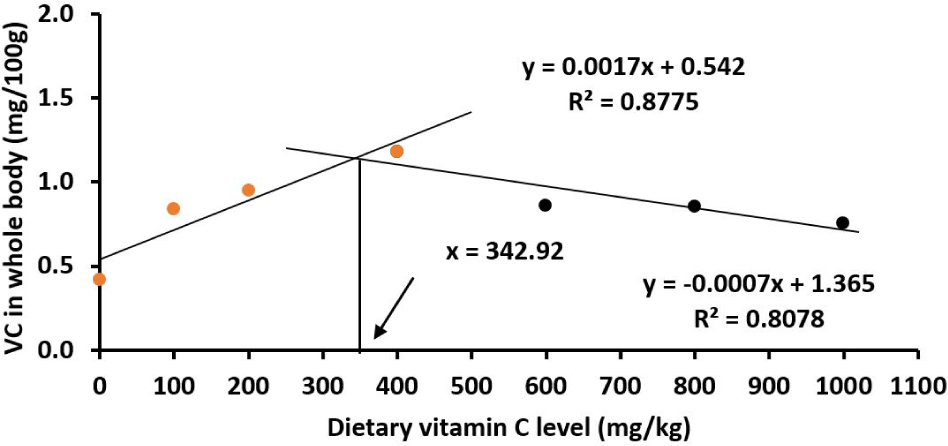
Table 4. Vitamin C on the liver and whole body of juvenile red drum Sciaenops ocellatus fed different dietary vitamin C diets for 70 days (g/kg wet weight)
Parameters Vitamin C concentration (mg/kg diet)
0 100 200 400 600 800 1,000
Vitamin C in liver (mg/100 g) 0.47 ± 0.03a 0.54 ± 0.02ab 0.64 ± 0.02cd 0.77 ± 0.03e 0.70 ± 0.01de 0.63 ± 0.01c 0.61 ± 0.02bc
Vitamin C in whole body (mg/100 g) 0.42 ± 0.02a 0.84 ± 0.07bc 0.95 ± 0.01c 1.18 ± 0.02d 0.86 ± 0.04bc 0.85 ± 0.04bc 0.75 ± 0.10b

Values are means ± SE (n = 9).

a–e Values with different superscript letters within a row are significantly different (p < 0.05).

Download Excel Table
fas-26-9-525-g7
Fig. 7. Broken‐line regression analysis between dietary VC levels and VC in liver in red drum (n = 9). The predicted requirement is 361.82 mg/kg. VC, vitamin C.
Download Original Figure
fas-26-9-525-g8
Fig. 8. Broken‐line regression analysis between dietary VC levels and VC in whole-body in red drum (n = 9). The predicted requirement is 342.92 mg/kg. VC, vitamin C.
Download Original Figure
Biochemical parameters of serum

The numbers of serum RBC and WBC numbers were significantly lower in control fish juveniles than in all other treatments (p < 0.05). For the number of serum RBC, it decreased when increasing vitamin C levels from 400 to 1,000 mg/kg diet (p < 0.05). The number of serum WBC was lowest in juveniles fed on the basal diet and increased to the highest at 400 mg/kg (p < 0.05; Table 5), then decreased gradually from 400 to 1,000 mg/kg (p < 0.05; Table 5). The optimum vitamin C requirements for red drum juveniles were 382.45 and 401.61 mg/kg based on the number of serum RBC content (Fig. 9) and WBC content (Fig. 10), respectively.
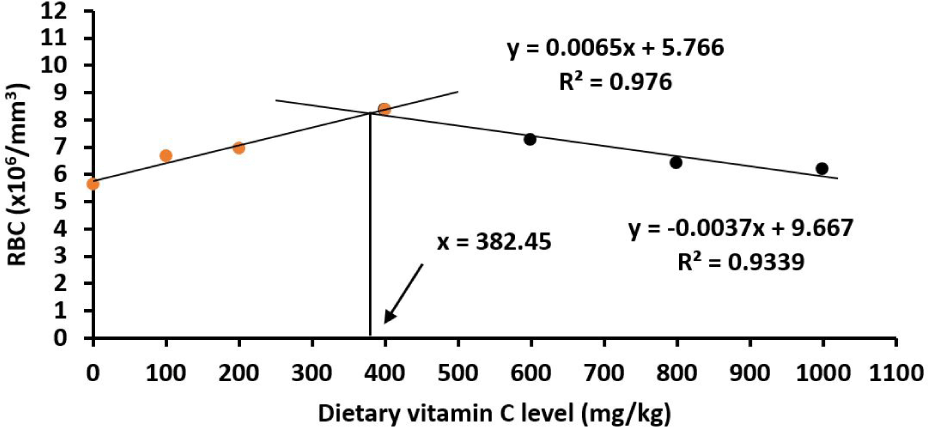
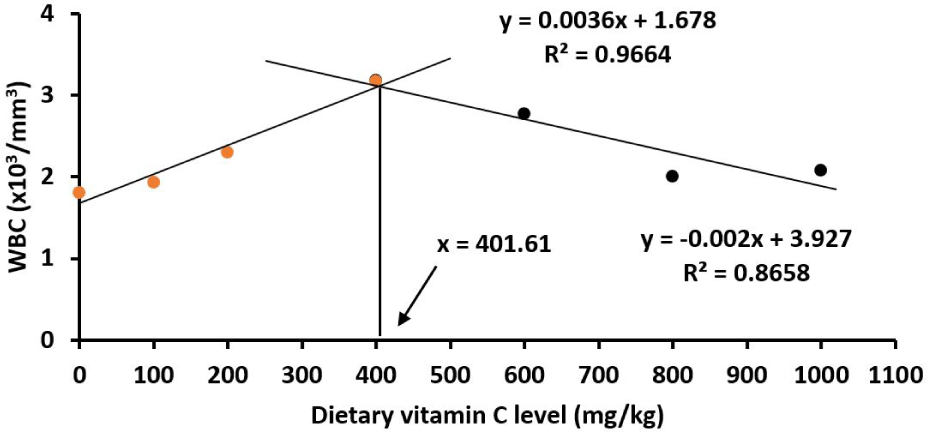
Table 5. RBCs and WBCs in serum of juvenile red drum Sciaenops ocellatus fed different dietary vitamin C diets for 70 days (g/kg wet weight)
Parameters Vitamin C concentration (mg/kg)
0 100 200 400 600 800 1,000
RBC (cells × 106/mm3) 5.63 ± 0.03a 6.67 ± 0.22bc 6.97 ± 0.28cd 8.37 ± 0.24e 7.27 ± 0.09d 6.40 ± 0.06b 6.17 ± 0.15ab
WBC (cells × 103/mm3) 1.80 ± 0.06a 1.93 ± 0.09a 2.30 ± 0.15b 3.17 ± 0.03d 2.77 ± 0.03c 2.00 ± 0.15ab 2.07 ± 0.09ab

Values are means ± SE.

a–e Values with different superscript letters within a row are significantly different (p < 0.05).

RBC, red blood cell; WBC, white blood cell.

Download Excel Table
fas-26-9-525-g9
Fig. 9. Broken‐line regression analysis between dietary vitamin C levels and RBC red drum (n = 9). The predicted requirement is 382.45 mg/kg. RBC, red blood cell.
Download Original Figure
fas-26-9-525-g10
Fig. 10. Broken‐line regression analysis between dietary vitamin C levels and WBC in red drum (n = 9). The predicted requirement is 401.61 mg/kg. WBC, white blood cell.
Download Original Figure

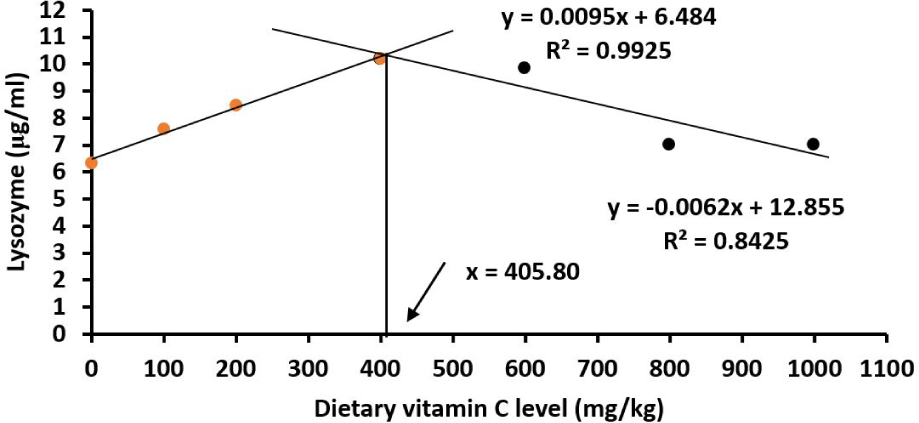
Similarly, the serum lysozyme activity was lower in fish fed a basal diet than those fed vitamin C enriched diets (p < 0.05; Table 6). Juveniles fed 400 mg/kg vitamin C diets had the highest lysozyme activity. The optimal vitamin C requirement for the serum lysozyme activity was 405.80 mg/kg (Fig. 11).

Table 6. Lysozyme in the serum of juvenile red drum Sciaenops ocellatus fed different dietary vitamin C diets for 70 days (g/kg wet weight)
Parameters Vitamin C concentrations (mg/kg)
0 100 200 400 600 800 1,000
Lysozyme (μg/mL) 6.33 ± 0.47a 7.58 ± 0.54ab 8.47 ± 0.43bc 10.20 ± 0.65d 9.84 ± 0.75cd 7.01 ± 0.44ab 7.01 ± 0.44ab

Values are means ± SE.

a–e Values with different superscript letters within a row are significantly different (p < 0.05).

Download Excel Table
fas-26-9-525-g11
Fig. 11. Broken‐line regression analysis between dietary vitamin C levels and lysozyme activity in red drum (n = 9). The predicted requirement is 405.80 mg/kg.
Download Original Figure

Discussion

Survival, growth, feed utilization, and fish body conditions

The survival of the red drum juveniles was 100% in all treatments, suggesting that the level of vitamin C in the basal diet met the requirement for survival, but was not optimal for growth. Indeed, the vitamin C level in the basal diet was 23.2 mg/kg which is higher than the minimal vitamin C requirement of 15 ± 3 mg/kg for red drum juveniles (Aguirre, 1999). The highest WG, SGR, PER and PPV were observed in juveniles fed the diet with a supplement of 400 mg/kg and the estimated optimal vitamin C levels for growth and food utilization parameters were around a narrow range of 343–350 mg/kg which is comparable to the optimal vitamin C levels for other marine farmed fish species such as cobia or parrot fish (Ishibashi et al., 1992; Zhou et al., 2012). It has been shown that vitamin C helps to increase the activity of digestive enzymes such as protease and lipase, which enable an increase in the nutrient absorption efficiency in fish (e.g., discus fish Symphysodon haraldi, Liu et al., 2019). This may explain the higher FCR and protein utilization (PER and PPV), body condition, and most importantly increased growth rate of red drum juveniles in our study.

Despite HSI and VSI being proxies for physiological conditions in fish (Dawood & Koshio, 2018), red drum juveniles did not show differences in HSI and VSI between treatments, suggesting that vitamin C levels in this study did not affect non-fatty energy reserves (e.g., glycogen) of red drum juveniles. These results are similar to our previous study on Psammoperca waigiensis, another farmed species in Vietnam (Le et al., 2021).

Vitamin C supplements in the diet resulted in higher crude protein and lipid contents in red drum juveniles, which may be a result of increased protein and lipid conversion efficiency from the higher protease and lipase activity (Liu et al., 2019). In addition, vitamin C has been known as a cofactor enhancing protein synthesis in fish, which may increase the protein content (Biswas et al., 2013; Sandnes, 1991). The higher protein and lipid contents are essential to building muscle and growth and supply energy to fuel fish activities. Interestingly, the optimal vitamin C levels for the body composition of juveniles were within the same narrow range for the growth and feed utilization parameters.

Biochemical parameters in serum

Vitamin C enhances ferrous iron (Fe2+) speciation and absorption (Bakke et al., 2010) that iron (Fe2+) plays multiple important physiological functions in fish such as a component of hemoglobin in RBCs, myoglobin in muscle, and many enzymes which serve defense functions such as peroxidase, catalase, and cytochromes (Lim et al., 2001). As expected, RBC, WBC, and lysozyme activity were all higher in juveniles fed vitamin C supplements in the diets. The higher levels of WBC and lysozyme activities may improve the resistance of juveniles to pathogens (see e.g., Le et al., 2021). RBC is directly relating to fish respiration. Interestingly, the optimal vitamin C levels for RBC, WBC and lysozyme activity were around 400 mg/kg, which was similar to the finding for other fish species (e.g., Pseudosciaena crocea, Ai et al., 2006). However, the optimal vitamin C levels for these hepatological and immune parameters were slightly higher compared to growth and food conversion parameters, suggesting higher requirements of vitamin C for respiration, and immune defense mechanisms, which is likely due to red drums being a fast-growing species.

Conclusion

In conclusion, the optimal dietary vitamin C requirements of red drum juveniles varied from 342.92 to 405.80 mg/kg diet to improve growth rate, food conversion, and increase innate immunity in red drum juveniles. These results are important to consider when producing artificial feed for rearing red drum juveniles, a species of high commercial and consumption interests in Vietnam. Future studies should also investigate whether these optimal vitamin C levels may be affected by other culture conditions such as extreme temperatures (Le et al., 2021), ocean acidification and diseases (Naylor et al., 2021).

Competing interests

No potential conflict of interest relevant to this article was reported.

Funding sources

This research is funded by Nha Trang University (NTU) under grant number TR2021-13-05. We thank Prof. Paul B. Brown for proofreading.

Acknowledgements

Not applicable.

Availability of data and materials

Upon reasonable request, the datasets of this study can be available from the corresponding author.

Ethics approval and consent to participate

This study conformed to the guidance of animal ethical treatment for the care and use of experimental animals.

References

1.

Aguirre , Gatlin DM. Dietary vitamin C requirement of red drum Sciaenops ocellatus. Aquac Nutr. 1999; 5:247-9

2.

Ai Q, Mai K, Tan B, Xu W, Zhang W, Ma H, et al. Effects of dietary vitamin C on survival, growth, and immunity of large yellow croaker, Pseudosciaena crocea. Aquaculture. 2006; 261:327-36

3.

Bakke AM, Glover C, Krogdahl Å. Feeding, digestion and absorption of nutrients. Fish Physiol. 2010; 30:57-110

4.

Biswas BK, Biswas A, Junichi I, Kim YS, Takii K. The optimal dietary level of ascorbic acid for juvenile Pacific bluefin tuna, Thunnus orientalis. Aquac Int. 2013; 21:327-36

5.

Chen K, Yamamoto FY, Gatlin DM. Effects of inorganic and organic dietary copper supplementation on growth performance and tissue composition for juvenile red drum (Sciaenops ocellatus L.). Aquac Nutr. 2020; 26:820-7

6.

Darias MJ, Mazurais D, Koumoundouros G, Cahu CL, Zambonino-Infante JL. Overview of vitamin D and C requirements in fish and their influence on the skeletal system. Aquaculture. 2011; 315:49-60

7.

Dawood MAO, Koshio S. Vitamin C supplementation to optimize growth, health and stress resistance in aquatic animals. Rev Aquac. 2018; 10:334-50

8.

Fracalossi DM, Allen ME, Yuyama LK, Oftedal OT. Ascorbic acid biosynthesis in Amazonian fishes. Aquaculture. 2001; 192:321-32

9.

González-Félix ML, Gatlin DM, Perez-Velazquez M, Webb K, García-Ortega A, Hume M. Red drum Sciaenops ocellatus growth and expression of bile salt-dependent lipase in response to increasing dietary lipid supplementation. Fish Physiol Biochem. 2018; 44:1319-31

10.

Le MH, Dinh KV, Pham DH, Phan VU, Tran VH. Extreme temperature differently alters the effects of dietary vitamin C on the growth, immunity and pathogen resistance of Waigieu seaperch, Psammoperca waigiensis. Aquac Res. 2021; 52:5383-96

11.

Lim C, Klesius PH, Shoemaker CA. Dietary iron and fish health.In In: Lim C, Webster CD, editors.editors Nutrition and fish health. New York, NY: CRC Press. 2001.

12.

Liu HP, Wen B, Chen ZZ, Gao JZ, Liu Y, Zhang YC, et al. Effects of dietary vitamin C and vitamin E on the growth, antioxidant defence and digestive enzyme activities of juvenile discus fish (Symphysodon haraldi). Aquac Nutr. 2019; 25:176-83

13.

Naylor RL, Hardy RW, Buschmann AH, Bush SR, Cao L, Klinger DH, et al. A 20-year retrospective review of global aquaculture. Nature. 2021; 591:551-63

14.

Padayatty SJ, Levine M. New insights into the physiology and pharmacology of vitamin C. Can Med Assoc J. 2001; 164:353-5.

15.

Peng LI, Gatlin DM. Dietary vitamin E requirement of the red drum Sciaenops ocellatus. Aquac Nutr. 2009; 15:313-9

16.

Sandnes K. Vitamin C in fish nutrition: a review. Fisk Dir Skr Ser Ernêring. 1991; 4:3-32.

17.

Watson AM, Napolitano MP, Schock TB, Bowden JA, Frost J, Yost J, et al. Evaluation of graded levels of soy oil as a fish oil replacement in high soy protein feeds for juvenile red drum, Sciaenops ocellatus. Aquaculture. 2020; 529:735627

18.

Yen PTH, Linh NQ, Tram NDQ. The identification and determination of toxin genes of Vibrio strains causing hemorrhagic disease on red drum (Sciaenops ocellatus) using PCR. AMB Express. 2021; 11:4

19.

Zhou Q, Wang L, Wang H, Xie F, Wang T. Effect of dietary vitamin C on the growth performance and innate immunity of juvenile cobia (Rachycentron canadum). Fish & Shellfish Immunology. 2012; 32:969-75

Appendices

Appendix 1
Analysing serum lysozyme activity

Blood was sampled from the caudal vein by a 1-mL syringe and pooled into 2 mL centrifuge tubes for lysozyme activity analysis. These tubes were kept at 4°C overnight. Subsequently, these tubes were centrifuged at 400 g for 10 min, and the supernatant sera were transferred into new tubes and stored at –80°C until using for analysis. A volume of 25 µL of sera samples was placed into every three wells of the titer plate (triplicate). For control, 25 µL of hen egg-white lysozyme (HEWL; Sigma, St. Louis, MO, USA) in 0.1 M phosphate/citrate buffer of concentration of 20, 10, 5, 2.5, 1.25, 0.625, 0.3125 µg/mL in 0.1 M phosphate/citrate buffer solution with 0.09% NaCl, pH 5.8 was pipetted into 6 wells of the titer plate. Then, the 175 µL of Micrococcus lysodeiltikus 0.075% suspension was added into the wells, quickly mixed, and measured the absorbance at 450 nm using a microtiter reader. The suspension turbidity (absorbance) changes in every well were recorded for 5 min at 30 seconds interval. Lysozyme activity of the sample was calculated as compared to the control HEWL solutions.

Hematological parameters

Blood samples were drawn through the caudal vein of each fish using a syringe rinsed with heparin from one fish in each tank (3 fish per treatment) and transferred to individual sterilized vials (at 4°C). The analysis for white blood cells, red blood cells, hematocrit, haemoglobin, was done using the Sysmex, XT-1800i Blood Analyzer (Sysmex, Hyogo, Japan). Plasma triglycerides and plasma protein were analyzed using a 600 DxC General Chemistry Analyser (Beckman Coulter, Brea, CA, USA).

Ascorbic acid assay

Liver, diet, and whole body were dissected from three fish per tank and pooled for analysis of vitamin C concentration. A weighed portion of the experimental diet, fish liver, or whole body (about 2.0–5.0 g) was finely ground and was put into 100 mL e-tubes. A volume of 15 mL of 0.05 M KH2PO4 buffer (adjusted to pH 2.5 with phosphoric acid) was added and vortexed for 1–2 min. Subsequently, e-tubes were centrifuged at 15,000 rpm for 5–10 min. Supernatants were filtered through a 0.2 µm Whatman paper 1–2 times before analysis. Ten µL of the sample was subjected and injected to the column oven L-2300 at 30°C for vitamin C analysis. The content of vitamin C in the fish liver, whole body or the experimental diets was determined by reverse-pharse high-performance liquid chromatography with a column Intersil ODS-3 C18 (5 µm, 250 × 4.6 mm; GL Sciences, Tokyo, Japan). Mobile phase (a flow rate of 1 mL per min) was an aqueous solution of 0.05 M KH2PO4 (pH 2.5), the effluent was detected and monitored by UV-detector (wavelength 245–257 nm).

Proximate composition analyses

The body protein content was analyzed using the Kjeltec Auto 1030 analyzer (Foss Tecator, Höganäs, Sweden). Lipid content was analyzed by petroleum ether extraction in a Soxhlet extraction system. The moisture was determined by drying at 105°C in an oven (Thermotec 2000, Contherm Scientific, Lower Hutt, New Zealand). Finally, the ash content was determined by combustion at 550°C for 24h in an electric furnace (Carbolite, Sheffield, UK).