Introduction
The large river of South Sumatra is the Musi River (Putri et al., 2020), and is an inland water ecosystem with a length of ± 720–750 km (2°–4°LS, 102°–105°BT; Iqbal et al., 2018b) and crosses the city of Palembang which consists of three parts upstream, middle and downstream. Inland waters include rivers, lakes, reservoirs and flooded swamps related to the level of potential for capture fisheries. This inland water ecosystem is rich in biodiversity and natural resources (Rendana et al., 2022). Utilization of rivers for various economic developments such as agriculture, fisheries, and transportation (Beltaos & Burrell, 2021), industry, plantations, and settlements that have an impact on aquatic ecosystems, fishermen’s livelihoods and community food sources in the form of animal protein. Utilization of rivers that do not pay attention to environmental aspects will indirectly cause water damage or reduce water quality. Aquatic biodiversity includes fish, crustaceans, molluscs, and reptiles. One of the districts crossed by the Musi River has quite large fish resources because it is located in the lower reaches of the Musi River, namely Banyuasin (Saputra et al., 2020). Salah Nama Island is an area located in the lower reaches of the Musi River. This area is unique because it is surrounded by the Musi River and has a flooded swamp area or an area affected by the ebb and flow of seawater. The Salah Nama Island area is an area for fishing activities, along the island there are many plants/riparian areas (Dwirastina & dan Sudarmo, 2019; Sudarmo et al., 2024). The fish resources found on Salah Nama Island are a combination of downstream and swamp fish and fishing gear will adjust to the aquatic ecosystem.
The Musi River basin surrounds Salah Nama Island, fishing always occurs using various fishing gear. High biodiversity, including fish, crustaceans, molluscs, and reptiles is important for maintaining the balance of the ecosystem. Fish and aquatic plants are among the various types of aquatic biota that can be found in the Musi River. The concept of this research was triggered by the lack of data and research on Salah Nama Island. Many studies have been conducted on the various species of fish found in the Musi River. There are at least 233 species of fish in the Musi River area. However, when examined further, some of the reported species are sometimes still doubtful and need further clarification. The results of the latest research report new species that have been described for science and endemic to the Musi River, for example, Betta pardalotos, Glyptothorax keluk and Nandus mercatus (Ng & Kottelat, 2016). Further research shows that the list of species found in the Musi River and the east coast of South Sumatra is increasing with the discovery of new species that have never been reported before, such as Crossocheilus obscurus, Fluvitrygon oxyrhynchus, Fluvitrygon signifer, Lobocheilos ixocheilos, and Silhouettea evanida, as well as Urogymnus polylepis (Iqbal et al., 2018a). The diversity of capture fisheries and aquaculture resources that are used as sideline or seasonal businesses is now decreasing due to excessive fishing activities and declining water quality in the Musi River.
Research related to Musi River fisheries has been conducted (Agustriani et al., 2020) while Salah Nama Island (Dwirastina & dan Sudarmo, 2019) has not been done much, however, fish resources are resources that can experience decline or extinction caused by environmental or human pressures, so it is very necessary to conduct actual research related to fish resources so that the data produced is the latest. Fish resources are often referred to as common property resources which are closely related to conditions prone to overfishing. Fishery resources have contributed more than 50% to total national production, but this has decreased very drastically. This is because there is no firm commitment from either the government or the community to the management of fishery resources. For example, there are still many overfishing activities, there are no or still few protected areas (reserves) for fish, the minimal role of Pokmaswas and law enforcement or the provision of witnesses for violations of regulations that have been made, both those related to places and fishing gear whose operations are dangerous, such as tiger trawls, electric, bombs and so on. Based on the above, the purpose of this writing is to determine the distribution of fish resources and water quality in the downstream part of the Musi River from Salah Nama Island to Sungsang.
Materials and Methods
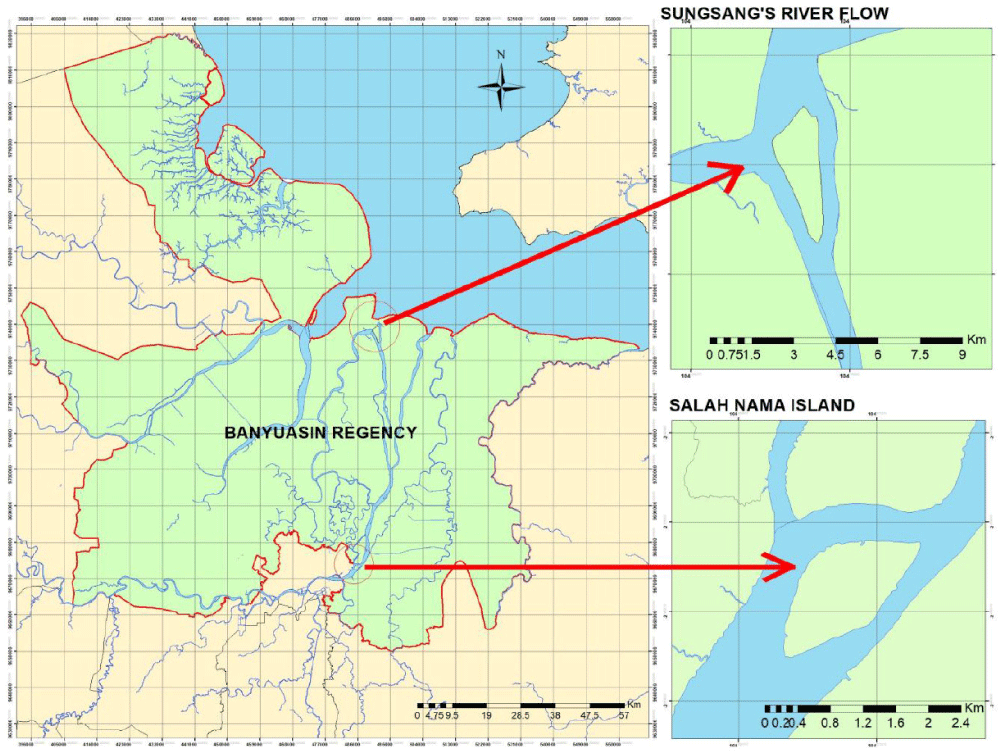
Determination of the research location using the purposive sampling method. The study was conducted by collecting primary data and interviews in the form of catch results. Catch data was obtained based on the catches of fishermen using net fishing gear. The research team conducted interviews with fishermen as enumerators. Enumerators recorded each catch within a certain period of time. Determination of enumerators was based on the fishing area, namely Salah Nama and Sungsang Islands. In situ water quality sampling in 2023 and laboratory analysis. Water sampling with a volume of 1 liter was taken to the Environmental Laboratory at the UPTD of South Sumatra Province in 2023. While the water quality in 2007–2022 was in the form of secondary data from literature studies. The research location was the downstream of the Musi River, South Sumatra, a case study of Salah Nama Island and Sungsang Island (Fig. 1). Data analysis was carried out in the form of tables and analyzed statistically using principal component analysis (PCA) using a statistical application by linking water quality parameters each year and location.
Results
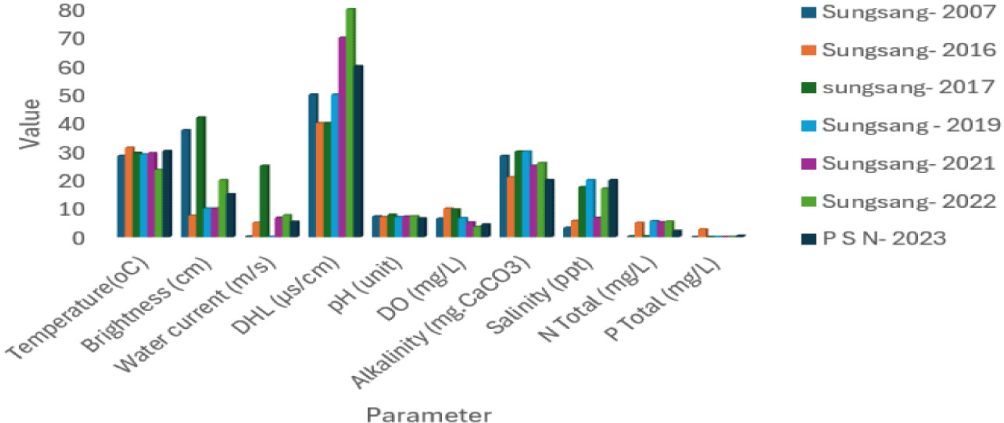
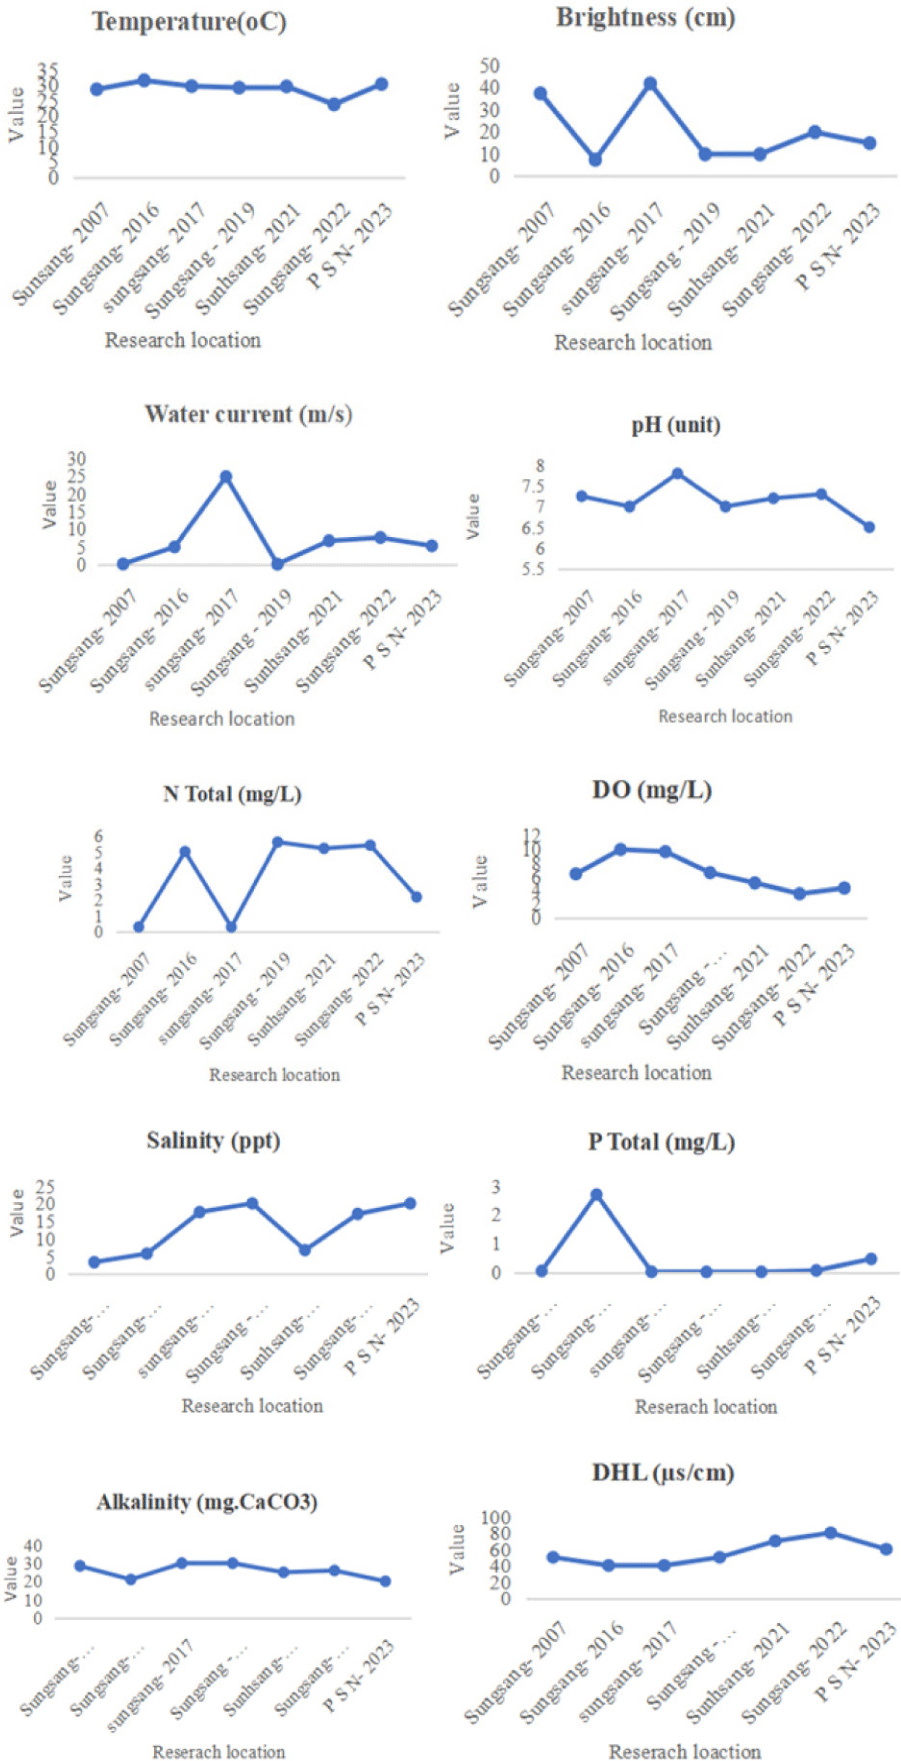
Based on environmental parameter research on several water quality parameters including temperature (°C), brightness (cm), current (m/s), electrical conductivity (µs/cm), pH (units), DO (mg/l), alkalinity (mg/l), salinity (ppt), total N (mg/l), and total P (mg/l) the following results were obtained. Water quality test data was taken mainly by sampling and direct in-situ examination in the field during the research as well as secondary data with literature studies from 2007–2023 as seen in Fig. 2 and Fig. 3. From the data listed, it is known that the value of environmental parameter variations from year to year is stable, fluctuating depending on when the research was conducted. Environmental parameters need to be considered in waters, this is because fish resources live in waters as a habitat where they live. In principle, if fish resources are good, then the aquatic environment must be good, but if it is not good, then it is an indication that a problem has occurred, either caused by internal or external factors.
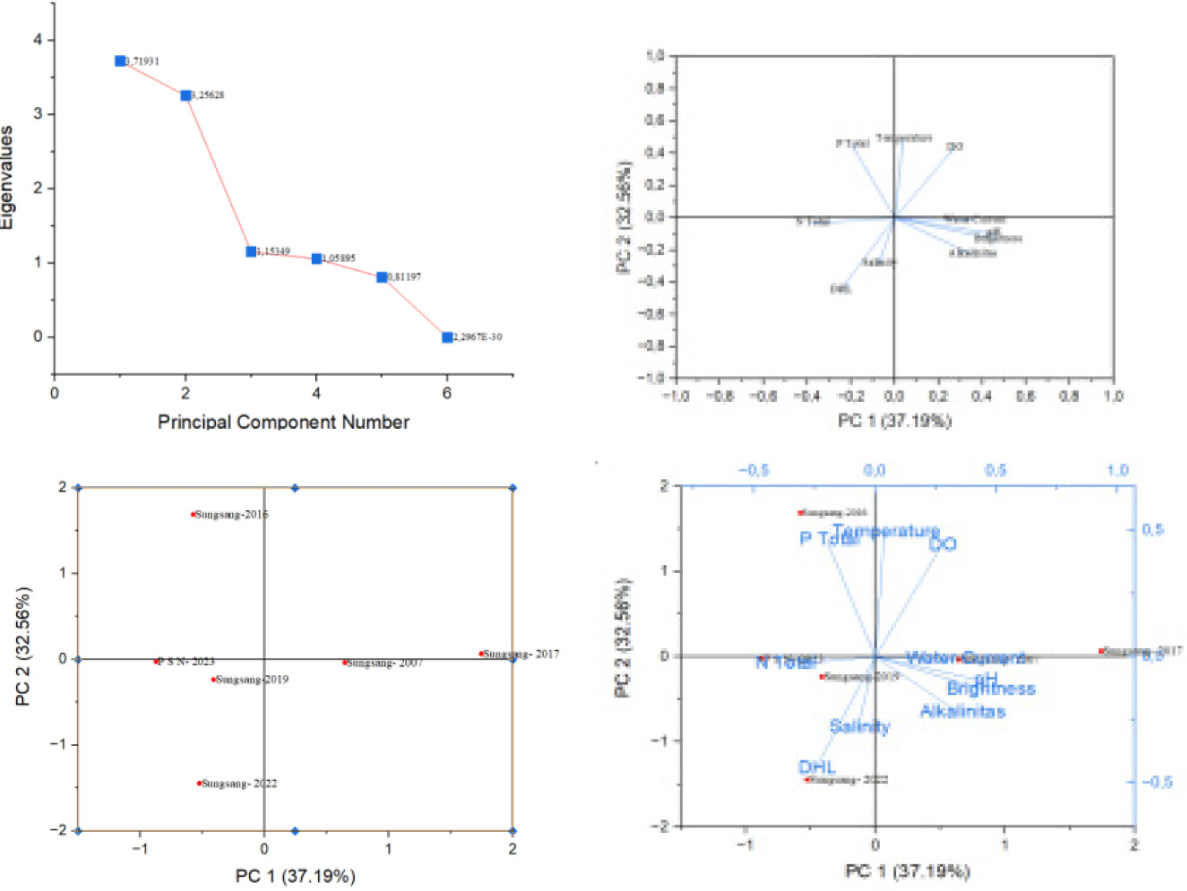
A study of fish resources will always be associated with the existence of its habitat. By looking at this relationship, we indirectly see the relationship between environmental parameters. The relationship between water quality parameters in the Musi River Downstream area from 2007–2023 can be seen in Table 1 and Fig. 4. In this relationship, the parameters temperature (°C), brightness (cm), current (m/s), DHL (µs/cm), pH (units), DO (mg/l), alkalinity (mg/l), salinity (ppt), total N (mg/l), and total P (mg/l) will be seen using PCA. This analysis will correlate the existence of parameters at the water sampling location. The closer the axis lines are, the closer the relationship between the parameters and the habitat or location of the fish resources produced. This analysis will use the closest factor approach with the highest percentage of factors, where in this study PCA 1 was 37.19% and PCA 2 was 32.56%.
Distribution of fish resources is important to do by comparing data obtained from year to year. Distribution data will provide information on the existence of fish resources that are still found, those that have run out and those that are no longer found or rare. The data presented below are primary data and secondary data so the data is obtained from several years of fish resource distribution starting from 2007–2023. Distribution data is collected as a general description of fish catches using gill net fishing gear. The results of fish resource research that has been carried out in the Musi Hilir River area of South Sumatra in 2007–2023 can be seen in Tables 2–7. Table 2 contains data on the distribution of fish resources using gill net fishing gear from five families, namely Ambassidae, Anabantidae, Apogonidae, Ariidae, and Bagridae. In Table 3, the distribution data of fish resources from 12 families, namely Belonidae, Biluridae, Butidae, Carangidae, Carcharhinidae, Centropomidae, Chaetodontidae, Chandidae, Chirocentridae, Cichidae, Clariidae and Clupeidae. In Table 4, the distribution data of fish resources from 2 families, namely Cyanoglossidae and Cyprinidae are presented. In Table 5, the distribution data of fish resources from 17 families, namely Dasyatidae, Datnioidodae, Diceratiidae, Dorosomatidae, Drepaneidae, Engraulidae, Ephippidae, Gobiidae, Haemulidae, Hemiramphidae, Hemiscyliidae, Leiostatidae, Lagnathidaedae, and Muraenesocidae. In Table 6 fish resources belong to 11 families, namely Muraenidae, Palaemonidae, Pangasidae, Paralichthyidae, Penaeidae, Psettodidae, Scatophagiadae, Sciaenidae family resources and, Stomaidae, Stomiatidae, Synanceidae, Synodontudae, Taenioididae, Tetraodont idae, Triacanthidae, Trichiuridae.
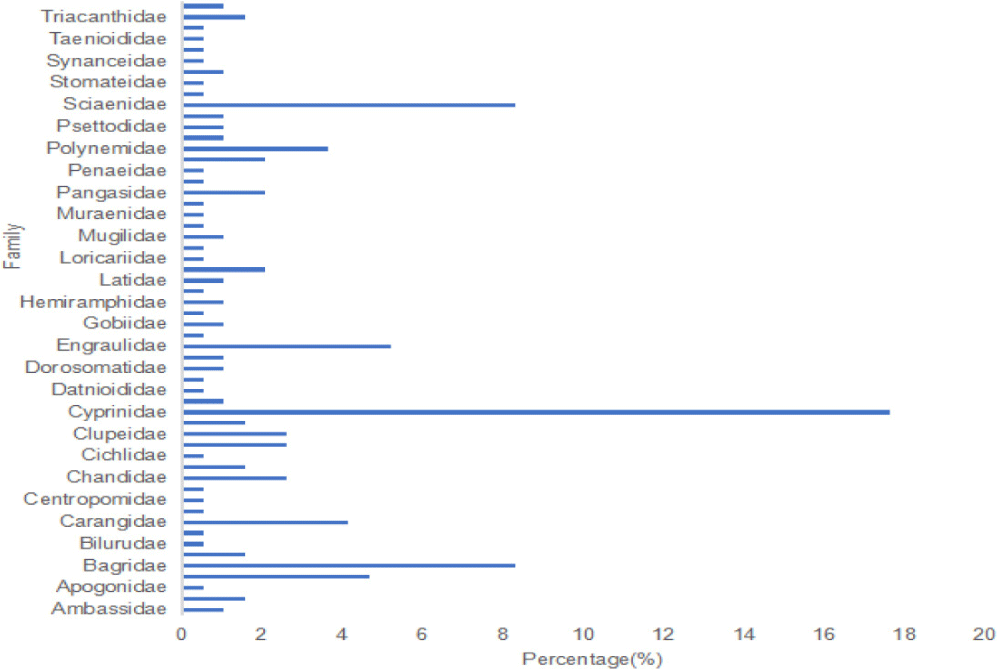
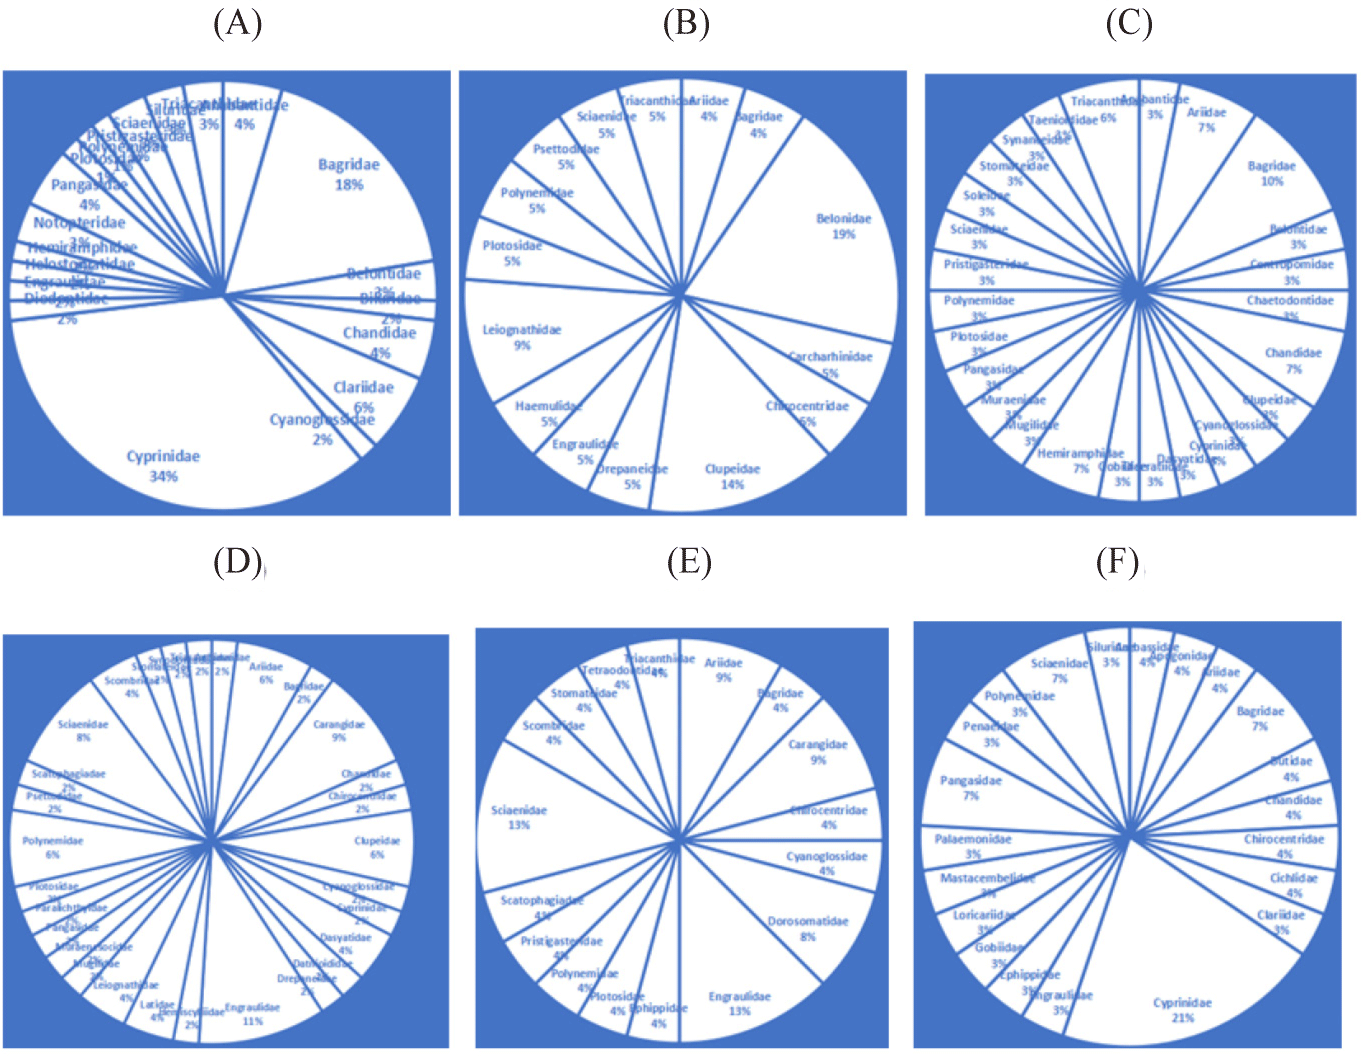
The catch of fish resources is the catch of net fishing gear. The composition of the catch is known from the catch of fishermen in a period of fishing gear. The catch of fishermen obtained in the Musi Hilir River can be seen in Fig. 5 and 6. Where from the catch results it is known the types of families that have increased, moderate and experienced a drastic decline. The higher the percentage obtained in one family, the greater the composition of the catch (Fig. 5). From the results of the composition, it is also the type of family with the highest percentage that has the most types found in the waters (Fig. 6).
Discussion
In water quality observations, water temperature parameters from 2007–2023 in the Lower Musi River ranged from 28.5–31.04°C, this indicates that the water temperature is still in the normal category so that the effect of temperature on the waters of the Musi River including Salah Nama Island tends to be stable and normal. Gunawan et al. (2019) stated that what must be considered is water quality in the form of temperature which affects growth (Syarif et al., 2020), survival (Cintia et al., 2023), Fish stress levels, erythrocyte degradation in fish, Physiological levels that affect water temperature include respiration, eating, metabolism, behaviour (Fajar, 2021) reproduction, detoxification rate and bioaccumulation. The brightness parameters of the Sungsang area 2007–2019 ranged from 30–50 cm while the Sungsang area 2019–2022 brightness ranged below 30 cm and so did Salah Nama Island at a brightness value below 30 cm. Brightness is a condition that indicates light to penetrate the water layer at a certain depth. This parameter is directly connected to the process of photosynthesis in water (Adawiyah et al., 2018). The current speed in Sungsang and Salah Nama Island ranges from 0–30 m/s. The highest current speed occurred in the Sungsang area in 2017 ranging from 30 m/s while Salah Nama Island is still in a stable condition around 5 m/s. According to Modalo et al. (2018), the current speed is very necessary to see the amount of suspended solids that will be carried which will result in erosion or sedimentation. This supported movement of nutrients is influenced by current patterns because circulation will affect the fluctuation and distribution of nutrients in the waters. The pH value in Sungsang and Salah Nama Island is still in the normal category. Sudarmo et al. (2023), Kaban et al. (2023) that changes in acidity (pH) indicate water quality. pH is an important factor in determining the nature of water to be acidic or basic, affecting biological life in waters. Díaz-Gamboa et al. (2017) changes in pH, temperature, and salinity in waters influence the dynamics of species in the estuary. Salinity plays a major role in the downstream waters of the river. Purnaini et al. (2018) tidal currents will have an impact on pollutants in the estuary as they migrate upstream at high tide and downstream at low tide. In addition to the above parameters, there is an alkalinity parameter where the total alkalinity is balanced with the water hardness value (Ramdiani, 2014). The total alkalinity will be greater than the hardness, ranging from 20–300 ppm. If the total alkalinity is too low, it can be increased by adding lime (Sitanggang & Amanda, 2019). Meanwhile, research on Sungsang and Salah Nama Island is still at the recommended alkalinity value range. The DHL parameter is in the range below 100 µs/cm, indicating that the waters are still in a good category. DHL value is directly proportional to salinity because the amount of dissolved salts that can be ionized and high salinity causes dry leaves and reduces the amount of plant production. The DHL value of water can be affected by the time of sampling and the season. DHL values that are in the range of 30–2,000 µS/cm based on quality standards can be said to be harmless. Total P value content where the ratio of phosphorus to biomass is much more varied than carbon/nitrogen to biomass of aquatic organisms. Thus, phosphorus is a limiting factor in stagnant water ecosystems (lakes), phosphate ranges from 0.06–0.37 mg/l where phosphate concentration is influenced by nutrient intake from water catchment areas, aquaculture activities and activities of the surrounding population. Phosphorus compounds are used as limiting factors for water fertility. According to Alfatihah et al. (2022), low oxygen levels in water can harm aquatic biota since oxygen is required for breathing, development, and reproduction. According to Sugianti & Astuti (2018), most fish in contaminated waterways die owing to a shortage of oxygen caused by microbes degrading organic waste (Sugianti & Astuti, 2018). Most fish are in contaminated waterways due to a lack of oxygen due to the degradation process of organic matter by microorganisms. Temperature affects N-total, this is because the need for oxygen utilizes oxygen for the decomposition process. Particles from the land that enter the waterways as a result of erosion, human activity, pH, and nutrient input all have an impact on the overall P content.
The relationship between water quality based on PCA analysis has two factors where factor 1 is around 37.19% and factor 2 is around 32.56%. Fig. 4 Analysis explains that the results of the water quality parameters of Sungsang 2007, Sungsang 2017 and Salah Nama Island 2023 are close to the line, indicating that the parameter values are close to or directly proportional, while the Sunsang area 2016. 2019 and 2022 are inversely proportional to Sungsang 2007, 2017 and Salah Nama Island. The water quality parameters of temperature, total P, and DO will be inversely proportional to salinity, DHL, and Alkalinity.
In Tables 1–7, 57 families (Fig. 2) and 266 species of fish were found in the Lower Musi River from Salah Nama Island to Sungsang. From the research conducted from 2007 to 2023, various families were found, in 2007 fish species were found from the Anabantidae family (9 species), Bagridae (19 species), Belontidae (9 species), Chandidae (6 species), Clariidae (5 species), Cyanoglossidae (2 species), Cyprinidae (43 species), Diodontidae (1 species), Engraulidae (1 species), Helostomatidae (1 species), Hemiramphidae (1 species), Notopteridae (2 species), Pangasidae (3 species), Plotosidae (1 species), Polynemidae (1 species), Pristigasteridae (1 species), Sciaenidae (1 species), Sergestidae (2 species), Siluridae (2 species) and Triacanthidae (2 species). In that year, the Lower Musi River was dominated by the Cyprinidae family. In 2016, the families Ariidae (1 species), Bagridae (1 species), Belonidae (1 species), Carangidae (3 species), Carcharhinidae (1 species), Chirocentridae (1 species), Clupeidae (3 species), Drepaneidae (1 species), Engraulidae (1 species), Haemulidae (1 species), Leiognathidae (2 species), Plotosidae (1 species), Polynemidae (1 species), Psettodidae (1), Sciaenidae (1 species) and Triacanthidae (1 species) were found. In 2017, the families Anabantidae (1 species), Ariidae (2 species), Bagridae (3 species), Belontidae (1 species), Centropomidae (1 species), Chaetodontidae (1 species), Chandidae (2 species), Clupeidae (1 species), Cyanoglossidae (1 species), Cyprinidae (1 species), Dasyatidae (1 species), Diceratiidae (1 species), Gobiidae (1 species), Hemiramphidae (2 species), Polynemidae (1 species), Pristigasteridae (1 species), Sciaenidae (1 species), Soleidae (1 species), Stomateidae (1 species), Synanceidae (1 species), Taenioididae (1 species), and Triacanthidae (2 species) were found. In 2019, the families Ambassidae (1 species), Ariidae (3 species), Bagridae (1 species), Carangidae (4 species), Chandidae (1 species), Chirocentridae (1 species), Clupeidae (3 species), Cyanoglossidae (1 species), Cyprinidae (1 species), Dasyatidae (1 species), Datnioididae (1 species), Drepaneidae (1 species), Engraulidae (5 species), Hemiscylliidae (1 species), Latidae (2 species), Leiognathidae (2 species), Mugilidae (1 species), Muraenescidae (1 species), Pangasidae (1 species), Paralichthyidae (1 species), Plotosidae (1 species), Polynemidae (3 species), Psettodidae (1 species), Scatophagiadae (1 species), Sciaenidae (4 species), Scombridae (2 species), Scatophagiadae (1 species), Sciaenidae (4 species), Stomateridae (1 species), Synodontudae (1 species) and Triacanthidae (1 species). In 2020, the Ariidae (2 species), Bagridae (1 species), Carangidae (2 species), Chirocentridae (1 species0, Cyanoglosssidae (1 species), Dorosomatidae (2 species), Engraulidae (3 species), Ephippidae (1 species), Plotosidae (1 species), Polynemidae (1 species), Pristigasteridae (1 species), Scatophagiadae (1 species), Sciaenidae (3 species), Scombridae (1 species), Stomateidae (1 species), Tetraodontidae (1 species) and Triacanthidae (1 species) were found. In 2023, the Ambassidae (1 species), Apogonidae (1 species), Ariidae (1 species), Bagridae (2 species), Butidae (1 species), Chandidae (1 species), Chirocentridae (1 species), Cichlidae (1 species), Clariidae (1 species), Cyprinidae (6 species), Engraulidae (1 species), Gobiidae (1 species), Loricariidae (1 species), Matacembelidae (1 species), Palaemonidae (1 species), Pangasidae (2 species), Penaeidae (1 species), Ploynemidae (1 species), Sciaenidae (3 species) and Siluridae (1 species). In Table 1–7, the types of fish in the Lower Musi River in the Sungsang area in 2007 are more varied, more diverse families, while in 2019 there was a decline in the amount of fish diversity, and so did the fish catch on Salah Nama Island in 2023. Based on the research presented in Table 1–7, it is indicated the types of fish in the Lower Musi River have decreased where Sungsang-2007, Sungsang 2016, Sungsang 2017, Sungsang 2019, Sungsang 2020 found 112 species, 21 species, 32 species, 48 species, and 24 species while Salah Nama Island-2023 only found 29 species of fish. Based on the research conducted and literature studies, data on the decline in this type of fish is based on gill net fishing gear. Thus, there has been a drastic decline. The decline in catches in terms of types and quantities is caused by several factors including excessive and continuous fishing (Damayanti, 2017) habitat fragmentation, water pollution (Zammi et al., 2018), water use and climate crisis, where competition between species and water quality so that fish species that have high tolerance will increase in number and vice versa experience a decline. Fluctuations in catches are greatly influenced by the presence of fish, the success rate of fishing operations, and the number of fishing efforts. According to Li & Li (2019), Supriadi et al. (2020), Picaulima et al. (2021) factors that influence catches include net length, number of crew and fishermen, length of the fishing trip, fuel, and availability of resources. Form fishing efforts to maximize catches and income (Ridha, 2017) by changing fishing areas, using various fishing gear and various fishing techniques.
Fig. 2 shows the composition of fish families from 2007 to 2023, the results show that there are a total of 56 families, where the highest family composition is Cyprinidae. Based on research, the fish families found have decreased where Sungsang research 2007, 2016, 2017, 2019 and 2020 found 21 families, 16 families, 25 families, 29 families, and 17 families while Salah Nama Island 2023 found 20 families. That Cyprinidae is the largest fish population in the waters of the Sumatran River. Froese & Pauly (2024) stated that Cyprinidae are fish that have the largest number of species in the world, around 3,162 species in all types of waters (Samitra et al., 2018). The large number of Cyprinidae fish makes this species the most potential to be used by the community as a food fish. Research by Samitra & Rozi (2018), Wahyuni & dan Zakaria (2018) the large number of Cyprinidae types of Barbonymus sp is due to the substrate in the river in the form of rocks. Sand gravel and mud with strong or weak current speeds. Samitra & Rozi (2019) stated that human activities in fish habitats will affect their diversity so that each type of fish can live and reproduce by adapting to the environmental conditions in which the fish live.
According to the survey results of the research, no species were discovered to exist every year. This is likely because fish do not have a high ability to adapt to environmental changes and shows that there has even been a decline in the types and numbers of fish every year. The phenomenon of decreasing types and numbers of fish is thought to be influenced by human activities that are less aware of the importance of sustainable utilization of fish resources and decreased fish catches caused by several factors, namely water pollution, habitat destruction, overfishing (Du et al., 2021; Latuconsina, 2023) and the absence of integrated fisheries resource management and conservation efforts.
Salah Nama Island to Sungsang is the waters of the Lower Musi River, where according to Fauziyah et al. (2019) the Banyuasin waters have good fish resource potential. The downstream area, especially Sungsang, is a river estuary used as a location for fishing, settlements, and transportation and is tidal which will change with climate change and the entry of new species (Christensen et al., 2019). Based on information from BPS from 2014 to 2017, the number of fishing gear units operated by fishermen in Banyuasin increased from year to year which could cause excessive exploitation and depletion of available fish stocks (Agustriani et al., 2020). Location of the Lower Musi River approaching the Estuary. In 2004, fish resources in Muara Sungsang were found in abundance because the estuary has a complex level of productivity as well as a place for nursery ground, spawning ground, residence, fish migration, and feeding ground. Based on Engman et al. (2019), the Estuary has complex productivity, namely having high nutritional wealth and organisms as natural food, but Amescua et al. (2019) that Estuaries are very vulnerable to threats from human activities, especially anthropogenic ones.
The fish caught include whitefish whose main habitat is rivers/inland waters of Indonesia, have important economic value. The decline in biomass of fish resources indicated by the decline in catches is influenced by several factors including pollution activities, fishing pressure, the number of fishing gear and fleets operating. In addition, the low biomass value is due to the presence and condition of fish, especially the Cyprinidae family due to strong wave impacts.
Conclusions
The decline in the number of fish species in the Lower Musi River namely Sungsang and Salah Nama Island areas from 2007 to 2023 from 112 species of 21 families to 29 species of 20 families, water quality factors from several parameters (temperature, brightness, DO, N-total, P-total, salinity, pH) indicate that it is still suitable for the life of fish resources and which affects the decline in the number of species, especially in certain seasons, which is caused by excessive and environmentally unfriendly fishing activities.


