


Introduction
The cantrang has been the most controversial fishing gear over the past decade in Indonesia, particularly in the Java Sea. Cantrang refers to the local name of the boat Danish Seine, which is designed to capture demersal fish (FAO, 2024; Gabriel et al., 2005). Cantrang was initially employed by fishers in Indonesia in 1960 and became more widespread in 1980, following the government’s ban on trawling (Sasmita, 2013). This gear has been modified by local fishers in various configurations to effectively target not only demersal fish, but also several other fish groups (e.g., Riyanto et al., 2011). Additionally, the cantrang cod-end is constructed with a small mesh size with low selectivity, resulting in a significant amount of bycatch, particularly juvenile fish (e.g., Adhawati et al., 2017a; Wijayanto et al., 2019a).
The rapid development of cantrang, especially in the waters of Java, has proven to have a detrimental impact on fish resources, leading to overfishing and conflicts with other fishing gears, such as gillnets, traps, lines, and purse seines (e.g., Wijayanto et al., 2019b). To address this issue, the Indonesian government has enacted the Ministry of Marine Affairs and Fisheries (MMAF) Decree Number 2/2015, which prohibits the use of trawls and seine nets (including cantrang) in Indonesia’s Fisheries Management Areas (FMAs) since 2015. Therefore, fishers must replace with sustainable fishing methods and fishing gears. However, there are pros and cons of implementing this regulation because of its social and economic impacts. The higher economic benefits gained from using cantrang compared to other fishing gear in the Java Sea are the main reason why fishers are reluctant to replace it (Nababan et al., 2020).
The Java Sea waters are part of Indonesia FMA (WPPNRI) 712 which has the highest fisheries production. In 2021, the number of vessels operating in WPPNRI 712 reached 165,352 units, with commonly used fishing gear consisting of bouke ami, drop nets, cantrang, purse seine, and seine nets. The total cantrang production in 2019, 2020, and 2021 was 134,107 tonnes, 171,522, and 172,211, respectively (Rizal et al., 2023). One of the largest and dominant bases of the central fleet in the Java Sea is at Tegalsari Fishing Port. Cantrang dominated about 72.40% of the fleet, and 61.67% or about 285 units were cantrang vessels larger than 30 gross tons (GT) size (Tegalsari Coastal Fisheries Port, 2020).
As a result of the high fishing intensity including cantrang, the stock status of certain fisheries in the Java Sea is classified as depleted. According to MMAF Decree No. 19 (2022), only the small pelagic group of fish is in a healthy condition (moderate status). Meanwhile, the group of big pelagic, demersal fish, crabs, and swimming crabs indicated a fully exploited status, and even the group of reef fish, shrimp, lobster, and squid indicated an overexploited status. Demersal fish resources have been overfished condition since 2011 (Baharudin et al., 2011)
Fishing activities have potential impacts on the structure and function of ecosystems. The structure of an ecosystem includes the number of species, their abundance, biomass, and size, whereas its function includes factors such as trophic level and spawning. The trophic level refers to the position of organisms or groups of organisms within food webs and is determined by identifying the energy sources for each organism (Pauly et al., 1998; Shannon et al., 2014). Changes in the ecosystem structure and function resulting from fishing can threaten the long-term sustainability of fish resources. Fishing can degrade the quality of marine food webs (Pauly et al., 1998). This is also indicated by a decrease in the diversity of fish resources (Thrush et al., 2016). Additionally, fishing activities lead to the mortality of fish populations, resulting in the loss of key aquatic species (Martins et al., 2012; Poulsen et al., 2007). This can result in an imbalance of trophic levels (TL) in an ecosystem due to differences in predator-prey ratios, which can disrupt the food chain structure in marine ecosystems (Martins et al., 2012; Pauly et al., 2005). In intensive fishing activities areas, fish species dominated by low TL, small sizes, and short life cycles tend to be more common (Jennings et al., 2001; Taurusman et al., 2020).
Cheung et al. (2005) defined the vulnerability of fish as the risk of local extinction associated with a species’ life history and ecological characteristics. Utilizing a fuzzy expert system, they developed a fishing vulnerability level based on eight input variables: maximum length, age at first maturity, longevity, von Bertalanffy growth parameter K, natural mortality rate, fecundity, strength of spatial behavior, and geographic range. Four categories of intrinsic vulnerability to extinction level were established: (1) very high, (2) high, (3) moderate, and (4) low. The intrinsic vulnerability is also quantified on an arbitrary scale from 1 to 100, with 100 representing very high vulnerability. The input variables and the fishing vulnerability level of specific species are currently accessible through FishBase (Froese & Pauly, 2024) and have been utilized in this study.
Studies on the ecological impacts of cantrang on fish resources are important for the government to determine appropriate fisheries management measures in Indonesia. Previous studies have shown various effects of cantrang on fish resources and the socio-economy of fishers, such as catch composition related to fishing season (Imron et al., 2021), technical aspects of fishing boats and fishing gear (Riyanto et al., 2011), the economic impact on cantrang and other gears (Nababan et al., 2020; Wijayanto et al., 2019b), and social impact of cantrang ban (Adhawati et al., 2017b). Although cantrang has been widely considered an unsustainable fishing gear in Indonesia, there have been no extensive studies on its ecological impacts. A comprehensive study on the ecological impact of cantrang on the structure and function of fish resources is necessary as an input for fisheries management and regulations. This study aims to analyze the impact of the cantrang, which mainly operates in the Java Sea based on catch characteristics. In this study, the catches of various sizes of cantrang vessels that also represent the fishing grounds were analyzed ecologically using a multivariate approach. This is the first peer-reviewed study to provide ecological characteristics of catches to evaluate the impact of variation in cantrang size. This is related to achieving sustainable fisheries goals. In terms of the Ecosystem Approach to Fisheries Management (EAFM) principle, fisheries should be managed to limit their impact on the ecosystem to the extent possible.
Materials and Methods
Data collection on the catch of cantrang fishing vessels with various sizes of boats was conducted at the Tegalsari Fishing Port because of the numerous and diverse sizes of cantrang fishing vessels that landed in this port. The fishing grounds for these vessels extend up to 100 to 200 nautical miles from the fishing base (see Fig. 1); approximately two to three days are needed from the fishing base to the fishing ground, with a total fishing duration of up to three months.
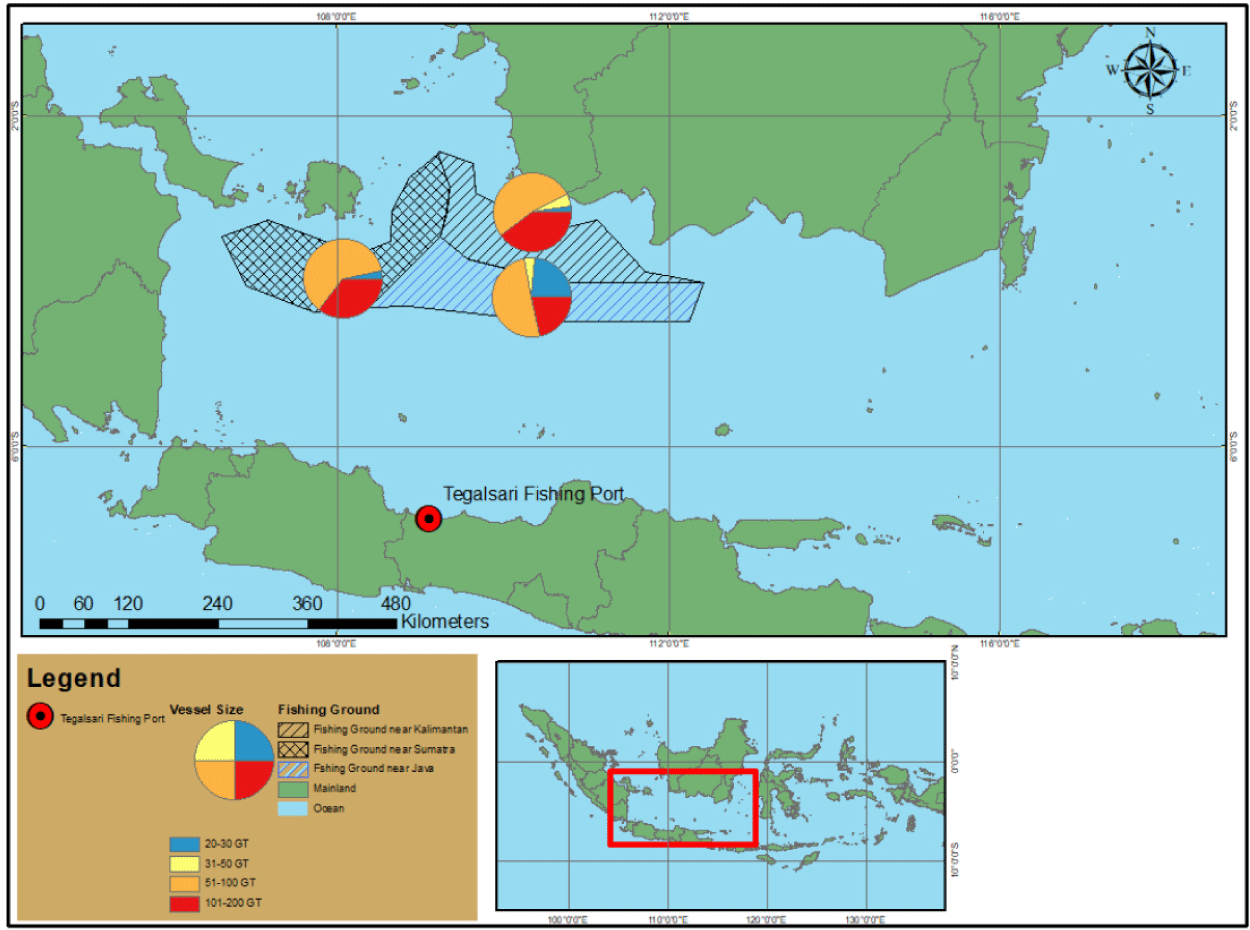
Samples were collected from 60 cantrang vessels ranging in size from 20 to 156 GT during the peak fishing season, which took place from January to March 2021. The catch data collected in this study were related to vessel size, species composition, and biomass of the cantrang catches. A purposive sampling technique focused on cantrang vessels of various sizes that landed on their catches during the study. In addition, daily statistical data from Tegalsari fishing port and official government data from the MMAF were used in this study. The data were analyzed to provide insights into the size distribution of cantrang vessels and the species composition and biomass of the catches during the study period.
The categorization of catches was based on several parameters, namely taxa (which included species and families), trophic level, habitat, and fishing vulnerability level. The characteristics of each species catch were determined using various references, particularly the metadata of fishbase.org (Froese & Pauly, 2024) for fish, sealifebase.org for invertebrates (Palomares & Pauly, 2024). Additionally, catches were differentiated according to vessel size group, as classified by the MMAF official grouping system (which included categories, i.e., 20–30, 31–50, 51–100, and 101–200 GT).
To evaluate the effects of cantrang vessel sizes and biomass of each catch parameter, a multivariate statistical analysis of the data was applied using various routines of the PRIMER-e v.7 software package (PRIMER-e, Quest Research Ltd, Auckland, New Zealand; Clarke & Gorley, 2015). Similarity percentage was used to identify which group of the ecological catch parameters was mainly responsible for characteristics of the parameters among the vessel sizes. The relationships between catch species (family) or vessel sizes were determined using cluster analysis and non-metric multidimensional scaling (MDS). Interpretation of an MDS is straightforward: objects closer together are more similar than those further apart. Statistical analysis of similarities (ANOSIM) was used to test the significance of the impact of grouping factors (cantrang vessel sizes) using PRIMER Software (Clarke & Gorley, 2015). ANOSIM is a non-parametric procedure analogous to the analysis of variance (ANOVA), which is based on the ranks of the value in the similarity matrix. Quinn & Keough (2002) recommended using ANOSIM to test hypotheses regarding group differences in a multivariate context. The similarity relationship was calculated by a change in Clarke’s R-value. Clarke’s R-value provides an absolute measure of how separated groups are on a scale of 0 (indistinguishable) to 1 (all similarities within groups are less than any similarity between groups).
Results
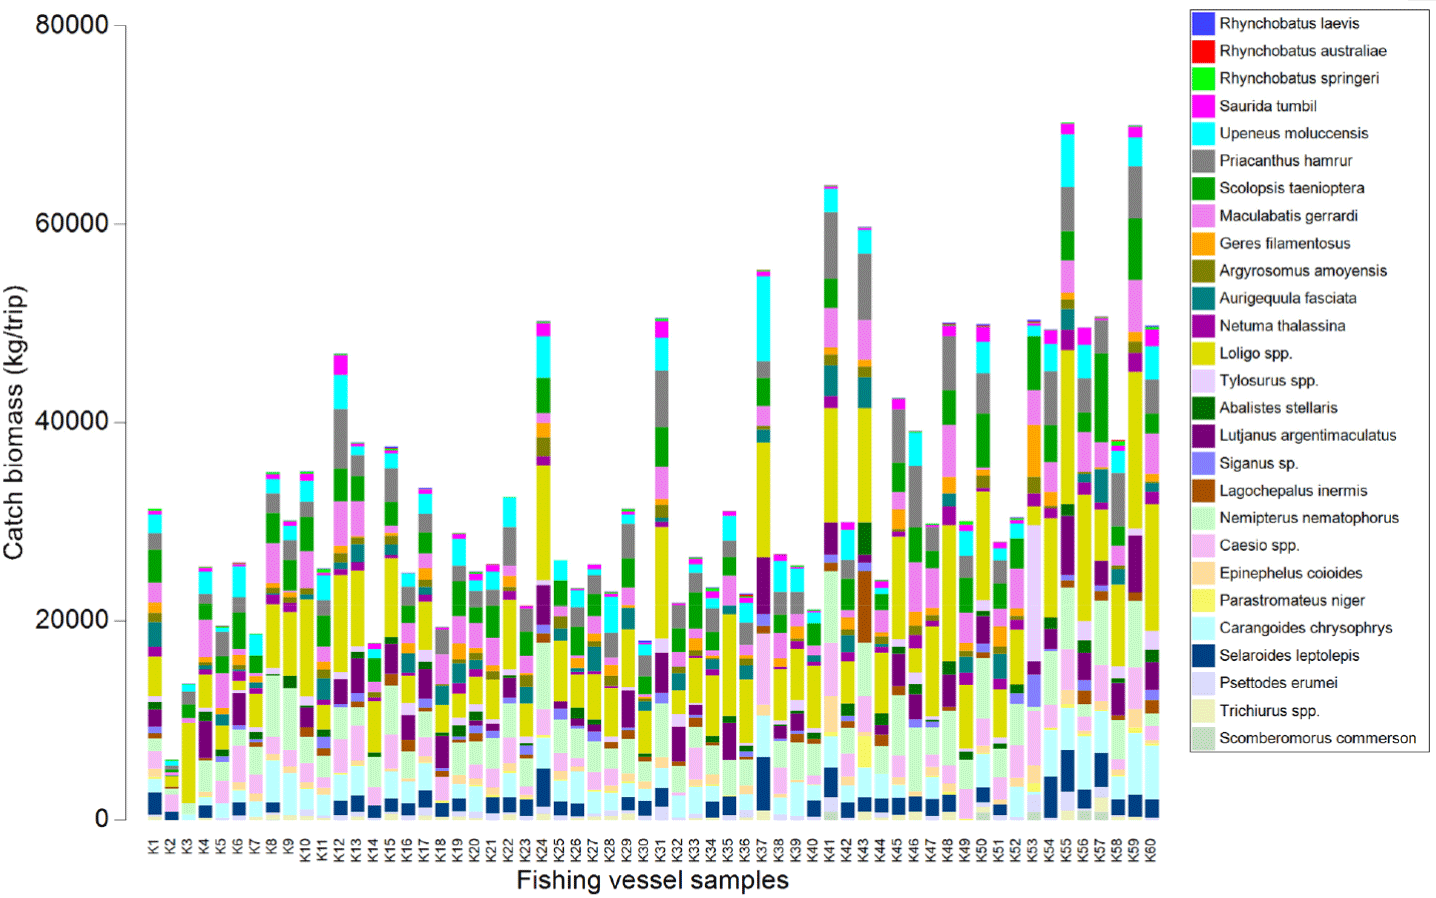
The catch composition and biomass of each cantrang vessel samples (60 units) in this study are presented in Fig. 2. There were 27 fish species officially recorded as cantrang catches during this study. Based on the catch samples, a multivariate analysis of different-sized vessels (as a representation of the fishing ground) is conducted, and the result is presented in Table 1. The catch characteristic parameter consists of species, family, trophic level, trophic level group, habitat, and fishing vulnerability level. Statistical similarity analysis is presented to test differences in catch parameters and size groups of cantrang vessels.
*,** Result of one-way analysis of similarity (ANOSIM) between the biomass of ecological catch parameters and vessel size group is statistically significant level : p<0.05; p<0.001.
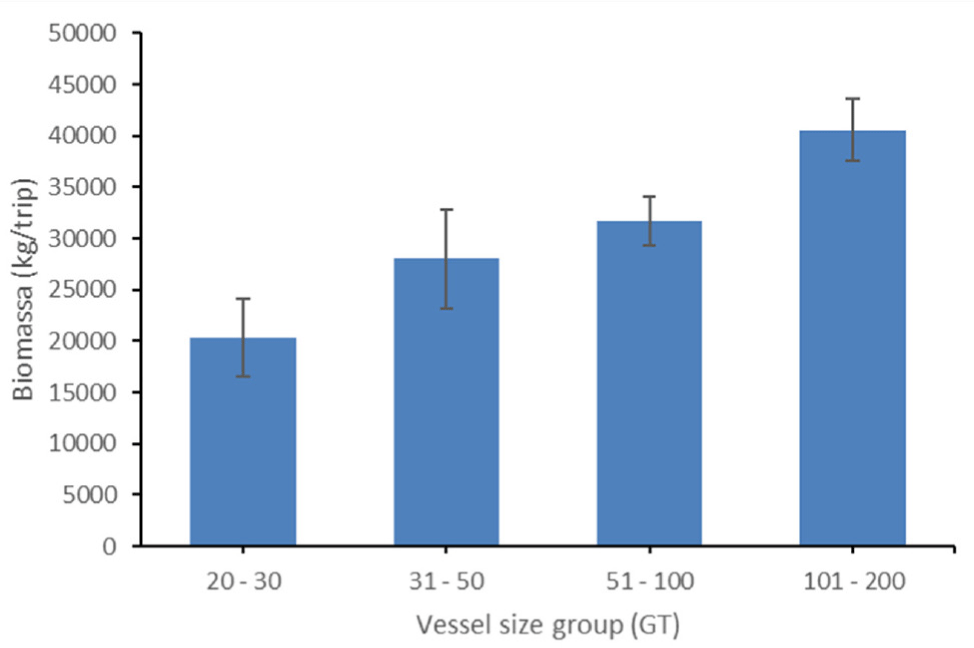
The biomass of landed fish from different group sizes of cantrang at Tegalsari Fishing Port is presented in Fig. 3; The lowest biomass resulted from cantrang ranging from 20 to 30 GT, where the average biomass was 20,339.38 kg/trip. For cantrang group vessel size 31–50 and 51–100 GT the average catch biomass was 27,967.67 and 31,732.99 kg/trip, respectively. The catch biomass from cantrang 101–200 GT was 40,579.61 kg/trip. This showed that the larger vessel size resulted in higher total catch biomass.
In this study, cantrang catches were categorized into 13 TL, which consist of two groups (low and high TL of the catch) according to the convention on biological diversity (CBD) criteria (CBD, 2004). Low trophic level catches range from TL 2.7 to 3.8 (see Fig. 4), and high trophic level from TL 3.9–4.5 (Fig. 5). Trophic level 2.7, which corresponds to Loligo spp., made up the largest proportion of catch biomass about 34.41–43.18% of the total catch for all cantrang vessel sizes (as shown in Table 1). In particular, the largest catch of 8,069.17 kg/trip of TL 2.7 was recorded from cantrang size of 101–200 GT. According to Stergiou et al. (2007), TL 2.1–2.9 are omnivores with a preference for plants. The most dominant trophic level was TL 4.4 (Carangoides chrysophrys), which made up 14.25% and was contributed by cantrang 20–30 GT and 31–50 GT sizes, followed by TL 3.6 (Nemipterus nematophorus), which made up 12.56% and was contributed by cantrang sizes of 51–100 GT and 101–200 GT (Table 1). According to Stergiou et al. (2007), TL 3.0–3.7 is classified as an omnivorous species with a preference for animals. Multivariate analysis revealed a significant difference in the distribution of catch TL among the different cantrang vessel size groups (ANOSIM R = 0.094, p = 0.034).
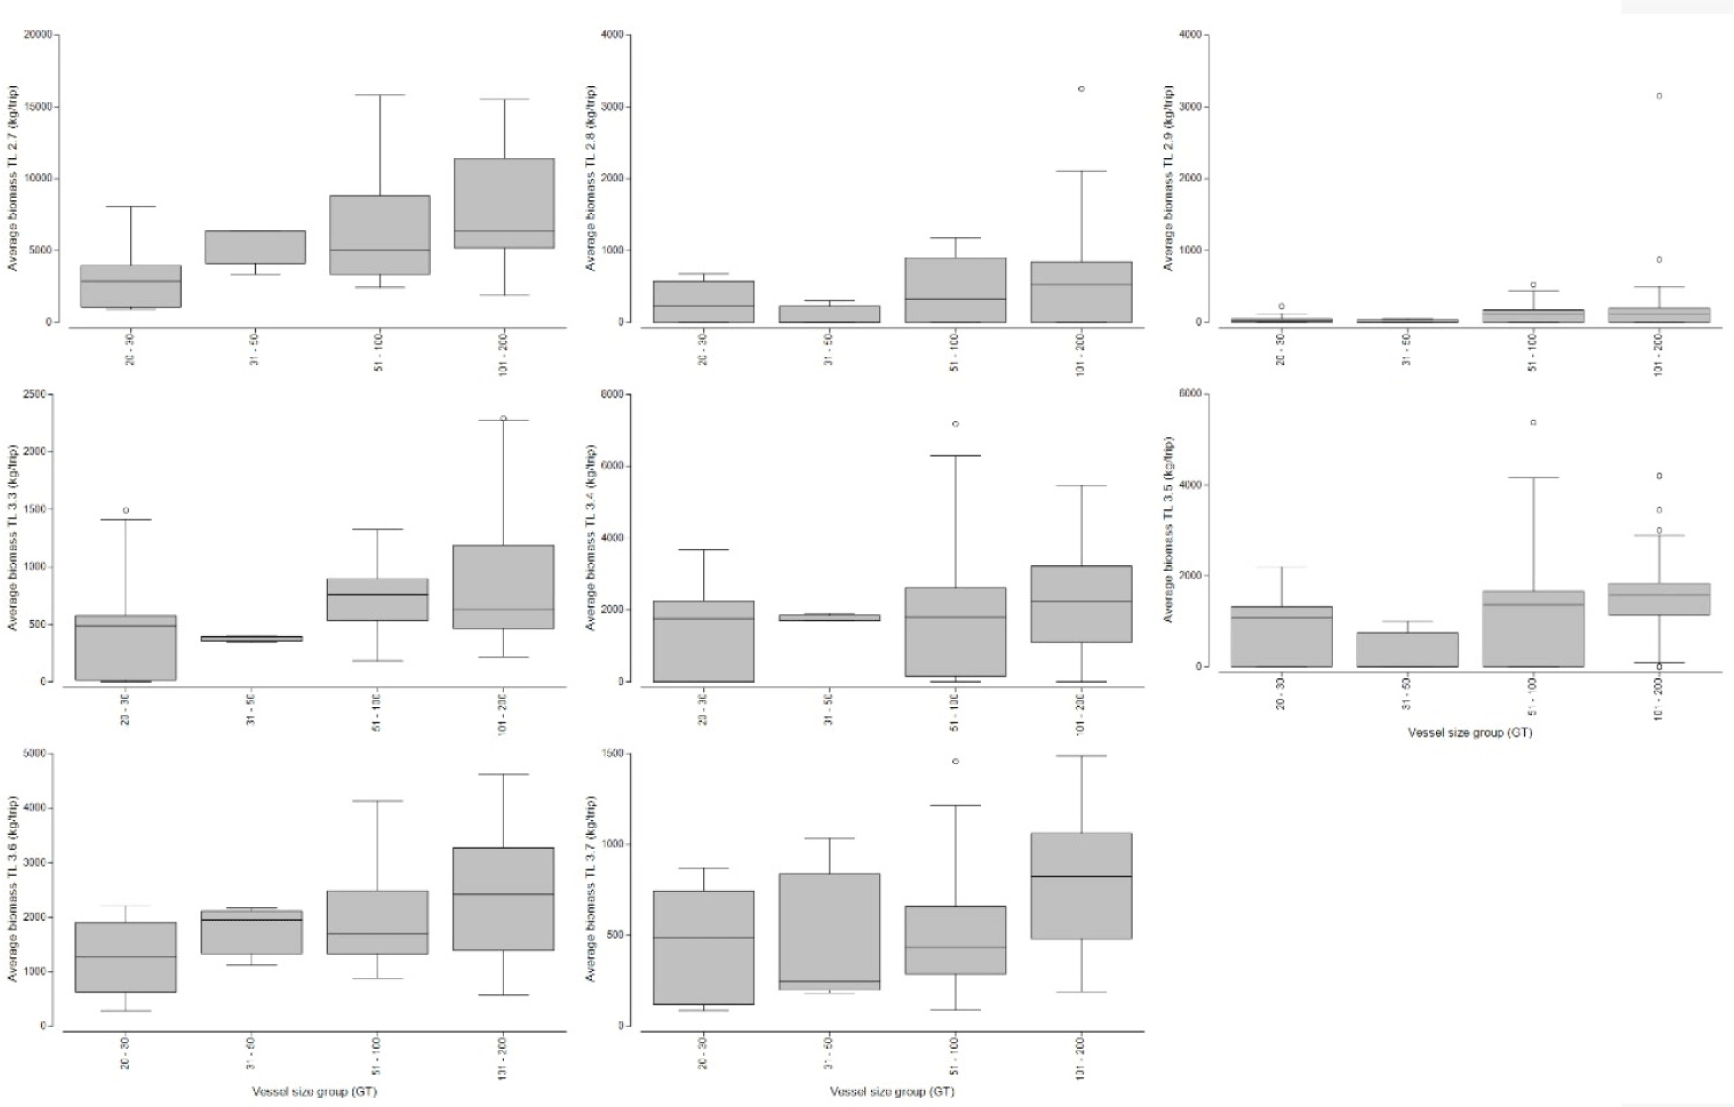
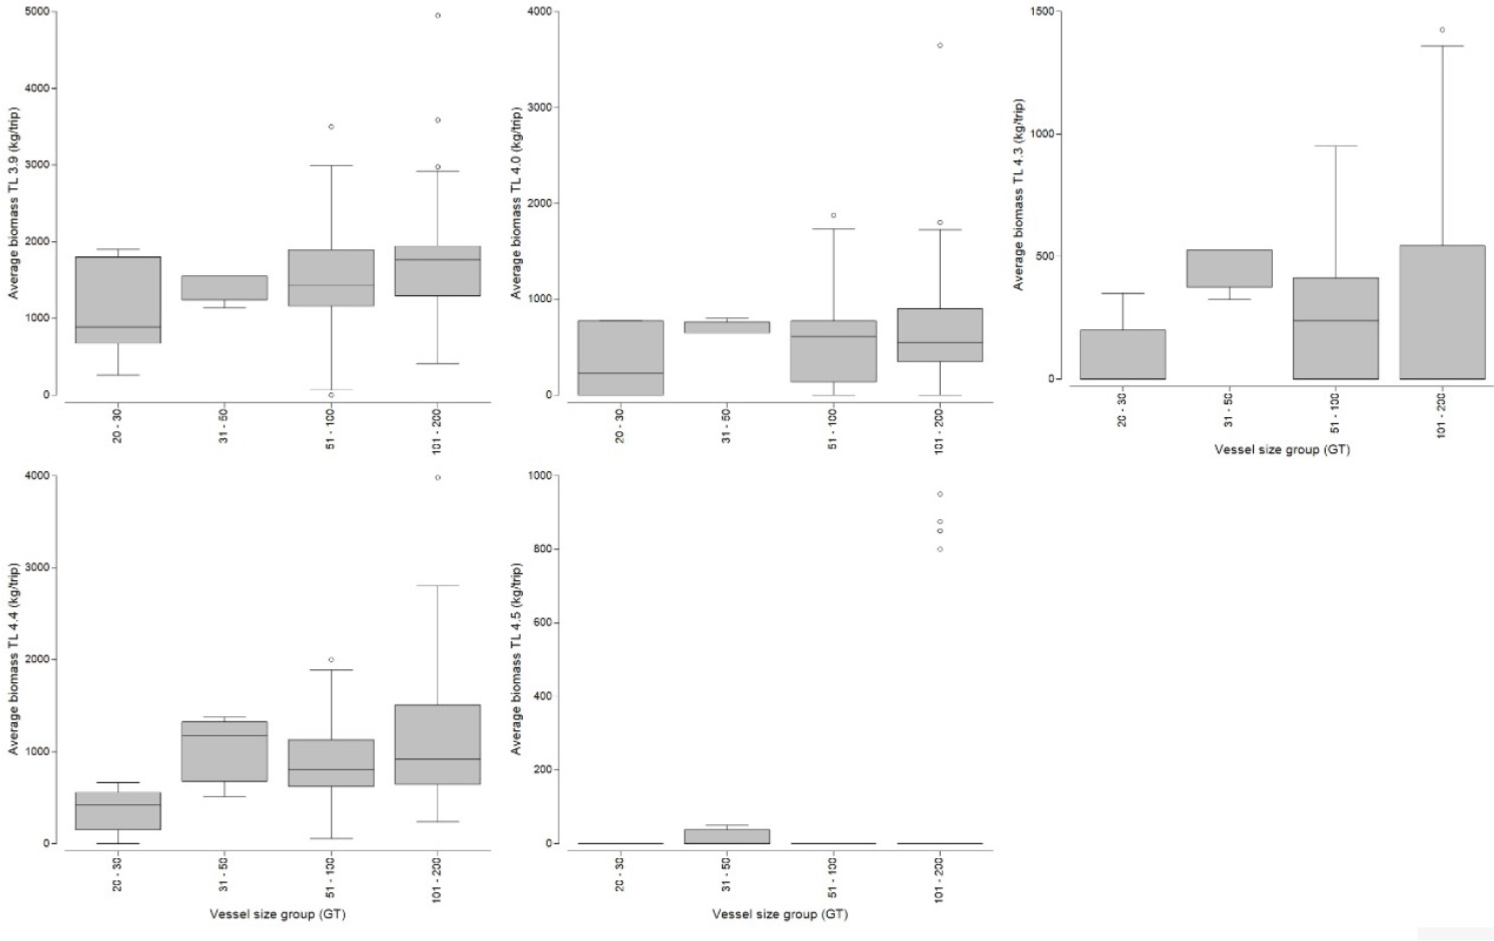
Fig. 6 illustrates the distribution of cantrang catches by fleet size group in habitat types, comprising demersal, reef associates, pelagic, and benthopelagic fishes. Variability was observed in the composition of dominant catches by habitat, particularly between reef associates and demersal fishes. The main demersal fish species captured by cantrang vessels were Loligo spp., N. nematophorus, and Scolopsis taenioptera (Table 1 and Fig. 6). The reef-associate fish group, including C. chrysophrys, Caesio spp., and Priacanthus hamrur, is also depicted in Table 1 and Fig. 6. The habitat type of the catches and vessel size groups demonstrated a statistically significant difference, as indicated by the ANOSIM analysis, with an R-value of 0.109 and a p-value of 0.016.
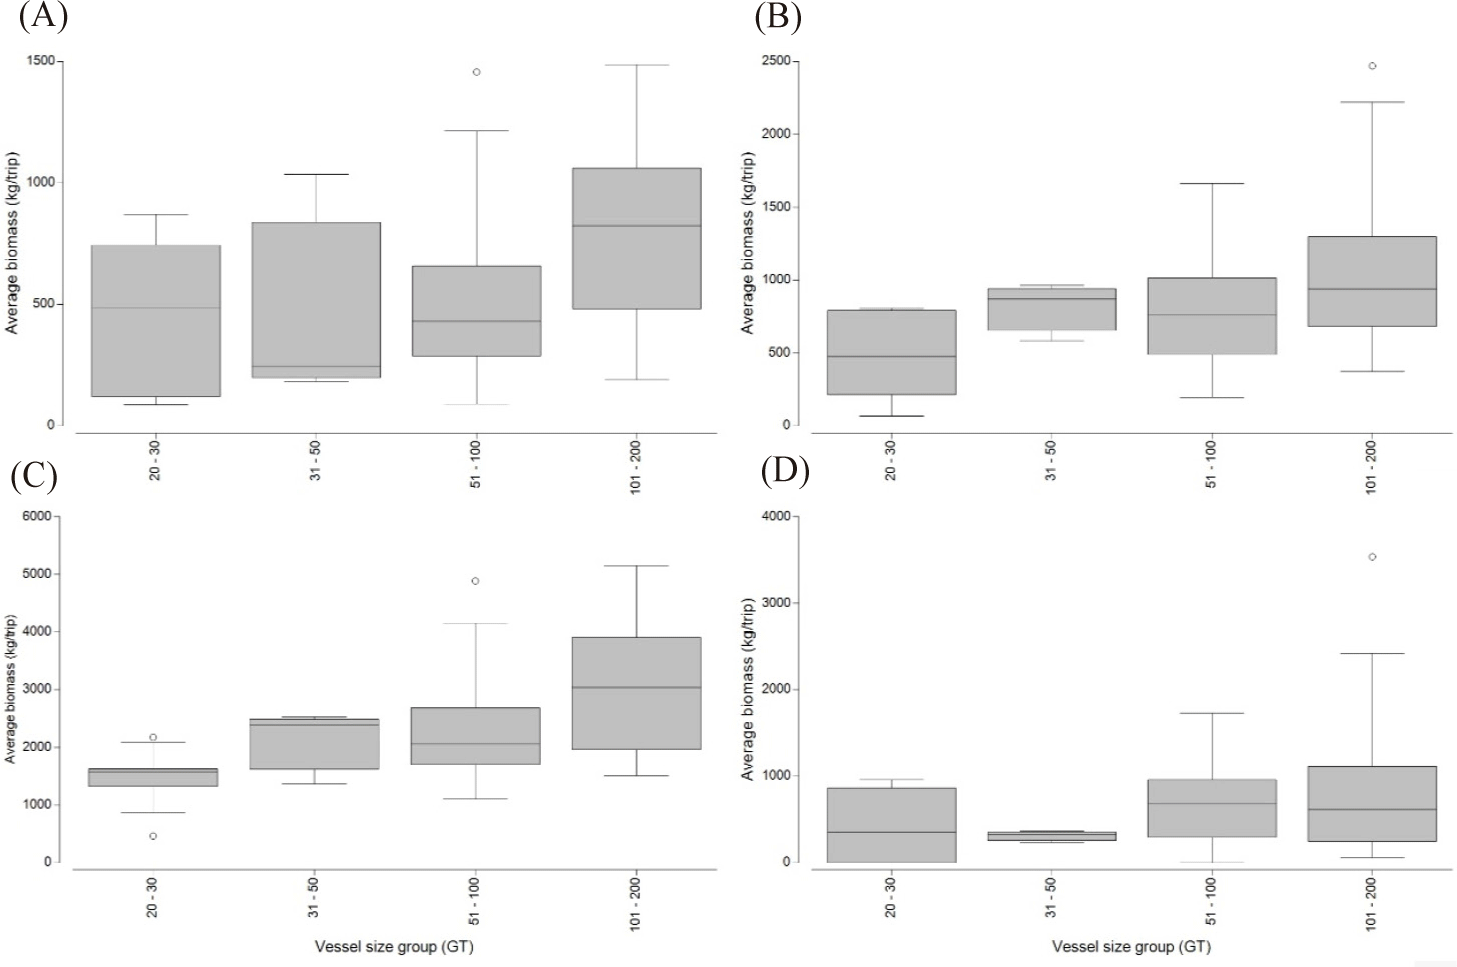
In detail by vessel size, the catch of 20–30 GT cantrang vessels was dominated by reef-associated fish with average biomass of 907.14 kg/trip, followed by demersal fish, while the lowest catch was benthopelagic fish with average biomass of 91.67 kg/trip. In the case of the 31–50 GT vessels, the highest catch was demersal fish, with an average biomass of 1,248.96 kg/trip, and the lowest was pelagic fish, with an average biomass of 218.75 kg/trip. For the 51–100 GT of vessels, the highest was reef associated with an average biomass of 1,363.01 kg/trip and the lowest was benthopelagic, with an average biomass of 272.32 kg/trip. The catch of 101–200 GT vessels consisted primarily of reef associates with a biomass of 1,680.59 kg/trip, followed by demersal fish with 1,656.3 kg/trip, and the lowest biomass from benthopelagic fish at 300 kg/trip.
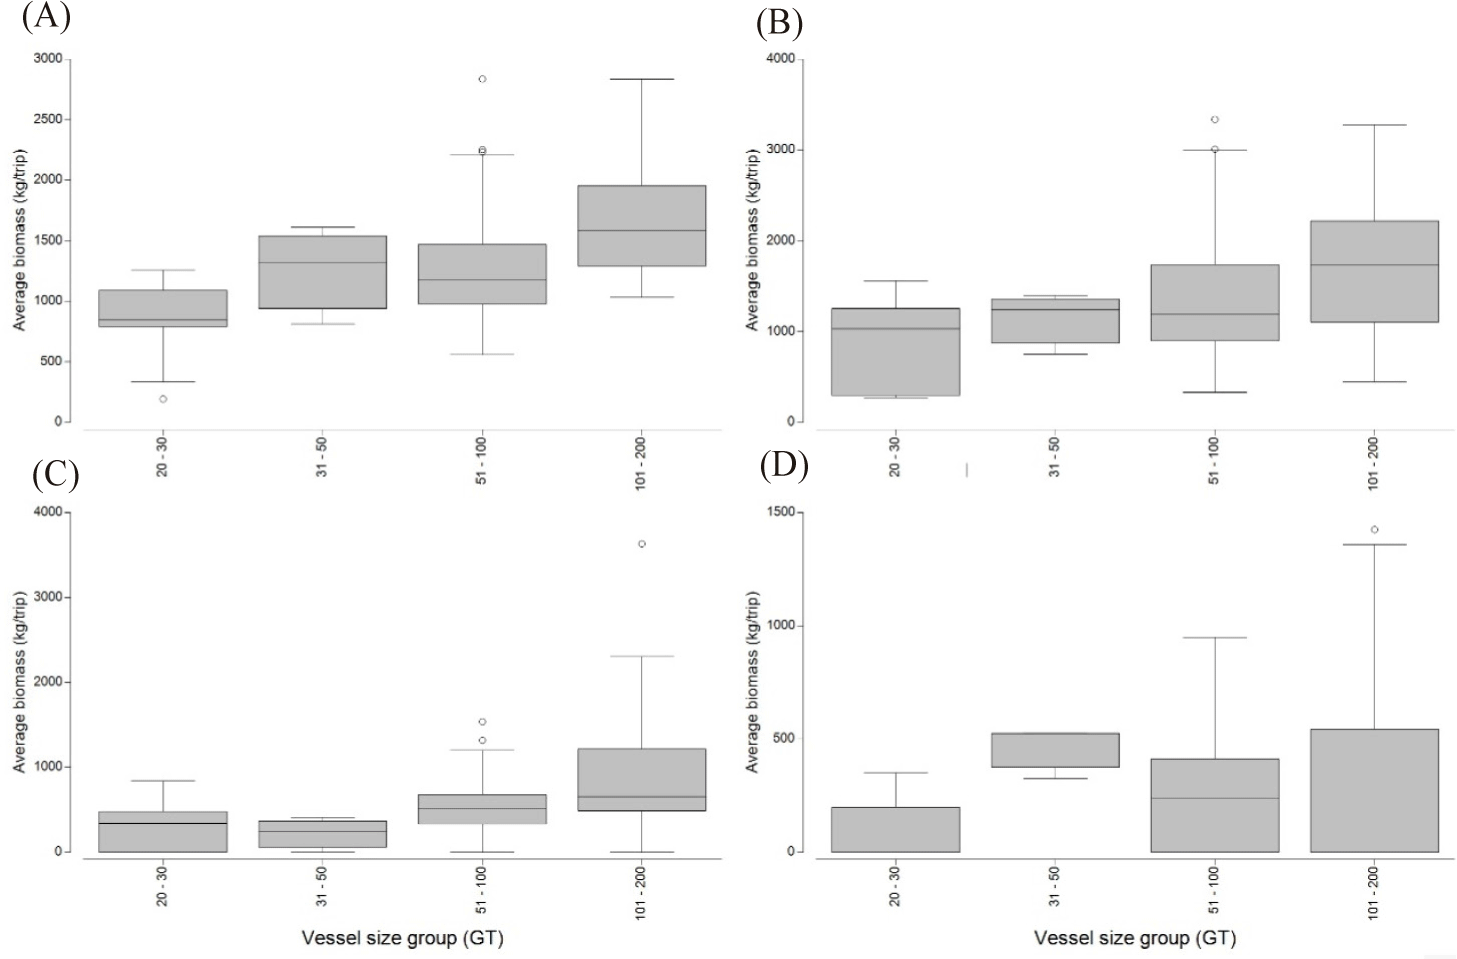
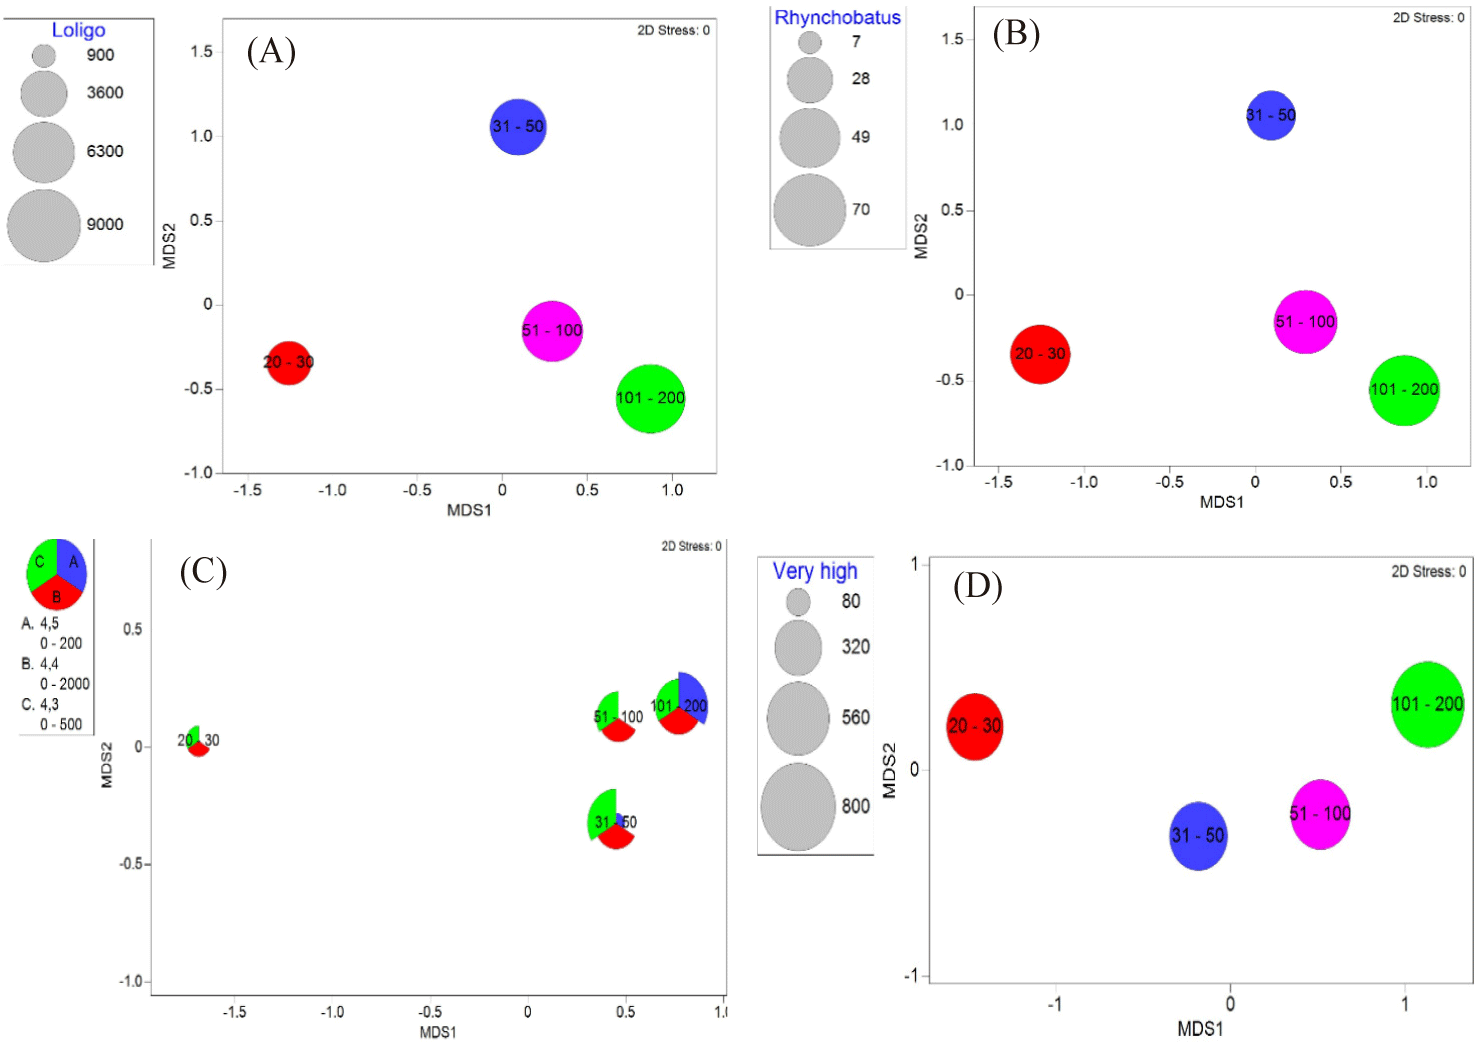
The categorization of cantrang catches based on their level of fishing vulnerability consisted of four classifications: very high, high, moderate, and low vulnerability (Cheung et al., 2005; Froese & Pauly, 2024). The catches of all cantrang vessels were dominated by fish species with low vulnerability levels, such as Loligo spp. and N. nematophorus. The average catch biomass of the cantrang vessels sizes of 20–30, 31–50, 51–100, and 101–200 GT for the low vulnerability fish group was 1,457.50, 2,092.17, 2,362.05, and 2,934.19 kg/trip, respectively (Fig. 7). Statistically, there was a highly significant difference in catch by fishing vulnerability level and vessel size (ANOSIM R = 0.116, p = 0.01). Meanwhile, the biomass of very high vulnerability species such as Rhynchobatus sp. (Wedgefish), Maculabatis gerrardi (Sharpnose stingray), and Netuma thallassina (Giant catfish), was primarily contributed by 101–200 GT vessels with a total of 768.48 kg/trip, and the lowest by 20–30 GT, amount to 465.88 kg/trip. This suggests that the larger the size of the cantrang vessel, the greater the biomass of very high vulnerable fish species caught.
Discussion
This is the first peer-reviewed study to provide comprehensive characteristics of the cantrang’s catches (taxa, trophic level, habitat, and fishing vulnerability) to evaluate the impact of the cantrang on the ecosystem considering the different groups of vessel sizes. The size of the cantrang vessels demonstrated a significant correlation with the spatial distribution of the fishing grounds. The larger the vessel, the farther the fishing ground. Covering all sizes and fishing grounds can indirectly evaluate the state of fish resources in the Java Sea because cantrang targets various fish species based on their habitat distribution.
The findings of this study demonstrate that cantrang exhibit non-selective fishing gear (Table 1), which exploits almost all species of fish and catches a high species diversity (Figs. 2 and 8), various TL (Figs. 4, 5, and 9B), and fish from all habitats (Fig. 6). According to the FAO (2024), a seine net is typically deployed from a vessel to encircle a target area. It is then towed, allowing for the capture of both pelagic and demersal fish species. Specifically, cantrang mainly targets demersal fish by being placed on the bottom of the sea, which is arranged in a circle and gradually closed by towing, and the fish there are taken to the ship. However, the current study revealed that the modified cantrang targeted all fish habitat groups. This is because the cantrang is operated by sweeping the water column and the bottom of the fishing ground. Cantrang has been modified by local fishers in Indonesia as an alternative to trawl; thus, it can be categorized as a mini trawl (Adhawati et al., 2017a; Sasmita, 2013; Wijayanto et al., 2019a).
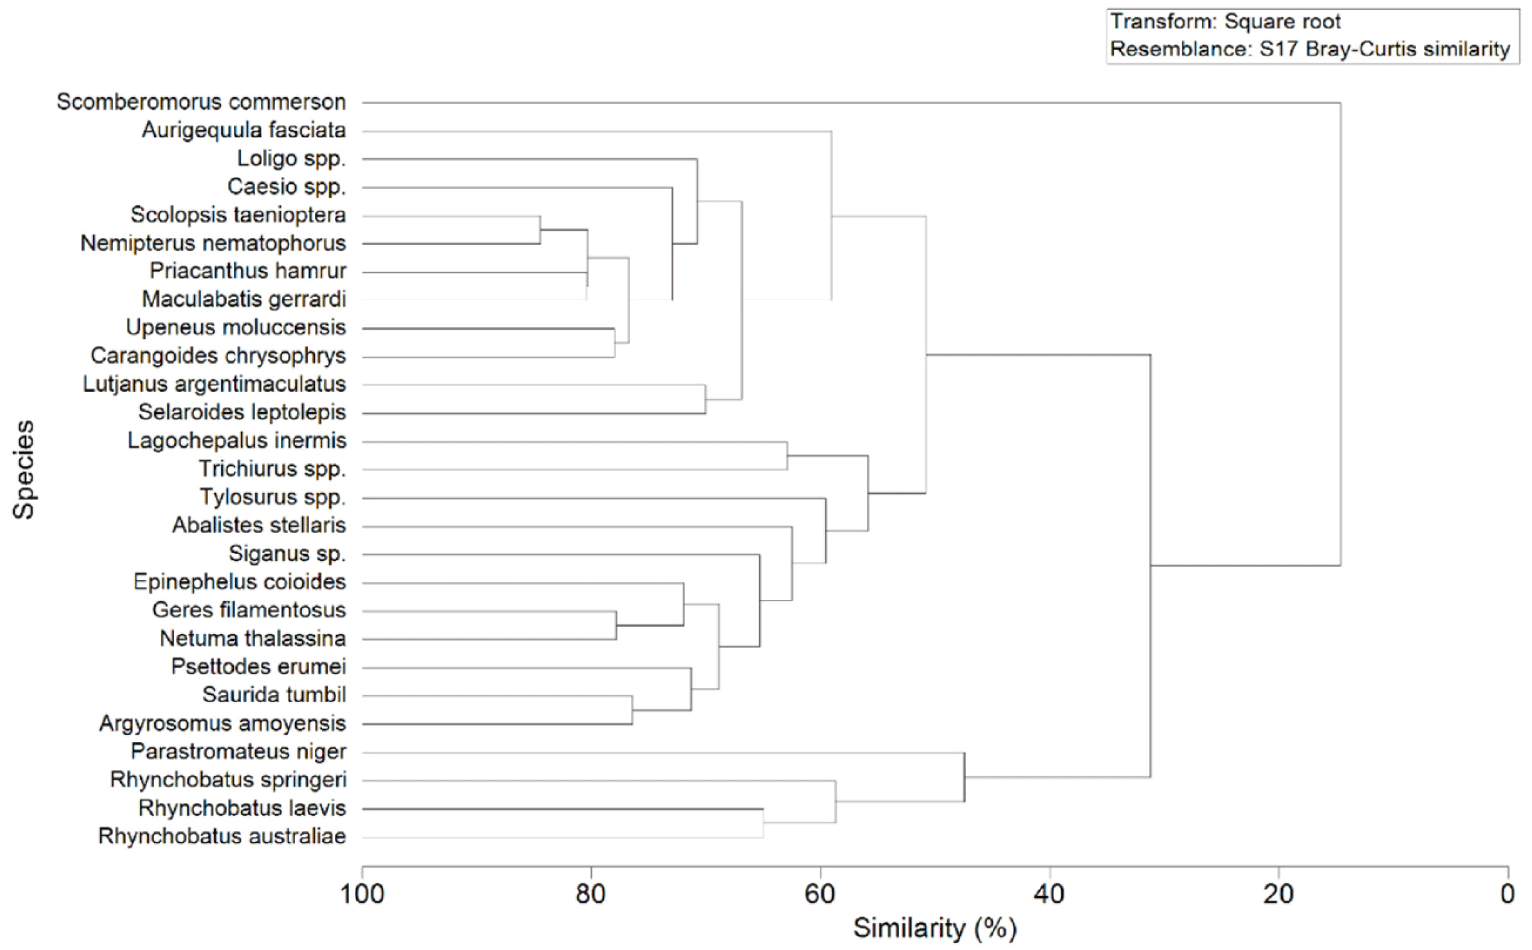
In general, the dominant fish species caught by the cantrang have high similarity (70%), as presented in Fig. 8. These species included Loligo spp., Caesio spp., S. taenioptera, N. nematophorus, P. hamrur, M. gerrardi, Upeneous moluccensis, C. chrysophrys, Lutjanus argentimaculatus, and Selaroides leptolepis. Triharyuni et al. (2013) revealed that Priacanthus sp., Nemipterus sp., Lutjanus sp., were the dominant catches of cantrangs in the Java Sea. Similarly, Imron et al. (2021) demonstrated that the catch of cantrang landed at Tegalsari fishing port was dominated by Loligo sp., Lutjanus sp., Geres sp, and rays (Himantura gerardi), while Wijayanto et al. (2019a), showed that Nemipterus sp., Priacanthus sp., Lutjanus sp. dominated the catch of cantrang at that location.
However, in contrast to previous studies, which have indicated that the catch of cantrang was dominated by demersal fish (e.g., Imron et al., 2021; Triharyuni et al., 2013; Wijayanto et al., 2019b), this study found that reef- associated fish also became a dominant target group. Moreover, no research has yet analyzed the impact of cantrang catches on trophic and fishing vulnerability levels.
Squid (Loligo spp.) was the most dominant catch of all cantrang vessel sizes. The catch volume is directly proportional to the vessel size and fishing ground (Fig. 9A). Squid lives demersal, with a trophic level of 2.7. This animal lives at a depth of 30–170 m and has a short lifespan and low vulnerability. In the Java Sea, squid used to be caught by squid jigger. The plausible reason that the dominant catches of squid by cantrang was influenced by the peak season of squid in February (Imron et al., 2021). Additionally, according to the Fishery Statistical Bulletin of Southeast Asia, squid landings in Indonesia increased by 20% from 2015 to 2019, making squid the fourth largest product in Indonesia (SEAFDEC, 2024). The increase in squid landings in recent decades is due to fishers shifting the target to squid, because other fish stocks are decreased by overfishing (Caddy & Rodhouse, 1998; Coll et al., 2013). Consequently, squid stocks in the Java Sea have indicated a ‘fully exploited’ status (MMAF Decree No. 19, 2022).
The co-dominant species were N. nematophorus (trophic level 3.7, low fishing vulnerability), S. taenioptera (demersal, trophic level 3.9, low vulnerability), and C. chrysophrys (reef associate, trophic level 4.4, medium vulnerability). N. nematophorus and S. taenioptera inhabit demersal tropical waters with depths of 2–75 m, whereas adults of C. chrysophrys live in open waters of coastal reefs, and juveniles occur in inshore areas, including estuaries (Froese & Pauly, 2024). Therefore, C. chrysophrys juveniles are mostly caught by 30–50 GT cantrang vessels operating in inshore areas.
The largest fishing vessel groups (101–200 GT) of cantrang exploited the highest biomass of top predator species than the smaller vessels (Fig. 9B). Similarly, the highest biomass of the very highly vulnerable species group was exploited mainly by the largest fishing vessel group compared to smaller ones (Fig. 9D). This phenomenon is likely attributable to the larger vessels’ increased fishing intensity and expanded fishing grounds, which also habitats for highly vulnerable species and top predators, such as Rhynchobatus sp. (Wedgefish), M. gerrardi (Sharpnose stingray), and Netuma thallassina (Giant catfish). The behavior and life history of fish play important roles in determining their susceptibility to fishing. Factors such as swimming speed and escape responses determine a fish’s ability to avoid nets (Jennings et al., 2001). Additionally, the habitat of the fish also influences its vulnerability to fishing. Fish taxa with late maturity, slow growth, large body size, and low potential rates of population increase are particularly vulnerable to the impact of intensive fishing. Cheung et al. (2005) developed a fishing vulnerability level based on classical (Boolean) sets to categorize life history and ecological characteristics into distinct classifications and the criteria that linked them to varying degrees of intrinsic vulnerabilities.
Furthermore, although most of the captured fish species have low fishing vulnerability, there are still several species that include very high vulnerability and high trophic level fish such as Wedgefish (Rhynchobatus laevis, Rhynchobatus australiae, Rhynchobatus springeri) that have been listed as endangered, threatened, or protected (ETP) with ‘critically endangered’ status since 2018, and whitespotted whipray (M. gerrardi) that has been listed as ‘endangered’ since 2020 (IUCN Red list). According to Compagno & Last (1999), R. springeri inhabits pelagic neritic at depths of 16–37 m, while R. australiae is a marine demersal fish from 0 to 60 m. These carnivorous animals feed on bottom crustaceans, mollusks, and bottom-dwelling fishes. Thus, they are vulnerable to being caught by cantrang, trawl, longline, and demersal tangle nets. The current study highlights the significant negative impact of cantrang on protected marine species (Wulandari et al., 2021).
The results of this study confirm that the cantrang is not a selective fishing gear and exploits almost all trophic level groups (Figs. 4 and 5). Fishing, particularly unselective fishing gear such as cantrang, removes organisms from the food web, thus the trophic level and structure of a marine ecosystem can be decreased (e.g., Pauly et al., 1998). The conference of parties to the CBD (2004) has identified the TL-based indicator as a key indicator for measuring biodiversity changes and listed the marine trophic index (MTI). The MTI, using a minimum threshold TL value of 3.25, excluded forage fish and smaller organisms (Pauly & Watson, 2005). Shannon et al. (2014) proposed a TL threshold of 4.0 to evaluate changes within the apex predator due to TLs above 3.25 still subject to large natural fluctuations in the abundance of small and medium pelagic fish. The current study showed that cantrang caught abundant fish at all TL, especially at TL 2.7 and 3.6. Additionally, catches above TL 4.0 were dominant in the largest-sized vessels (101–200 GT), as shown in Fig. 9. The high catch of apex predators by cantrang, carried out intensively in the Java Sea, has threatened the sustainability of ecosystem functions. The abundance of squid and low trophic level catches indicate apex predator pressure in the Java Sea ecosystem. Management measures are required to control cantrang operations in the Java Sea (Budiarti et al., 2024).
The fishing vulnerability of the catch can be influenced by the size and construction of fishing vessels, as well as the operating depth of the fishing gear (de Juan et al., 2020). Additionally, the deeper waters tend to have a higher number of fish in the very high vulnerability category. Understanding these vulnerability levels is crucial for effective fisheries management and for assessing the impact of fishing on targeted species (de Juan et al., 2020; Halpern et al., 2007). In addition to fishing activities, climate change affects the vulnerability of fish resources. Rising temperatures owing to climate change can alter the environmental conditions of aquatic ecosystems, significantly affecting fish production (Bueno-Pardo et al., 2021).
The Government of Indonesia has addressed the negative impact of cantrang on fish resource sustainability by issuing a ban through MMAF Decree No. 2/2015. Despite amendments and modifications, most recently, through MMAF Decree No. 36/2023, cantrang fishing gear for vessels over 30 GT can only be operated in the Java Sea (FMA 712) with specific requirements for cod-end mesh size, upper ris rope length, and warp rope length. Specifically, cantrang for vessels over 30 GT can be operated in the Java Sea (FMA 712) with a cod-end mesh size of at least 2 inches using a square mesh, an upper ris rope length of no more than 90 meters, and a warp rope length of no more than 900 meters per side. To ensure the effectiveness of these regulations, consistent law enforcement and increased awareness among fishers about the negative impacts of cantrang on fish resource sustainability are necessary, particularly in the Java Sea.
Conclusion
This study confirms the significant impact of cantrang on marine ecosystems based on catch characteristics. There is variation in the catch biomass of species, trophic level, habitat, and fishing vulnerability level with vessel size. The dominant cantrang catches consisted of the reef-associated and demersal fish groups. Although most of the catch comprises fish groups with lower TL and low fishing vulnerability, the gear also captures many highly vulnerable species and top predators, including ETP species. Larger vessel sizes catch significantly higher biomass for each ecological group of fish species due to fishing grounds, intensity, and trip duration. Therefore, the Indonesian government’s regulation through MMAF Decree No. 36/2023, which has ban cantrang and mandated its replacement with sustainable and legal fishing gear, needs to be implemented effectively through increased fisher awareness, improved welfare of the fishers, and effective law enforcement.