Introduction
The genus Nemipterus, commonly known as kurisi fish in Indonesia, represents a significant economic and ecological asset within the tropical Indo-Pacific region. It is positioned among Indonesia’s principal export commodities, particularly evident in the form of headless and eviscerated frozen fish products. The fine texture and attractive white hue of Nemipterus flesh render it a vital raw material for the surimi industry, which manufactures high-demand products, such as kamaboko and crabsticks, targeted primarily at the Japanese market (Guenneugues & Ianelli, 2013). In addition to its economic significance, Nemipterusfurcosus plays an indispensable role in sustaining the equilibrium of marine ecosystems. Functioning as both a predator and prey within demersal trophic networks, it exerts regulation over populations of smaller fish and invertebrates while simultaneously supporting larger predatory fish, thus facilitating nutrient cycling and energy transfer within Southeast Asian marine environments (Ghosh et al., 2023; Song et al., 2020). Its ability to thrive in a diverse array of habitats, ranging from shallow coastal areas to deeper seabeds, highlights its resilience and ecological relevance, particularly in light of anthropogenic challenges such as overfishing and habitat degradation (Miller et al., 2009).
Nevertheless, the delineation of species within the Nemipterus genus presents considerable challenges due to substantial morphological convergence among its congeners. Traits such as fin morphology, body conformation, and pigmentation frequently result in misidentification, even among proficient taxonomists (Garces et al., 2006; Hamuna et al., 2020). For example, species such as Nemipterusjaponicus and Nemipterustambuloides exhibit subtle morphological differences, often resulting in erroneous taxonomic classifications (Imtiaz & Naim, 2018). The presence of cryptic diversity further complicates the identification process, as genetically distinct taxa may demonstrate morphological uniformity (Ramadhaniaty, 2024). Environmental influences, comprising salinity, temperature variations, and ecological situations, enhance phenotypic plasticity, consequently heightening the challenges connected with taxonomic detail (Fitzpatrick et al., 2012; He et al., 2021). These complexities hinder biodiversity assessments and sustainable fisheries management in regions such as Indonesia, Malaysia, and Thailand (Fitriya et al., 2021).
DNA barcoding represents a highly effective methodology for addressing the challenges associated with species identification. Through the examination of brief genetic sequences, specifically those derived from the cytochrome c oxidase subunit I (COI) gene, this approach facilitates accurate differentiation among species, even in instances characterized by cryptic diversity (Blaxter, 2003; Bhattacharya et al., 2016). Despite its widespread application in countries like India and Malaysia, the use of DNA barcoding in Indonesia is still notably limited (Hakim et al., 2019; Seah et al., 2016). The predominant focus of research has concentrated on reef fish or species inhabiting open ecosystems, whereas fish markets—critical reservoirs of biodiversity—have not received adequate scholarly attention (Jefri et al., 2015; Triandiza & Madduppa, 2018). These markets function as essential centers for the exploration of biodiversity, providing access to a wide array of species from various ecosystems while circumventing the logistical difficulties inherent in field surveys (Aura et al., 2019; Zhou et al., 2010).
The Muara Baru fish market in Jakarta is a prime representation of the capacity of fish markets to operate as focal points for biodiversity research. By aggregating catches from various regions of Indonesia, it offers a distinctive platform for the examination of species diversity, population dynamics, and the risks associated with overfishing (Brooks et al., 2016; McIntyre et al., 2016). The market’s significance transcends research alone, as it promotes community awareness regarding sustainable fishing practices and contributes to the formulation of conservation strategies (Doherty et al., 2021; Gillespie & Vincent, 2019). Regardless of its crucial importance, systematic inquiries focused on Nemipterus species in this market remain deficient, consequently fostering a significant research absence in the context of Indonesia’s biodiversity and fisheries resource management.
This study aims to address current shortcomings by integrating morphological analysis with DNA barcoding methodologies to enable the identification of N. furcosus within the Muara Baru fish market. Through the synthesis of these synergistic methodologies, the study yields precise species identification and establishes foundational data regarding the diversity of Nemipterus in Indonesia. The outcomes emphasize the critical role of fish markets within the framework of biodiversity research and exemplify the success of integrative strategies in promoting sustainable fisheries management and conserving biodiversity.
Materials and Methods
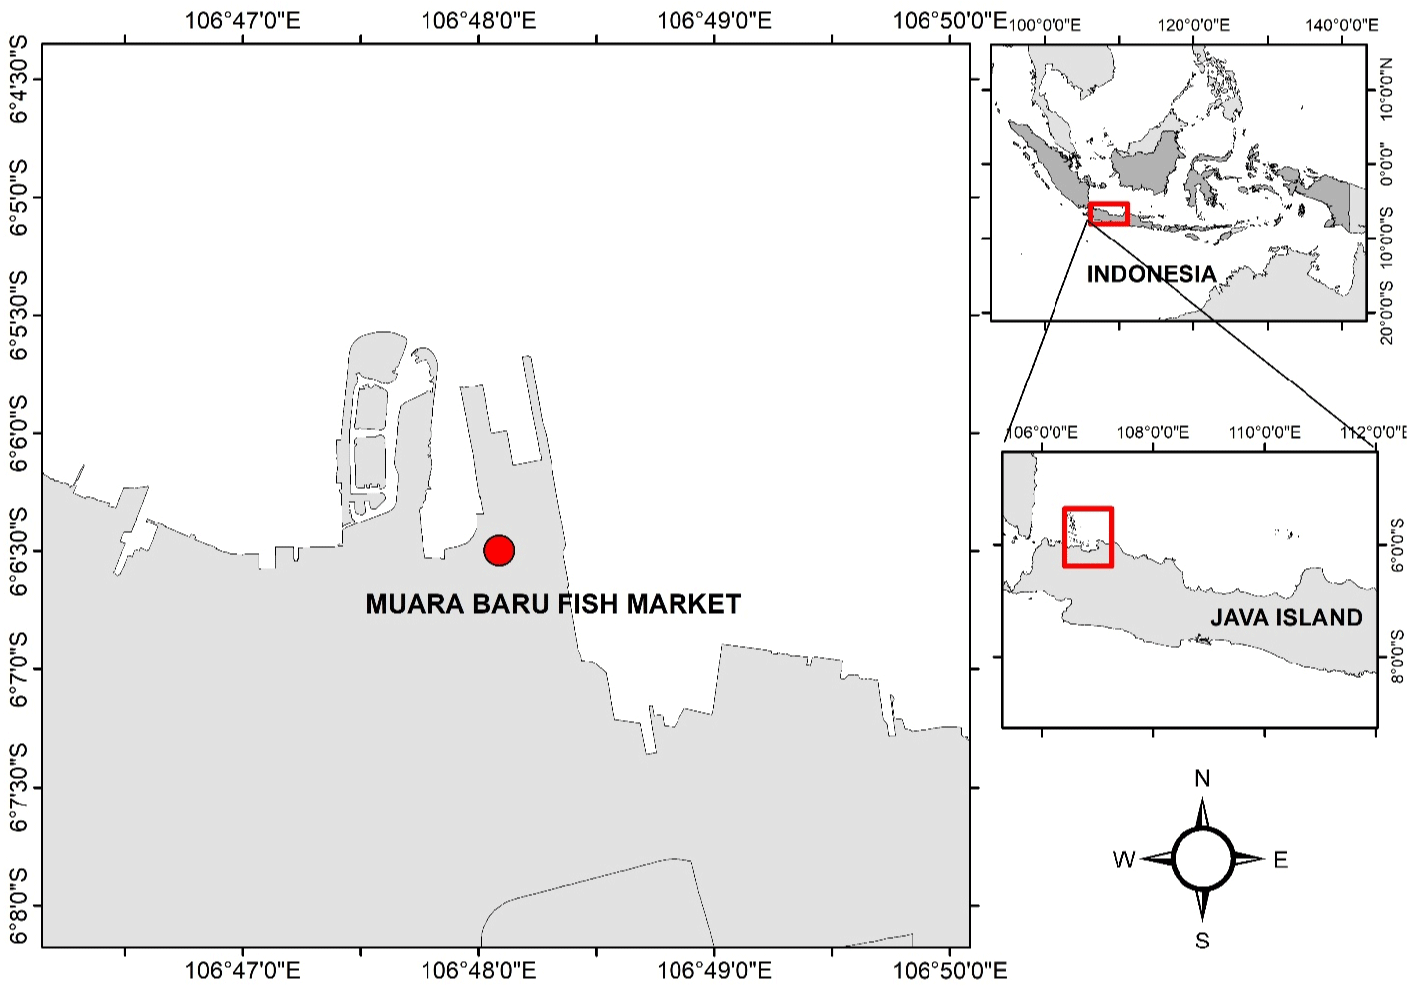
The study was conducted at the Muara Baru traditional fish market in Jakarta, Indonesia, located at coordinates 6° 6’ 34.46” S and 06° 48’ 5.31” E (Fig. 1). As one of the largest fish markets in Indonesia, Muara Baru serves as a central hub for marine species sourced from various regions across the country. Sampling was conducted on 5 October 2019, focusing on peak trading hours (6:00–10:00 AM) to ensure the availability of fresh fish specimens.
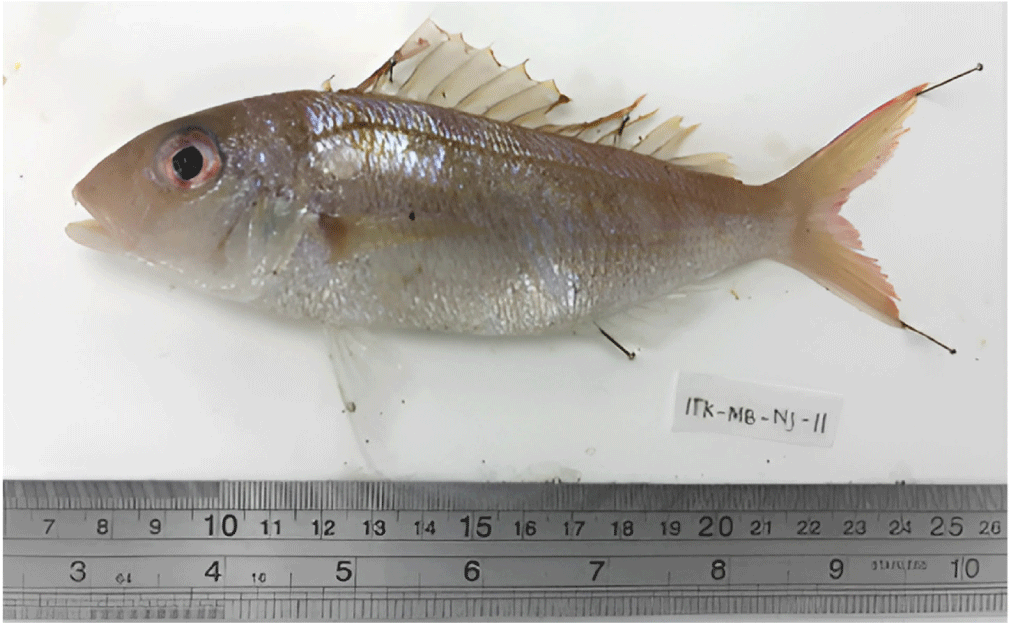
Thirty fish specimens were randomly collected from the fresh fish section of the market, representing a range of sizes and avoiding visible damage or spoilage. To maintain sample integrity, specimens were handled using clean gloves and gently rinsed with purified water to remove residues. After rinsing, all specimens were stored in a coolbox filled with crushed ice, ensuring the preservation of their freshness and structural integrity during transportation to the laboratory. Coolbox temperatures were regularly monitored to ensure stability. Upon arrival at the laboratory, the specimens were processed immediately for morphological and molecular analyses to prevent degradation (Fig. 2). Due to the nature of market sampling, the exact geographic origins of the specimens could not be traced. This limitation is acknowledged and considered in the interpretation of results. Future studies should incorporate surveys with fishermen or sellers to trace specimen origins more accurately, providing a broader context for biodiversity assessments.
Morphometric measurements were performed on the left side of each fish, adhering to standard ichthyological protocols. A total of 12 discrete morphometric landmarks were systematically identified and quantified to aid in the differentiation of N. furcosus from its congeners, adhering to recognized methodologies for morphometric studies (Seah et al., 2016; Fig. 3). These landmarks, including total length (TL), standard length (SL), body depth, and fin lengths (pectoral, pelvic, dorsal), are critical for distinguishing N. furcosus due to their established relevance in capturing interspecific morphological variations within the genus (Imtiaz & Naim, 2018; Song et al., 2020).
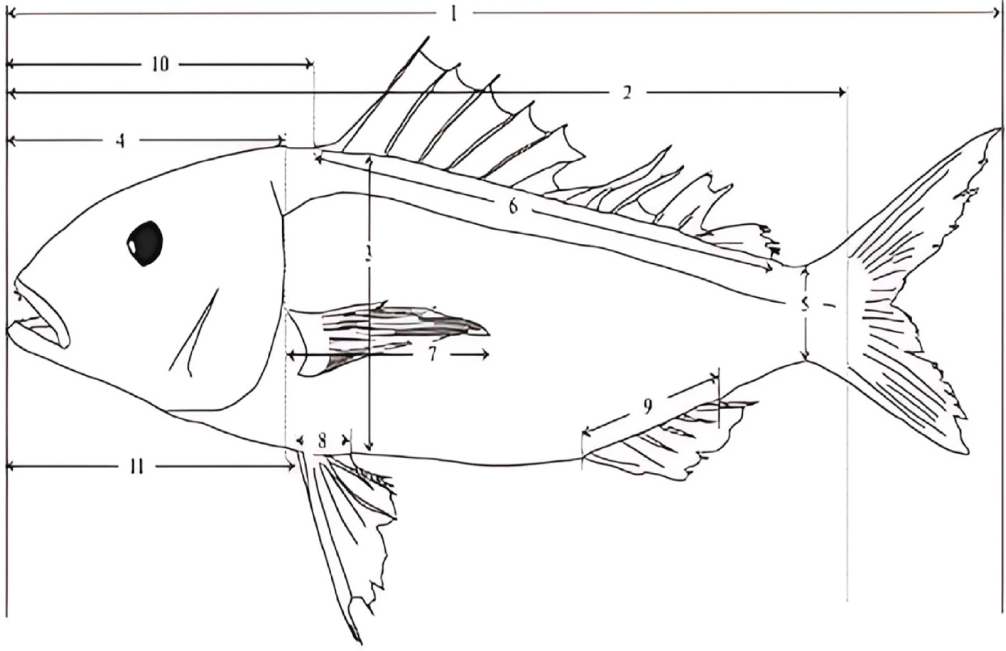
Each landmark was measured using a digital caliper with 0.01 mm precision. To ensure accuracy, all measurements were performed in triplicate, with the mean value recorded. A single trained researcher conducted all measurements following additional training to ensure consistency with established protocols. This process minimized inter-observer variability and enhanced data reliability.
The reliance on morphometric landmarks reflects their practicality and relevance for identifying Nemipterus species in regions where cryptic diversity and phenotypic overlap pose challenges. Although this approach provides reliable results, future research should consider integrating advanced geometric morphometric techniques to improve resolution and further enhance taxonomic precision.
Specimens were photographed on a neutral-colored background with a standard measurement scale for calibration. Images were captured using an 8-megapixel iPhone 6 camera (Apple, Cupertino, CA, USA) mounted on a tripod positioned 50 cm above the specimen. Images were digitized using CorelDraw X7 software (CorelDraw, Ottawa, ON, Canada), and morphometric landmarks were manually plotted for subsequent analysis. The software facilitated accurate landmark placement and automated calculations of distances.
A single muscle tissue sample (~25 mg) was excised from one representative specimen and preserved in 96% ethanol. The sample was stored at –20°C upon arrival at the laboratory. While only one tissue sample was analyzed in this study, future research should expand the sample size to enhance robustness. Rigorous quality assurance measures were implemented to ensure data reliability, including positive and negative controls during polymerase chain reaction (PCR), regular calibration of instruments, and the use of ISO-certified reagents.
DNA was extracted using the gSYNCTM DNA Extraction Kit (Geneaid Biotech, New Taipei City, Taiwan). PCR amplification targeted the mitochondrial COI gene, employing primers designed by Ward et al. (2005): FishF1 (5’-TCAACCAACCACAAAGACATTGGCAC-3’) and FishR1 (5’-TAGACTTCTGGGTGGCCAAAGAATCA-3’). Each reaction contained 12.5 µl MyTaq DNA Polymerase, 1.25 µl of each primer, 9 µl ddH2O, and 0.1 µl DNA template in a 25 µl total volume. PCR conditions included: Initial denaturation at 94°C for 30 sec, 38 cycles of denaturation (94°C for 30 sec), annealing (50°C for 1 min), and extension (72°C for 1 min). Final extension at 7°C for 7 min, followed by cooling to 4°C. PCR products were visualized on 1% agarose gels (120 V, 20 min) stained with GelRedTM. Bands corresponding to the ~650 bp COI gene fragment were sent to. The 1st BASE® (Buona Vista, Singapore) service in Singapore for sequencing.
BLAST searches were conducted on the obtained sequences, with a similarity threshold of 98% set for valid identifications. This threshold ensures reliable species-level identification while accounting for intraspecific genetic variability. Manual cross-referencing was performed for sequences below this threshold to minimize misidentifications. Although only a single DNA sequence was generated in this study, future research should aim to include multiple sequences for robust statistical analyses, such as genetic distance calculations and phylogenetic reconstructions. These methods would provide deeper insights into population structure and evolutionary relationships.
Morphometric data were analyzed to determine the relationship between body length and weight (W) of the fish specimens and to investigate their growth patterns. Morphological identification of the specimens was conducted using the reference book “Identification of Market Fishes of Indonesia” (White et al., 2013). The morphometric measurements were utilized to calculate the length-weight relationship (LWR) using the formula described by (Froese et al., 2011; le Cren, 1951):
where:
W represents the weight of the fish in grams
TL is the total length of the fish in centimeters
a is a constant indicating the intercept,
b is the growth exponent, describing the relationship between weight and length.
To facilitate linear regression analysis, the equation was transformed into a logarithmic Equations (2):
The growth exponent (b) was interpreted as follows:
b=3: Indicates isometric growth, where the weight increases proportionally to length.
b>3: Indicates positive allometric growth, where weight increases faster than length, resulting in a bulkier shape.
b<3: Indicates negative allometric growth, where length increases faster than weight, resulting in a slimmer shape.
The W and TL of each specimen were recorded during the morphological examination. These raw measurements were subsequently transformed into logarithmic values (Log[W] and Log[TL]) to facilitate statistical analysis. A linear regression model was then applied to derive the coefficients aaa and bbb, representing the LWR. To assess the reliability of the regression model, the goodness of fit (R2) was calculated. The resulting growth patterns were further validated by comparing them with reference data available on FishBase, ensuring the robustness and accuracy of the LWRs.
The molecular analysis was conducted to confirm species identification using the COI gene as the target marker, a widely recognized genetic marker for fish species identification. Raw DNA sequences obtained from PCR amplification were first processed and aligned using MEGA 11 software to identify inconsistencies or gaps. Low-quality ends were trimmed to enhance sequence reliability. The cleaned sequences were then submitted to the BLAST system on the National Center for Biotechnology Information platform. This tool compared the sequences against the GenBank database to identify the closest matching species based on genetic similarity. For validation purposes, sequences with a similarity score of 98% or higher were considered reliable identifications. For sequences with lower similarity scores, further manual cross-referencing was undertaken to minimize potential misidentifications. This rigorous approach ensured the precision of species identification while addressing the inherent challenges of morphological and molecular analysis.
The COI sequences acquired from the specimens were systematically aligned and meticulously edited utilizing MEGA 11 software to eliminate low-quality bases and ensure uniformity across the sequences. Pairwise genetic distances were computed employing the Kimura 2-parameter (K2P) model, which is a widely accepted methodology for estimating evolutionary distances in DNA barcoding research. The genetic distances were assessed among populations from Muara Baru and various regional populations, which included those from the South China Sea, Ambon (Indonesia), the Philippines, and Vietnam. Reference sequences corresponding to these geographic regions were extracted from the GenBank database, with their respective accession numbers detailed in Table 1.
In order to deduce the evolutionary relationships among various populations, a neighbor-joining (NJ) phylogenetic tree was meticulously constructed utilizing MEGA 11 software. The analytical framework incorporated genetic sequences derived from the Muara Baru specimens alongside pertinent regional references, employing 500 bootstrap replicates to rigorously evaluate the reliability of the phylogenetic tree. The K2P model was employed to accurately estimate the genetic distances that informed the tree construction process. The resulting phylogenetic tree was visualized to facilitate the identification of distinct clades and elucidate the evolutionary patterns present among the populations.
Results
A total of thirty fish specimens were procured from the Muara Baru contemporary fish market located in Jakarta. The identification of species was conducted based on observable external morphological attributes, including cranial configuration, body pigmentation, and fin morphology. Utilizing the reference text Identification of Market Fishes of Indonesia (White et al., 2013), the specimens were classified as N. furcosus. Notable morphological traits recorded included; A body structure that is moderately elongated and laterally compressed. A caudal fin that is deeply forked with a pointed but not elongated upper lobe. Distinctive coloration patterns, featuring reddish saddle-like stripes in the predorsal region, a red hue on the posterior upper caudal fin lobe, and a white margin on the lower caudal fin, which are in accordance with the descriptions provided by Seah et al. (2016). The specimens exhibited SLs varying from 11.3 to 15.1 cm and weights ranging from 52 to 89 g (Table 3), with the average TL and W recorded as 17.08 ± 1.05 cm and 66.07 ± 9.22 g, respectively. These measurements correspond with prior findings for N. furcosus, which exhibit lengths from 15 to 30 cm and weights from 50 to 500 g, contingent upon environmental factors and the intensity of fishing activities (Perry et al., 2005).
Parentheses in Table 3 show the mean value and SD.
Environmental determinants significantly influence morphometric variations within N. furcosus populations. Fish inhabiting sandy, shallow environments generally display enhanced growth rates due to superior food availability and diminished predation threats in contrast to individuals residing in deeper, mud-laden habitats (Jennings et al., 2001). Furthermore, elevated water temperatures, while promoting growth rates through augmented metabolic activity, may impose constraints on maximum sizes owing to limitations in oxygen availability and stress-inducing factors (Rhodes et al., 2015). Comparative evaluations with populations from Malaysia, Thailand, and the Philippines indicate that fish subjected to intense exploitation tend to be smaller than their counterparts from marine protected zones, thereby highlighting the impact of fishing pressure on population dynamics (Claudet et al., 2008).
These findings accentuate the critical necessity for sustainable fishing methodologies and habitat preservation to uphold the health and sustainability of N. furcosus populations. Subsequent research endeavors should encompass extensive regional comparisons and genetic examinations to further elucidate the factors influencing growth patterns throughout Southeast Asia.
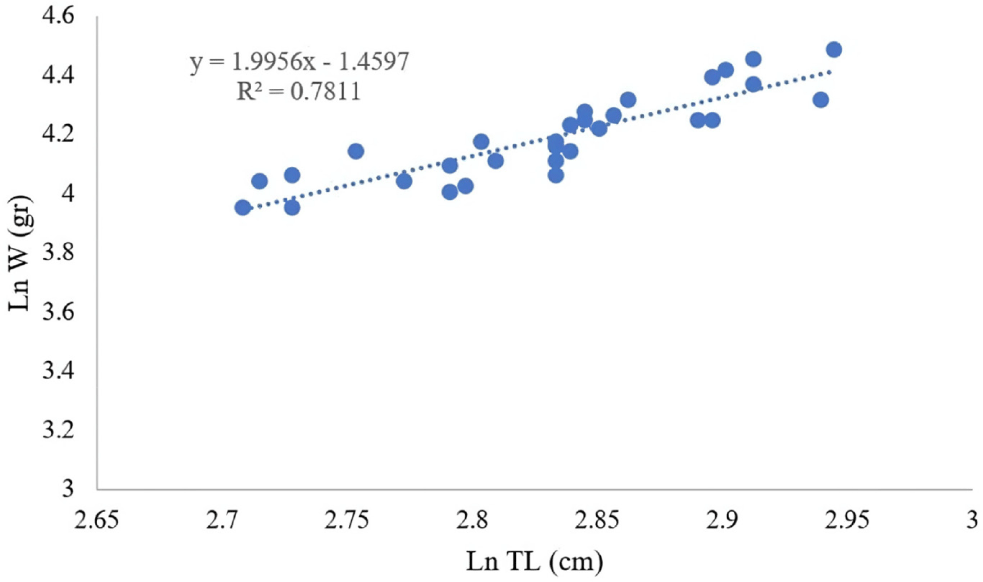
The LWR of the specimens was computed to elucidate their growth dynamics. The resulting equation was:
The LWR analysis elucidated an allometric growth trajectory b=0.2323, indicating that the increase in weight occurs at a rate slower than that of length (Fig. 4). A comparative assessment with FishBase corroborated the alignment with established growth trajectories of N. furcosus.
Environmental determinants profoundly affect the observed LWR. Tropical aquatic temperatures conventionally elevate metabolic rates, thereby enhancing growth until thresholds of stress are encountered (Sebille et al., 2014). In a similar vein, salinity influences osmoregulatory efficiency, with brackish conditions favoring diminutive sizes relative to fully marine ecosystems (Kuroki et al., 2006). The availability of food also constitutes a pivotal factor, as nutrient-abundant environments facilitate the sustenance of larger specimens (Unsworth et al., 2007). The type of substrate further plays a significant role, with sandy and coral habitats providing superior foraging opportunities compared to those characterized by muddy substrates (Yati et al., 2022).
Anthropogenic influences such as overfishing disproportionately target larger specimens, thereby diminishing their abundance and modifying population dynamics (Giles et al., 2014). Habitat degradation compounds these impacts by restricting resources and undermining the health of fish populations (Golani & Sonin, 2006). These findings underscore the complex interplay between environmental and anthropogenic factors in shaping the growth dynamics of N. furcosus populations.
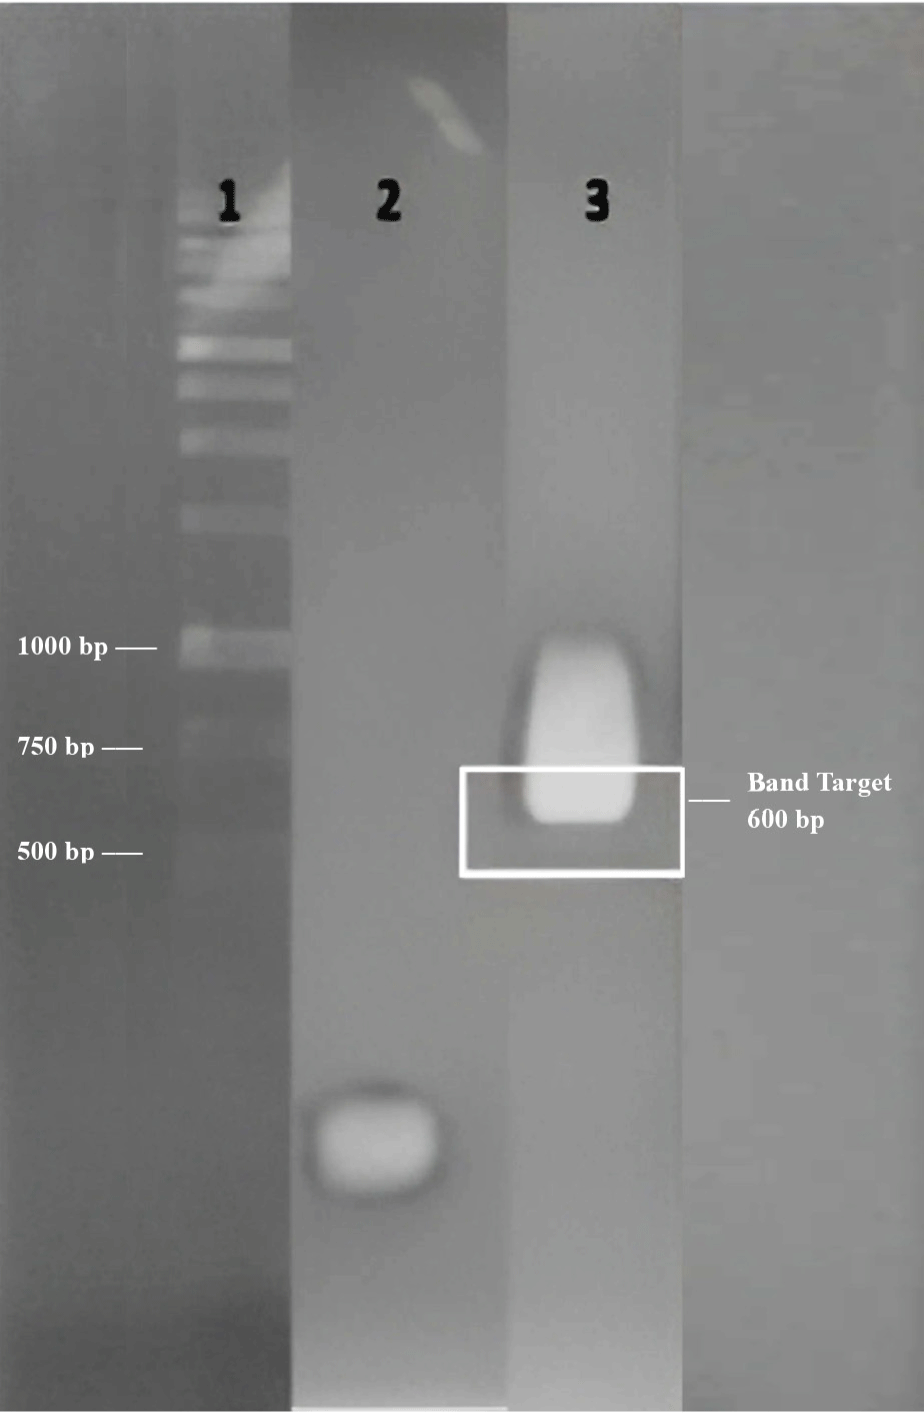
DNA analysis of the specimens was performed to confirm the morphological identification. Amplification of the COI gene using PCR yielded fragments of approximately 600 base pairs in length, as visualized on a 1.5% agarose gel (Fig. 5). This fragment size is consistent with the standard COI region widely used for species identification in fish (Aquilino et al., 2011; Hubert et al., 2008).
The COI sequences underwent rigorous analysis utilizing the BLAST computational tool, wherein they were compared against reference sequences housed within the GenBank database. A remarkable 99% similarity was documented between the isolate ITK-MB-NJ-11 and the reference sequence LC484881.1, thereby affirming the taxonomic classification of the specimens as N. furcosus. To elucidate these findings within a broader context, genetic comparisons were performed with populations originating from Malaysia, Thailand, and Vietnam. The observed genetic distances, ranging from 1.7% to 4.6%, indicate substantial inter-population variation, which appears to be driven by both geographical and ecological factors (Kundu et al., 2021; Lavoué et al., 2020).
Phylogenetic investigations disclosed the presence of distinct clades that correlate with specific geographic regions, thereby highlighting the evolutionary and biogeographic dynamics pertinent to N. furcosus within Southeast Asia (Shan et al., 2021). These findings are consistent with prior studies that illustrate adaptive genetic responses to various environmental factors, including salinity and habitat type (Habib et al., 2021).
Although this investigation concentrated on specimens acquired from the Muara Baru market, it is imperative that future research endeavors incorporate more extensive regional datasets to augment the comprehension of genetic diversity and to inform conservation strategies effectively. The integration of genetic data from alternative regions will facilitate a more holistic understanding of the evolutionary and ecological dynamics that shape N. furcosus populations.
The K2P analysis revealed a negligible degree of divergence between the populations of Muara Baru and the South China Sea (K2P = 0.00158), thereby implying the occurrence of gene flow. In contrast, the greater distances observed with Ambon (K2P = 0.04456) and the Philippines (K2P = 0.00615) indicate the presence of geographic and ecological isolation (Table 1).
The phylogenetic analysis of Nemipterus populations identified two clades, indicating genetic relationships and divergence among regions (Fig. 6). Clade 1, Populations from the South China Sea, Muara Baru, Philippines, and Vietnam exhibit significant genetic similarity, suggesting potential connectivity through environmental factors. The genetic linkage between Philippine and Vietnam populations reflects localized adaptations despite moderate divergence. Clade 2, Ambon populations formed a distinct clade due to geographic isolation and unique ecological conditions, with N. japonicus serving as an outgroup to underscore this separation.
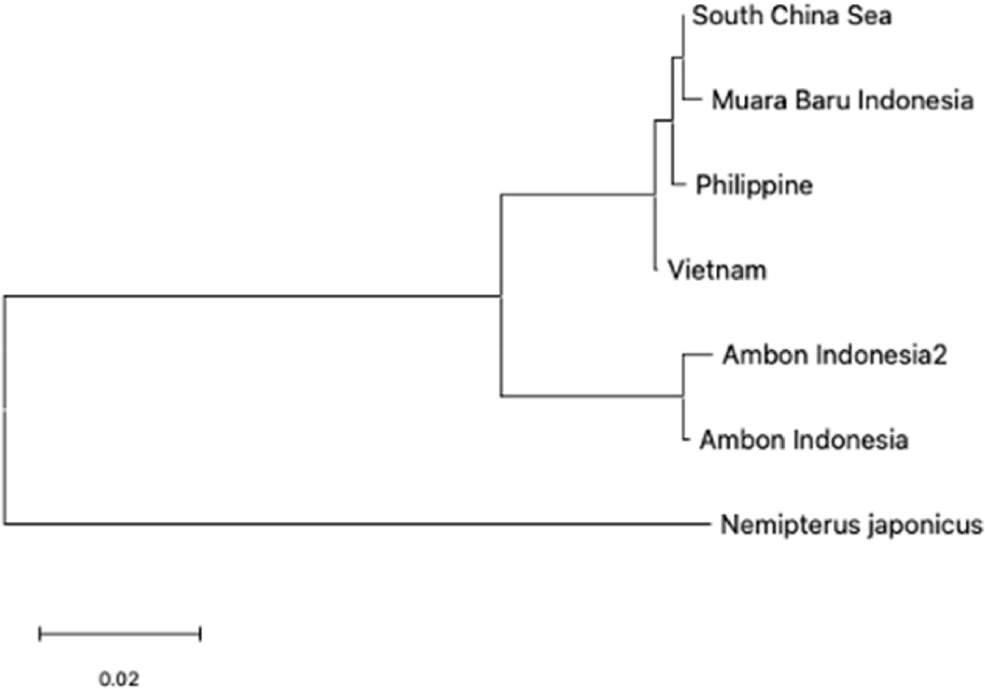
The phylogenetic relationships illustrate varying genetic divergences, with South China Sea and Muara Baru populations showing minimal distances, contrasting with Ambon’s distinctiveness due to geographic and ecological influences. These findings enhance understanding of Nemipterus populations evolutionary dynamics, informing conservation strategies that recognize both shared management for Clade 1 and localized efforts for Ambon populations. These insights are consistent with previous studies that underscore the significance of integrating both shared and region-specific strategies for the management of fish stocks in Southeast Asia (Habib et al., 2021; Shan et al., 2021).
Discussion
The morphological attributes of N. furcosus documented in this investigation exhibit a remarkable congruence with previously established descriptions, notably the pronounced reddish saddle bars situated on the predorsal region and the distinctive fin coloration patterns (Seah et al., 2016). These characteristics are in accordance with prior research that underscores the varied morphometric attributes within the Nemipterus genus (Müller et al., 1984). The homogeneity of these features implies that the specimens most likely emerged from an environment exhibiting relative stability, thereby corroborating the conclusions drawn by (Salma & Madduppa, 2021). The constancy of environmental parameters, such as temperature, salinity, and habitat type, has been empirically demonstrated to constrain morphometric variation within ichthyological populations (Khairul et al., 2020; Sharma et al., 2011).
The LWR exhibited an allometric growth pattern, further reinforcing the notion of environmental stability. Analogous trends have been documented in other Nemipterus species, where environmental determinants such as habitat complexity and salinity exert substantial influence on morphometric characteristics (Imtiaz & Naim, 2018). In contrast, populations inhabiting more dynamic or stressed environments frequently exhibit heightened morphological variability, as evidenced by studies conducted in the South China Sea (Paul et al., 2016). These observations underscore the significance of habitat conditions in shaping morphological attributes and emphasize the utility of morphometric data in ecological evaluations.
DNA barcoding has provided compelling evidence that corroborates the morphological classification, exhibiting a remarkable 99% resemblance to reference sequences housed within the GenBank database (LC484881.1). The mitochondrial COI gene has demonstrated its efficacy as a dependable molecular marker for the delineation of species, particularly in the context of cryptic taxa (Hubert et al., 2008; Pavan-Kumar et al., 2016). This investigation illustrates the applicability of DNA barcoding in market-oriented sampling contexts, wherein morphological characteristics may be compromised or unclear (Marnis, 2024; Wibowo et al., 2018). The results align with previous research demonstrating the efficacy of DNA barcoding for resolving taxonomic challenges, particularly in biodiverse regions like Southeast Asia (Ogwang et al., 2021). Moreover, the integration of DNA barcoding with morphometric analyses augments the reliability of species identification, as evidenced in the research conducted by Jaafar et al. (2012) and Bingpeng et al. (2018). This multimodal approach not only validates taxonomic assignments but also provides insights into phylogenetic relationships and population structure.
Although no notable genetic variation was observed among the specimens examined, an expanded sampling strategy across diverse habitats could potentially uncover localized genetic diversity. Such revelations are paramount for comprehending population dynamics and the evolutionary trajectory of N.furcosus.
The integration of morphological and genetic methodologies improves the accuracy of species identification and promotes a comprehensive understanding of population dynamics. Morphological techniques are critical for evaluating external characteristics and developmental patterns (Imtiaz & Naim, 2018; Paul et al., 2016). Nevertheless, DNA barcoding proficiently mitigates the shortcomings inherent in relying solely on morphological data, particularly in the context of cryptic or closely related taxa (Chen et al., 2011; Liu et al., 2015). For instance, the work of (Alina & Madduppa, 2020) illustrated that DNA barcoding consistently identified specimens of tongue fish exhibiting overlapping morphological features, attaining a 100% concordance with genetic repositories.
This multimodal strategy is particularly pertinent in regions abundant in biodiversity, such as Indonesia, where the prevalence of cryptic species and substantial genetic variability is prevalent. Through the integration of these methodologies, researchers are equipped to delineate population connectivity, assess genetic variability, and analyze adaptive responses to environmental stimuli (Becker et al., 2015; Gutiérrez et al., 2014). An integrative approach is critical for developing effective fisheries management and conservation strategies, ensuring sustainable practices and the preservation of biodiversity in complex ecosystems.
Accurate taxonomic identification is paramount for the assessment of fishery stocks, as misidentification may result in erroneous estimations and promote unsustainable management practices (Hauser et al., 2002; Marie et al., 2010). The application of DNA barcoding effectively mitigates these issues by facilitating precise identification, even in instances of compromised specimens or species with morphological similarities (Jensen et al., 2021).
The phenomenon of overfishing intensifies the challenges associated with stock management by diminishing genetic diversity and modifying population structures. Investigations concerning New Zealand snapper populations have demonstrated that overfishing adversely affects microsatellite diversity, thereby compromising population resilience (Hauser et al., 2002). In the case of N. furcosus, the reduction of genetic diversity may yield analogous consequences, underscoring the imperative for proactive management approaches.
Integrating genetic data into stock assessments enhances the delineation of population units, providing a foundation for conservation efforts such as habitat restoration and quota allocations (Casas & Saborido-Rey, 2023; Taillebois et al., 2017). Such data are essential for effectively navigating the complexities of stock management within biodiversity hotspots like Indonesia, where localized ecological variables significantly influence population dynamics.
The integration of genetic information into fisheries management regulations can markedly enhance the precision of stock assessments and mitigate illegal, unreported, and unregulated fishing practices. The global adoption of DNA barcoding facilitates the tracing of the origins of fish stocks, thereby promoting compliance with sustainable fishing methodologies (Andree et al., 2018; Griffiths & Fay, 2015). In the context of Indonesia, this methodology has the potential to bolster the effective governance of fishing zones and improve the transparency of seafood supply chains.
Market-driven applications of DNA barcoding further encourage conscientious consumption by validating the sustainability of fishery products (Shams et al., 2020). When integrated with morphological data, these methodologies establish a comprehensive framework for the assessment of stock sustainability and the enhancement of consumer awareness (Mehner et al., 2009).
The results of this investigation highlight the paramount significance of safeguarding genetic diversity within N. furcosus populations to ensure resilience in the face of environmental and anthropogenic challenges. It has been demonstrated that overfishing adversely affects reproductive success and adaptability, thereby accentuating the necessity for integrated management strategies that reconcile economic imperatives with ecological objectives (Jokikokko & Huhmarniemi, 2014).
Future investigations should broaden sampling initiatives to include a more diverse array of habitats, thereby yielding a more profound understanding of the impacts of environmental variables on both morphological and genetic diversity. Employing sophisticated methodologies, such as geometric morphometrics, may reveal nuanced population distinctions, whereas the amalgamation of DNA barcoding with environmental DNA (eDNA) metabarcoding presents a non-invasive methodology for assessing biodiversity in hard-to-reach locales (Deagle et al., 2014; Gong et al., 2018). These advanced techniques will contribute to the formulation of conservation strategies that are specifically designed for particular ecological circumstances, thereby enhancing the efficacy of sustainable fisheries management in biodiversity-rich regions such as Southeast Asia.
Conclusion
This investigation proficiently delineated the ichthyological specimens procured from the Muara Baru contemporary fish market as N. furcosus through a methodical approach that amalgamated both morphological and genetic analyses. Morphological attributes, including body morphology, pigmentation patterns, and fin architecture, were in alignment with established taxonomic classifications of N. furcosus. Furthermore, genetic analysis employing DNA barcoding corroborated this identification, yielding a 99% concordance with reference sequences cataloged in the GenBank database, thereby emphasizing the veracity and rigor of this integrative methodology.
The results substantiate the efficacy of DNA barcoding as a formidable adjunct to conventional morphological techniques, particularly within intricate environments such as fish markets, wherein specimens may display overlapping characteristics or signs of physical deterioration. This integrative methodology offers a dependable paradigm for accurate species delineation, effectively addressing the limitations associated with either technique when applied in isolation.
To build on these findings, future research should expand sampling efforts to include fish markets across a broader geographical range and incorporate specimens from diverse ecological niches within Southeast Asia. The integration of eDNA methodologies could substantially augment biodiversity evaluations by facilitating non-invasive surveillance of ichthyofaunal populations and their associated ecosystems, particularly in locales where direct sampling presents significant challenges.
This inquiry makes a substantial contribution to the comprehension of Nemipterus biodiversity within Indonesia and highlights the imperative for synthesizing morphological and molecular methodologies for the advancement of effective fisheries management. The noted homogeneity in morphometric characteristics among N. furcosus specimens is indicative of the environmental stability present in Indonesian aquatic systems, which are characterized by consistent salinity and temperature regimes that mitigate selective pressures for morphological diversity. By establishing a reliable framework for species identification, this study underpins sustainable fisheries management, biodiversity preservation, and the development of effective strategies for the monitoring and conservation of marine fish populations.


