


Introduction
Vitamin D3 is one of the essential fat-soluble vitamins in aquafeeds, known to regulate calcium and phosphorus homeostasis by promoting their intestinal absorption and to support lipid metabolism and immune responses in shrimp and fish (Liu et al., 2021; Shao et al., 2022; Sivagurunathan et al., 2022; Wen et al., 2015). Vitamin D3 enhances immune function by promoting the production of anti-bacterial peptides, stimulating anti-inflammatory cytokine secretion and activating macrophages (Liu et al., 2021; Shao et al., 2022). Both deficiency and excess of dietary vitamin D3 are associated with impaired growth, reduced feed efficiency, and clinical signs such as lethargy, hypermelanosis and skeletal anomalies in fish (Knuth et al., 2020; Ling-hong et al., 2015; Shao et al., 2022; Zhu et al., 2015).
Recently, the replacement of fish meal and fish oil with plant-based ingredients in aquafeeds has increased substantially due to sustainability and cost considerations (Hossain et al., 2024). However, plant-based ingredients generally contain little or no vitamin D3 compared to animal-derived ingredients, potentially leading to nutritional deficiencies in aquatic animals (EFSA FEEDAP Panel, 2017; Hansen et al., 2015). Prabhu et al. (2019) suggested that the optimum vitamin D3 level for Atlantic salmon (Salmo salar) is 60–90 μg/kg (2,400–3,600 IU/kg), whereas higher levels may be needed under fish meal- and fish oil-reduced diets. The EFSA FEEDAP Panel (2017) reported that the increasing use of plant-based ingredients in aquafeeds can reduce vitamin D3 content to about 25%–33% of that in traditional fish-based formulations. Therefore, determining the optimum dietary vitamin D3 level under such alternative feeding strategies is essential to maintain growth performance, mineral balance, and overall health in aquaculture species. Shrimp and fish have limited capacity to synthesize vitamin D3 endogenously; therefore, their dietary requirement must be met through formulated feeds (Hamre et al., 2010; Lambert, 2007). Previous studies suggested optimum vitamin D3 levels in aquafeeds based on growth (Lock et al., 2010). However, studies on dietary vitamin D3 requirements for crustaceans remain limited. In crustaceans, vitamin D3 is important for growth and immune responses against pathogenic bacteria (Liu et al., 2021). Shiau & Hwang (1994) reported an optimal dietary vitamin D3 requirement of 100 μg/kg (4,000 IU/kg) for grass shrimp (Penaeus monodon). The optimal dietary vitamin D3 level for Chinese mitten crab (Eriocheir sinensis) was suggested as 120–150 μg/kg (4,825–5,918 IU/kg) (Liu et al., 2021). Wen et al. (2015) reported that the 160 μg/kg (6,366 IU/kg) diet is an optimum level for Pacific white shrimp (Penaeus vannamei) under low salinity condition (10–15 psu). In condition of 21.6–23.5 psu salinity, the optimum level of vitamin D3 in diets for Pacific white shrimp was suggested at 480 μg/kg (19,200 IU/kg) (Dai et al., 2022). However, the optimum dietary vitamin D3 levels for Pacific white shrimp have not yet been estimated in seawater condition. Thus, this study aims to determine the optimal dietary vitamin D3 requirements for P. vannamei cultured under seawater conditions. The evaluation is based on growth performance, immune response, Ca and P balance, lipid metabolism and histopathological changes.
Materials and Methods
A basal diet (VD0) with 35% crude protein and 9% crude lipid was prepared without vitamin D3 supplementation. Four other diets were prepared by supplementing 45, 90, 135, and 270 μg vitamin D3/kg diet (designated as VD45, VD90, VD135, and VD270, respectively). Vitamin D3 (0.25%, DSM Nutritional Products, Kaiseraugst, The Netherlands) was mixed with α-cellulose as an inert carrier to obtain the graded target concentrations. The amounts of vitamin D3 and cellulose were adjusted to ensure that the total weight and proximate composition of the diets remained balanced among treatments (Table 1). All the ingredients were kneaded with fish oil (4% w/w) and water (12% w/w). The mixed dough was pelletized with a diameter of 1.5 mm (SP-50, Kum-Kang Engineering, Daegu, Korea) and then, dried (24°C–25°C, 8 h) and stored (–20°C). The vitamin D3 levels measured by high-performance liquid chromatography (HPLC) were 12, 35, 101, 132, and 294 μg/kg, respectively, following the analytical procedure described in the HPLC analysis section.
3) Mixture of vitamin D3 (0.25%, DSM Nutritional Products) and cellulose to obtain graded levels of vitamin D3. The determined dietary vitamin D3 levels were 12, 35, 101, 132, and 294 μg/kg for VD0, VD45, VD90, VD135, and VD270, respectively.
4) Each kg of premix contains 12.50 g C4H2FeO4, 12.00 g MnSO4, 20.00 g FeSO4, 6.00 g CuSO4, 0.75 g CoSO4, 25.00 g ZnSO4, 0.75 g Ca(IO3)2, 80.20 g MgSO4, and 0.75 g Al2O3. The mixture was prepared to 1 kg using cellulose.
5) Each kg of premix contains 1.65 g retinol, 20.0 g α-tocopherol, 5.0 g menadione, 20.0 g ascorbic acid, 2.0 g thiamin hydrochloride, 20.0 g riboflavin, 40.0 g nicotinic acid, 54.0 g myo-inositol, 18.0 g Ca-pantothenate, 15.0 g pyridoxine hydrochloride, 0.3 g biotin, 4.0 g folic acid and 0.01 g cobalamin. The mixture was prepared to 1 kg using cellulose.
The shrimp were purchased from a local hatchery (Daedong susan, Muan-gun, Korea) and acclimated for 10 days. A total of 400 shrimp (20 shrimp per tank) (initial weight: 0.07 ± 0.00 g) were randomly distributed into 20 tanks (120 L) with four replicates per treatment, in a completely randomized design. Experimental diets were fed to the shrimp six times a day (08:00, 10:00, 12:00, 14:00, 16:00, and 18:00 h) for 8 weeks. Shrimp biomass in each tank was measured biweekly to adjust feeding rates (4%–10% of biomass), using a precision digital balance (Pioneer PX, PX2202KR; Ohaus, Parsippany, NJ, USA). Water was exchanged every three days (approximately 70% of total volume) using preheated seawater (28°C–30°C).Water temperature, salinity, dissolved oxygen, and pH were measured daily, whereas ammonia concentration was monitored once per week. The recorded tank water quality was temperature 29.3 ± 0.7°C, salinity 33.5 ± 0.5 ppt, dissolve oxygen 5.84 ± 0.71 mg/L, pH 7.08 ± 0.15 and ammonia 0.05 ± 0.02 ppm.
All the shrimp were counted and individually weighed after the 8 weeks of feeding trial. Growth performance (initial body weight [IBW]; final body weight [FBW]; weight gain [WG]; specific growth rate [SGR]) and feed utilization (feed conversion ratio [FCR]; protein efficiency ratio [PER]) and survival were calculated. Five shrimp per tank (20 shrimp per dietary group) were randomly captured and anesthetized with ice-cold water. After anesthetization, the hemolymph and hepatopancreas were collected. The collected hemolymph was kept at –80°C until used for non-specific immunity analyses, cholesterol and triglyceride analyses. Four of the five collected hepatopancreas were immediately frozen with liquid nitrogen and kept at –80°C until used to quantitative polymerase chain reaction (qPCR) assay (three shrimp per tank) and vitamin D3 analysis (one shrimp per tank). The other hepatopancreas was immediately immersed in Davidson’s solution for histomorphological analysis. The carapace was separated from one of the remained carcasses from each tank and was stored at –20°C until used to analyses. Other shrimp carcass was used to proximate composition analysis. Proximate composition of experimental diets and whole-body sample was analyzed by the method described by AOAC (2005). Hemolymph cholesterol and triglyceride levels were analyzed by a biochemistry analyzer (SLIM, SEAC, Florence, Italy).
The hepatopancreas of shrimp were fixed for 24 h in Davidson’s solution. Following fixation, the hepatopancreas was dehydrated with gradual concentrations of ethanol (70%–100%). Samples were cleaned with xylene and embedded in paraffin. 6 μm-thick sections were obtained using microtome and then, stained with hematoxylin and eosin solutions. The sections were observed using an optical microscope (DM750, Leica, Bensheim, Germany). The number and diameter of B cells, as well as the number of lipid droplets (LD), were determined in randomly selected hepatopancreas tubules from each treatment.
A pyrogallol ethanol solution was prepared by dissolving pyrogallol (10 g, Sigma-Aldrich, St. Louis, MO, USA) in 100 mL of ethanol. The homogenized sample was aliquoted into 50 mL tube covered with aluminum foil. Pyrogallol ethanol solution (4 mL) and 90% potassium hydroxide solution (1 mL) were added into the tube. Samples were saponified at 30°C for 16 h under gentle vortexing. 1 mL water and 3 mL n-hexane were added into saponified samples and mixture was centrifuged (1,000×g, 60 sec). Supernatants were collected and 3 mL n-hexane was added into samples and mixture was centrifuged (1,000×g, 60 sec) again. Supernatants were combined and washed with 2 mL water, centrifuged (1,000×g, 60 sec). Hexane layer containing vitamin D3 was collected. 1 mL iso-propanol was added into combined samples and samples were dried with nitrogen. Dried samples were dissolved in 100 μL n-hexane. Arc 2998 HPLC (Waters, Milford, MA, USA) system equipped with a C18 (Waters, 4 μm, 4.6 × 250 mm) column and photodiode array detector (PDA) detector was used to detect vitamin D3 in samples. The mobile phase (chloroform:methanol:acetonitrile = 6:12:82) was eluted 25 min (0.5 mL/min). The column temperature during the analysis was 30°C and the absorbance was detected at 265 nm.
Hepatopancreas was homogenized using a tissue grinder (Kimble Chase, Vineland, NJ, USA) and RNA was extracted from the tissue suspension. The quantity and quality of total RNA were measured using a Nano drop 2000 (Thermo Scientific, Wilmington, DE, USA). The 260/280 nm ratio for all samples was between 1.85 and 1.96, and cDNA was synthesized using the PrimeScript™ RT reagent kit (Takara, Shiga, Japan). β-actin was used as a reference gene. A thermal cycler dice (Real time system III, Takara) was used for insulin-like growth factor binding protein (IGF-BP) and prophenoloxidase (proPO) expression analysis. The reaction was performed in a 20 μL sample containing 10 μL of TB green premix (Takara), 2 μL of cDNA and 0.4 μL of each primer pair, and all reactions were run in quadruplicate. The PCR was performed for one cycle at 95°C for 30 sec, followed by 40 cycles at 95°C for 10 sec, 55°C for 30 sec. The results were evaluated by the 2-ΔΔCT method (Pfaffl, 2001). The analyzed gene primer sequences are provided in Table 2.
Digestibility test diets were prepared by supplementing 1% chromium oxide (Cr2O3, DaeJung Chemical & Metals, Siheung, Korea) into the diets as an internal indicator to estimate apparent digestibility coefficient (ADC). After feeding trial, all the shrimp in same treatments were pooled and redistributed 12 shrimp per tank (48 shrimp per treatment) into 24 tanks (240 L) in four replicates. After 3 days of acclimation, shrimp were fed the experimental diets (3% biomass) two times daily (08:30 and 15:30 h). Uneaten feeds were removed every 30 minutes after feeding (09:00 and 16:00 h). Feces were collected and separated using a paper filter two times daily (11:00 and 18:00 h). Collected feces were freeze-dried and used for nutrients digestibility analysis. Fecal samples were freeze-dried for 24 h and stored at –20°C until analyzed. The Cr2O3 level of the diets and fecal samples were measured by the method of Divakaran et al. (2002). Following formulas were used to calculate ADCs of diets.
The method from Hernández-López et al. (1996) was applied to determine phenoloxidase (PO) activity. A cacodylate buffer was prepared by mixing 10 mM sodium cacodylate and 10 mM calcium chloride to a pH of 7.0. Trypsin (5 mg) was then dissolved in 50 mL of cacodylate buffer. A L-DOPA solution was prepared by dissolving L-DOPA (50 mg) in 5 mL distilled water. The sample (50 μL) was aliquoted into a 96-well plate. After adding 50 μL trypsin solution, the mixture was incubated (25°C, 30 min). Then, L-DOPA solution (50 μL) was added and incubated again (25°C, 10 min). A wavelength of 492 nm was used to determine the optical density. The method from Paglia & Valentine (1967) was applied to determine lysozyme activity. A 0.1 M phosphate buffer was prepared by dissolving potassium phosphate dibasic (0.518 g) and potassium phosphate monobasic (0.956 g) in distilled water and adjusted to a final volume of 100 mL and pH 6.4. A bacterial suspension (Micrococcus lysodeikticus) was prepared by dissolving bacteria (15 mg) in 20 mL of phosphate buffer. The sample (20 μL) was aliquoted into a 96-well plate and 200 μL bacterial suspension was added. The mixture was incubated at 25°C for 30 min. A wavelength of 570 nm was used to determine the optical density. A zymosan solution (0.1%) was prepared by dissolving zymosan (10 mg) in 10 mL of Hank’s balanced salt solution (Sigma-Aldrich). A nitro-blue tetrazolium (NBT) solution (0.3%) was prepared by dissolving three NBT tablet (Sigama-Aldrich) in 10 mL of distilled water. The sample (50 μL) was aliquoted into a 96-well plate and 200 μL Hank’s balanced salt solution was added. The mixture was incubated (37°C, 30 min). After incubation, the zymosan solution (100 μL) was added into the mixture and incubated again (37°C, 2 h). NBT solution (100 μL) was added into the mixture and incubated again (37°C, 2 h). After incubation, methanol (600 μL) was added into the mixture and centrifuged (4,800×g, 10 min). After discarding the supernatant, the remaining pellet was rinsed three times with 100 μL of 70% methanol. The pellet was dissolved with 700 μL of 2M potassium hydroxide solution and 800 μL of dimethyl sulfoxide. A wavelength of 620 nm was used to determine the optical density.
Before analysis, the 0.5 g of carapace was dissolved into 20 mL of 12M HCl. Then, the sample pH was adjusted to 7 using 8M NaOH. Distilled water was added to adjust the sample volume to be 100 mL. P level in the shrimp carapace was measured by colorimetric method. The molybdo vanadate solution was prepared by mixing 25 g of ammonium molybdate, 1.25 g of ammonium metavanadate and 700 mL of distilled water. 250 mL of nitric acid was added into mixture and then, distilled water was added to adjust that total volume to be 1 L. P standard (500 ppm) solution was prepared by dissolving 2.195 g of potassium phosphate monobasic with 1 L of distilled water and diluted for preparing standard curve. The molybdo vanadate (2.5 mL) was added into the sample (1 mL) and then, the volume was adjusted to 25 mL by adding distilled water. The samples were incubated 15 min in room temperature. A wavelength of 470 nm was used to determine the optical density. Ca level in the shrimp carapace was measured by ethylenediaminetetraacetic acid (EDTA) titration. Distilled water (40 mL) and 8 mL of 8M NaOH were added into the sample (10 mL). Then, 10 mg of Patton-Reeder was added into sample and titrated with 0.025M EDTA untill a persistent blue endpoint was observed. The Ca level was calculated by following formula.
A completely randomized design was used to assign the experimental tanks. Percentage data were converted to arcsine values before statistical analysis, and all data were plotted as mean ± SD. Normality was assessed with the Shapiro–Wilk test, and homogeneity of variances with Levene’s test. To determine differences between treatments, a one-way analysis of variance (ANOVA) was performed. Significant differences among treatments were compared using Tukey’s HSD post-hoc test (p < 0.05). To determine whether the effect of the diet was linear or quadratic, an orthogonal polynomial contrast was performed. SPSS 24.0 (International Business Machines, Armonk, NY, USA) was used to perform statistical analysis. The optimum dietary vitamin D3 requirement was estimated by broken-line regression analysis, using FBW and relative IGF-BP expression as response variables. Regression analyses were conducted with SigmaPlot version 14.0 (Systat Software, San Jose, CA, USA).
Results
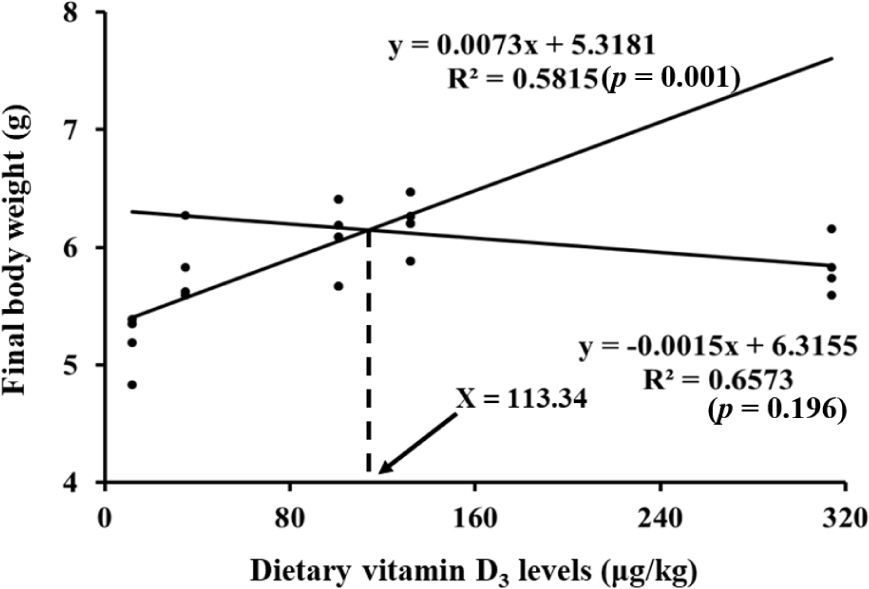
FBW and WG in VD135 group was significantly higher than that in VD0 group (Table 3). SGR in VD90 and VD135 groups were significantly higher than that in VD0 group (p < 0.05). FCR was significantly lower in VD90, VD135, and VD270 groups than that in VD0 group (p < 0.05). Shrimp fed VD135 and VD270 diets showed significantly higher PER than shrimp fed VD0 diet (p < 0.05). Survival rate was not significantly different among all the treatments. FBW, SGR, and FCR exhibited both significant linear and quadratic trends with increasing dietary VD levels (p < 0.05). PER showed only a significant linear trend (p < 0.05). Survival of the shrimp showed significant quadratic trend with increment of vitamin D3 level in diets (p < 0.05). In the broken-line regression based on FBW, the slope before the breakpoint was significant (p = 0.001), whereas the slope after the breakpoint was not (p = 0.196), indicating a plateau response. Based on this model, the optimum dietary vitamin D3 requirement for Pacific white shrimp was estimated at 113.34 μg/kg (Fig. 1).
Values are mean of quadruplicates (n = 4) and presented as mean ± SD. Different superscripts in each column indicate significant differences (p < 0.05). The determined dietary vitamin D3 levels were 12, 35, 101, 132, and 294 μg/kg for VD0, VD45, VD90, VD135, and VD270, respectively.
The hepatopancreatic vitamin D3 levels, as well as whole-body protein, lipid, ash, and moisture, were not significantly affected by dietary vitamin D3 levels (p > 0.05; Table 4). Hepatopancreatic vitamin D3 level of the shrimp was not significantly linear or quadratic with an increase in dietary vitamin D3 level (p < 0.05). The whole-body protein, lipid and ash were not significantly linear or quadratic with increment of vitamin D3 level in diets (p > 0.05).
Values are mean of quadruplicate groups and presented as mean ± SD. Values with different superscripts in the same column indicate significantly different (p < 0.05). The determined dietary vitamin D3 levels were 12, 35, 101, 132, and 294 μg/kg for VD0, VD45, VD90, VD135, and VD270, respectively. The lack of superscript letter indicates no significant difference among the treatments.
The ADCs of dietary protein, lipid and dry matter were significantly increased with increasing dietary vitamin D3 levels up to 132 μg/kg (Table 5). ADCs of protein, lipid, and dry matter were significantly higher in VD45, VD90, and VD135 groups compared to VD0 and VD270 groups. Results of protein ADC was both linear and quadratic with increasing dietary vitamin D3 level (p < 0.05). Results of ADCs of lipid and dry matter showed significantly quadratic trends with increment of dietary vitamin D3 (p < 0.05).
All the groups showed no significant difference in PO activity (p > 0.05) (Table 6). Lysozyme and NBT activities in VD270 group were significantly higher than those in VD0 group. PO activity showed no linear or quadratic trends with increment of vitamin D3 level in diets (p > 0.05). Lysozyme and NBT activities exhibited both significant linear and quadratic responses with increasing dietary vitamin D3 levels (p < 0.05).
Hemolymph cholesterol levels in VD45, VD90, and VD135 groups were significantly higher than that in VD270 group (Table 7). All vitamin D3 supplemented groups showed significantly higher hemolymph triglyceride level than that in VD0 group . Cholesterol levels showed a significant quadratic trend with increasing dietary vitamin D3 (p < 0.05). Triglyceride levels exhibited both linear and quadratic trends (p < 0.05).
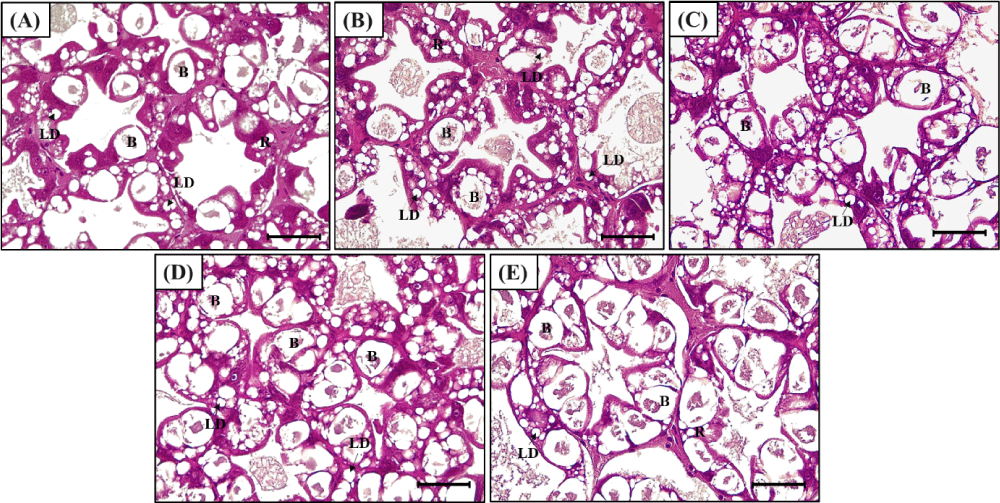
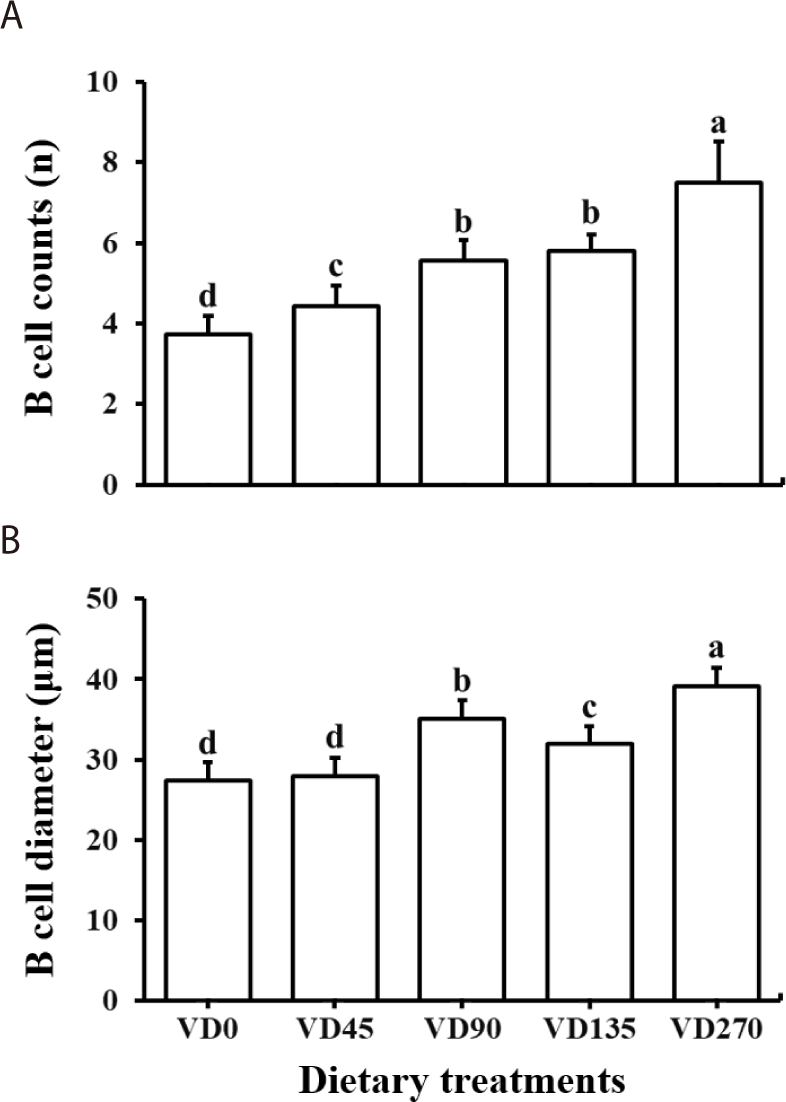
Representative histological images of shrimp hepatopancreas were presented in Fig. 2. The hepatopancreatic blasenzellen cell (B cell) count was significantly increased with the increment of vitamin D3 levels in diets (Table 8, Fig. 3). All the vitamin D3-supplemented groups showed significantly higher B cell counts than that in VD0 group (p < 0.05). Shrimp fed VD90, VD135, and VD270 diets showed significantly higher B cell diameter than shrimp fed VD0 and VD45 diets (p < 0.05). Both B cell counts and diameters increased in a linear and quadratic manner with increasing dietary vitamin D3 levels (p < 0.05). LD in hepatopancreatic cells was significantly higher in all vitamin D3-supplemented groups compared to VD0 but markedly reduced in VD270 group. LD counts increased in both linear and quadratic trends with dietary vitamin D3 level (p < 0.05).
Ca and P levels in the shrimp carapace were not significantly different (p > 0.05) among all the treatments (Table 9). Ca and P levels in the shrimp carapace was not significantly linear or quadratic (p > 0.05).
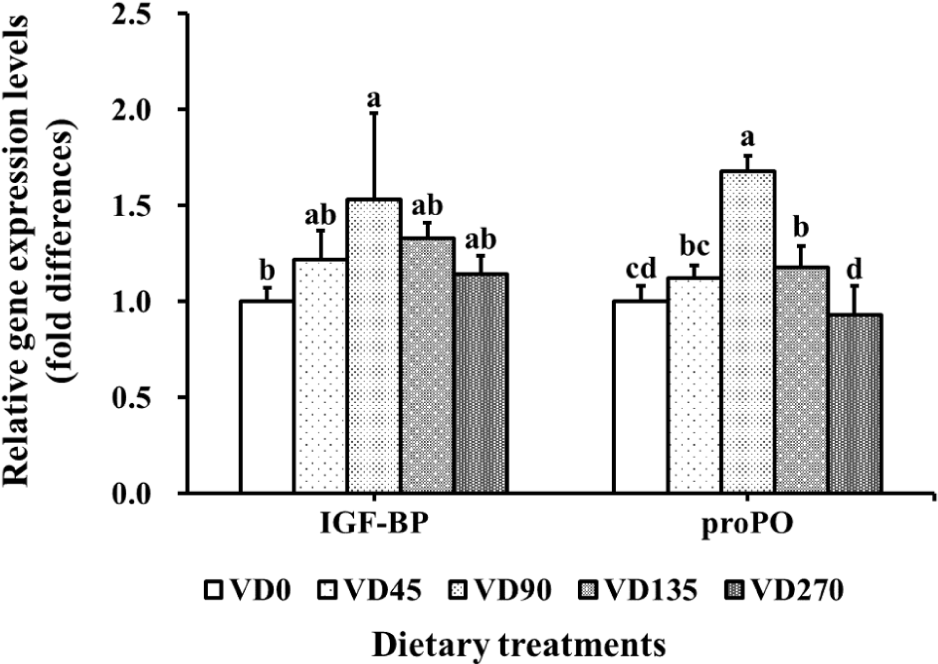
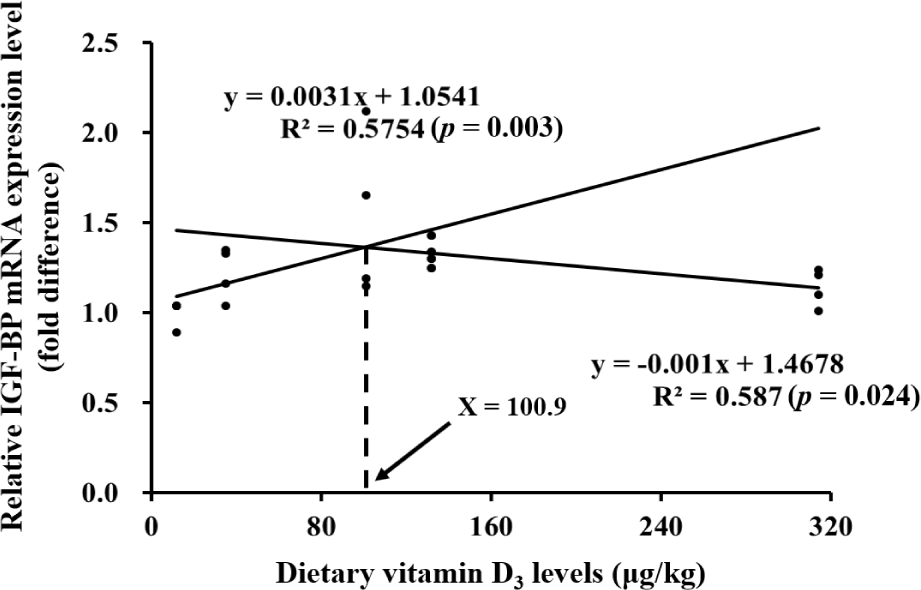
IGF-BP gene expression in VD90 group was significantly upregulated than that in VD0 group (Fig. 4). VD90 and VD135 groups showed significantly higher proPO gene expression levels than that of VD0 group. IGF-BP and proPO gene expressions showed significant quadratic trends with increasing dietary vitamin D3 level (p < 0.05). In the broken-line regression based on IGF-BP expression, the slope before the breakpoint was significant and positive (p = 0.003), whereas the slope after the breakpoint was significant and negative (p = 0.024), suggesting that IGF-BP expression increased up to the breakpoint and then declined. According to this model, the optimum dietary vitamin D3 requirement for Pacific white shrimp was estimated at approximately 100.9 μg/kg (Fig. 5).
Discussion
Our findings suggest that, based on broken-line regression analyses of growth performance and relative IGF-BP expression, the optimal dietary vitamin D3 range for juvenile Pacific white shrimp is comparable to that reported for other marine crustaceans. Liu et al. (2021) suggested 120–150 μg/kg (4,825–5,918 IU/kg) of vitamin D3 as an optimum level in diets for maximum growth of Chinese mitten crab, and Shiau & Hwang (1994) suggested 100 μg/kg (4,000 IU/kg) as the optimum dietary vitamin D3 level for grass shrimp. Lee & Lee (2025) estimated a higher optimum of 186.03 μg/kg (7,441 IU/kg) for post-larvae, likely reflecting the elevated metabolic rate, accelerated tissue differentiation and greater nutritional demands during early ontogeny compared to juveniles.
In this study, nutrient digestibility of the shrimp was improved by dietary vitamin D3 supplementation up to 132 μg/kg (5,280 IU/kg), consistent with the growth results. Although the specific mechanism is unclear, it is plausible that optimum levels of dietary vitamin D3 enhance digestive enzyme activities in shrimp. Lee & Lee (2025) reported that optimal vitamin D3 supplementation enhanced digestive enzyme activity and digestive tissue morphology in post-larvae, suggesting that optimal vitamin D3 can promote growth by stimulating digestive capacity and nutrient assimilation.
In addition, gene expression level of IGF-BP, a regulator associated with cell growth and development (Ipsa et al., 2019), was also upregulated in VD90 and VD135 groups, suggesting a molecular basis for the observed growth improvement. These growth-promoting effects may not be solely due to improved nutrient assimilation but may also linked to endocrine regulation. In crustaceans, vitamin D3 regulates the endocrine systems associated with the molting cycle (Chen et al., 2012). In this study, the cholesterol level of hemolymph in shrimp fed VD45, VD90, and VD135 diets were higher than that in shrimp fed VD0 and VD270 diets. Cholesterol is an important precursor of various endocrine hormones, including molting hormones in shrimp (Mykles, 2011), suggesting that dietary vitamin D3 supplementation may stimulate endocrine cycles associated with molting and growth.
Vitamin D3 is closely associated with lipid metabolism in the body (Botella-Carretero et al., 2007), and similar effects have been reported in aquatic species. In Wuchang bream (Megalobrama amblycephala), chronic stress such as abnormal lipid metabolism and intestinal structure was observed in fish fed diet with excessive levels of vitamin D3 (Miao et al., 2015) and lipid accumulation in the fillet of fish fed low vitamin D3 diet (Ling-hong et al., 2015). In shrimp, dietary vitamin D3 level significantly affected the expression of lipid synthesis and lipolysis genes in Pacific white shrimp (Dai et al., 2022). In addition, the hepatosomatic index of Pacific white shrimp increased with increment of dietary vitamin D3 from 17 to 189 μg/kg (685–7,550 IU/kg) (Wen et al., 2015). Similarly, in this study, hemolymph triglyceride level in all the shrimp fed vitamin D3-supplemented diets was higher than that in VD0 group. In addition, the number of LD in shrimp hepatopancreatic cells was greater in all vitamin D3 supplemented groups than that in VD0 group, indicating that the lipid metabolism of shrimp was significantly upregulated. Lee & Lee (2025) similarly observed that optimal vitamin D3 supplementation in post-larvae enhanced lipid metabolic efficiency, likely by promoting lipid utilization pathways and balancing lipid synthesis and oxidation. However, the hepatopancreas of shrimp fed VD270 diet exhibited enlarged B cells and drastically reduced LD counts, suggesting that 294 μg/kg (11,760 IU/kg) may impair lipid metabolic processes. The histopathological observation in this study suggest that 101–132 μg/kg (4,040–5,280 IU/kg) of dietary vitamin D3 may be the optimum range for lipid metabolism in shrimp, whereas excessive dietary vitamin D3 at 294 μg/kg (11,760 IU/kg) is likely to reduce lipid metabolic processes.
Malnutrition or dysregulation of vitamin D3 has been associated with hypercalcemia, chronic stress and high mortality of fish (Lock et al., 2010). Gilthead seabream (Sparus aurata) fed excessive dietary levels of vitamin D3 showed high cortisol levels, an indicator of stress (Abbink et al., 2004). This stress response aligns with the B cell development and cell structural changes observed in shrimp hepatopancreas in this study. Notably, the number and diameter of B cells in the shrimp hepatopancreas enlarged with increasing dietary vitamin D3 level, resembling the increase in B cell size of hepatopancreatic cells in shrimp exposed to oxidative stress (Xie et al., 2018). The simultaneous increase in B cell counts and the pronounced vacuolization of cells in VD270 may have collectively contributed to the structural collapse of hepatopancreatic integrity, suggesting that excessive dietary vitamin D3 higher than 294 μg/kg (11,760 IU/kg) can lead to chronic stress and disrupted cellular integrity in the shrimp hepatopancreas.
Vitamin D3 plays a critical role in calcium and phosphorus homeostasis, both of which are essential for normal skeletal formation in crustaceans, as calcium and phosphorus are the key components of the exoskeleton (Muralisankar et al., 2022). In Pacific white shrimp, Lee & Lee (2025) reported that dietary vitamin D3 supplementation significantly increased calcium and phosphorus levels in the carapace, indicating that vitamin D3 directly influences mineral absorption and exoskeleton development. Wen et al. (2015) demonstrated that the increasing of dietary vitamin D3 from 17–189 μg/kg (685–7,550 IU/kg) enhanced whole-body ash in Pacific white shrimp reared under low salinity condition (21.6–23.5 psu). In addition, Dai et al. (2022) described that the Ca and P levels in the carapace of Pacific white shrimp were increased by supplementation 480–980 μg/kg (19,200–39,200 IU/kg) of dietary vitamin D3 under low salinity condition (10–15 psu). However, in the present study, dietary vitamin D3 levels did not significantly affect carapace calcium and phosphorus or whole-body ash level in shrimp. This outcome may be attributed to the high salinity (32.5 ± 0.5 psu) of the rearing water. Marine crustaceans can readily absorb minerals, such as calcium and phosphorus, directly from seawater to support exoskeleton formation (Luquet, 2012). Therefore, under seawater conditions, shrimp may not require more than 12 μg/kg (480 IU/kg) of dietary vitamin D3 to achieve adequate mineralization of the exoskeleton.
Liver is one of the major organs of nutrient storage including vitamin D3 (Fraser, 2018). Liver vitamin D3 level in Atlantic salmon was significantly increased by the increment of vitamin D3 level in feeds (Graff et al., 2002). Wang et al. (2017) reported that hepatic 1,25(OH)2D3 in Siberian sturgeon (Acipenser baerii) increased with vitamin D3. Whole-body vitamin D3 level in Chinese mitten crab also increased by the increment of vitamin D3 in diets (Liu et al., 2021). However, hepatopancreatic vitamin D3 level in the shrimp was not significantly different among all the groups in this study. Thus, dietary vitamin D3 levels within 12–314 μg/kg (486–12,553 IU/kg) may not affect vitamin D3 accumulation in the shrimp hepatopancreas.
Recently, the immunostimulants effects of vitamin D3 in aquafeeds have actively been reported. Yang et al. (2019) suggested that 25 μg/kg (1,000 IU/kg) of dietary vitamin D3 as an optimum level for improving non-specific immune responses including the activities of phosphatase and lysozyme in pearl oyster (Pinctada fucata). Liu et al. (2021) reported that Chinese mitten crab fed the diets with 148 μg/kg (5,940 IU/kg) of vitamin D3 exerted enhanced activities of antioxidant enzyme activity and total antioxidant capacity. Dai et al. (2022) reported that supplementing 480 μg/kg (19,200 IU/kg) of vitamin D3 to Pacific white shrimp upregulated the gene expression of superoxide dismutase, catalase, glutathione and lysozyme. In our study, same phenomenon was observed in the activities of lysozyme and NBT of shrimp increased with increasing dietary vitamin D3 levels. In addition, shrimp fed VD90 and VD135 diets showed significantly higher gene expression level of proPO, which has a role in promotion of phenoloxidase activity, one of the most important defense mechanisms in shrimp (Amparyup et al., 2013).
In conclusion, the optimal dietary vitamin D3 level for Pacific white shrimp is estimated at 100.9–113.34 μg/kg (4,036–4,534 IU/kg), as determined by broken-line regression analyses of growth performance and IGF-BP expression. Dietary vitamin D3 supplementation significantly improved feed utilization, nutrient digestibility, lipid metabolism and non-specific immune responses of the shrimp. Histological observations further supported this conclusion, as shrimp fed diets within this optimum range exhibited healthier hepatopancreatic structures, whereas excessive vitamin D3 supplementation (294 μg/kg) led to enlarged B cells, reduced LD, and impaired tissue integrity. These findings demonstrate that adequate—but not excessive— vitamin D3 supplementation is crucial for promoting growth, metabolic balance and tissue health in Pacific white shrimp.