Introduction
Most analytical techniques used in fisheries stock evaluation, include virtual population analysis (VPA) and statistical catch at age (SCAA) require specified information of the age structure of fish stocks. Those techniques also depend on different organic parameters such as recruitment, growth, adulthood, and herbal mortality, all of which can be carefully related to accurate age and growth statistics. Therefore, the reliability of scientific recommendation and the effectiveness of fisheries management measures rely heavily at the availability of unique age-determination statistics. Despite the fact that period records are usually less difficult and less pricey to acquire than age statistics (Agger et al., 1974), the conversion of the length structure of a stock to the age structure required by VPA and SCAA-based stock assessment models is usually performed by means of age slicing procedures using growth parameters (i.e., the von Bertalanffy growth formula [VBGF]), or by age length keys (ALKs) to convert size distribution into age distribution. In light of these considerations, it is fundamental that accurate and reliable information on age and growth is made available to end users and experts involved in stock assessment works.
Nile tilapia (Oreochromis niloticus) is among the maximum productive and widely farmed fish species globaly (World Bank, 2012). It has massive commercial importance and the backbone of inland fisheries in lots of African nations (Hyuha et al., 2017; Younes et al., 2015). In Ethiopia, O. niloticus is broadly distributed in lakes and rivers and contributes approximately 50% of the total annual fish landings (Tesfaye & Wolff, 2014), achieving as much as 65% in Lake Tana (Dejen et al., 2017; Tewabe, 2013). Given its economic and ecological importance, the age and growth characteristics of this species is important for understanding inventory status and enforcing effective fisheries management.
Numerous studies on age and growth of O. niloticus were carried out in other parts of the world (Bwanika et al., 2007; Getabu, 1992; Gomez-Marquez, 1998; G<ómez-M<árquez et al., 2008). Such studies were also conducted in the Ethiopian Rift Valley Lakes (Admassu, 1998; Admassu & Casselman, 2000; Tesfaye, 2006; Tekle-Giorgis, 1990; Tekle-Giorgis & Casselman, 1995). The lake Hayq supports diverse aquatic biodiversity, including several species of fish, waterfowl, and other aquatic organisms. In addition to its ecological importance, Lake Hayq plays a significant socioeconomic role through tourism and fisheries and serves as a major source of drinking water for the surrounding population (Fetahi et al., 2011).
The purpose of this study was to determine age and growth of O. niloticus in Lake Hayq, Ethiopia, that will be used as a parameter for stock assessment and management investigations for this commercially and ecologically important species.
Materials and Methods
Lake Hayq (also known as Loggo) is a freshwater lake located in the South Wollo Administrative Zone of the Amhara National Regional State, Ethiopia. The lake lies at an elevation of approximately 2,030 m above sea level and is situated at about 11°15' N latitude and 39°57’ E longitude (Baxter, 1970). Lake Hayq has a surface area of about 23 km², with an average depth of 37 m and a maximum depth of 88.2 m (Baxter, 1970).
Fish species recorded in Lake Hayq include Nile tilapia (O. niloticus), locally known as “Kerosso”; African catfish (Clarias gariepinus), locally called “Ambaza”; common carp (Cyprinus carpio), locally known as “Duba”; and Garra dembecha, locally referred to as “Yewenz Assa,” meaning river fish. However, only Nile tilapia, African catfish, and common carp are commonly consumed by local communities. G. dembecha has no direct economic value in the area and is not marketed by fishermen, although it is occasionally used as bait for catching catfish using hook-and-line fishing methods (Getahun & Stiassny, 1998; Kebede et al., 1992). Despite its limited economic importance, G. dembecha plays an ecologically significant role in the lake ecosystem (Fig. 1).
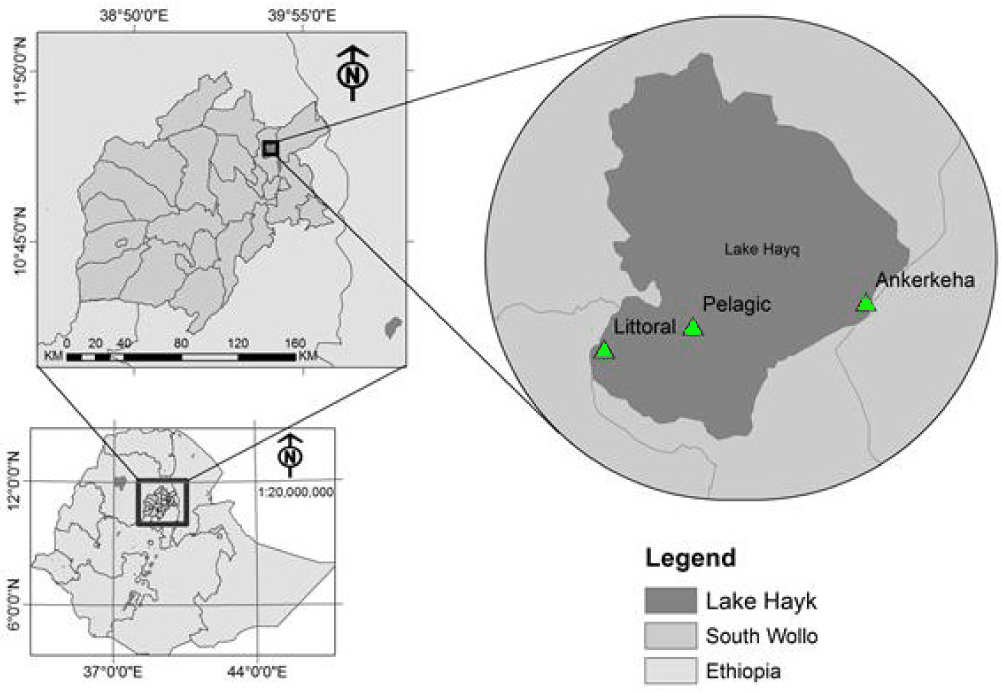
Fish samples were collected using monofilament gillnets of 4, 8, 10 and 12 cm stretched mesh sizes, 50 m in length and 1.5 m width. Nets were set every month from June 8, 2022 to June 7, 2023. Each month, fish were collected from the shore, open water and river mouth sampling sites. The total length (TL, cm) and total weight (TW; 0.1 g) of each specimen were measured using a measuring board and sensitive balance, respectively. Both sagittal otolith samples were taken by making an incision at the dorsal part of the skull right behind the operculum. Otoliths were cleaned and placed in 2 ml labeled otoliths vials (Tekle-Giorgis & Casselman, 1995).
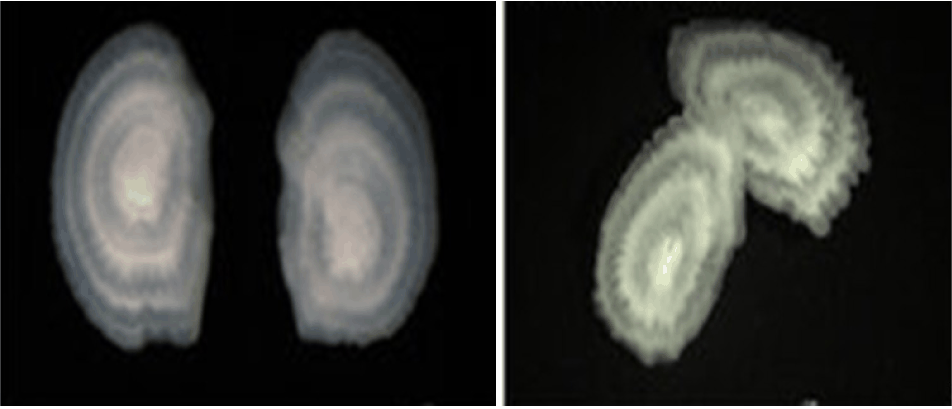
Sagittal otoliths were kept soaked and dried in the otolith vials. From these pairs of otoliths, one sagittal was randomly chosen (Al-Kiyumi, 2013; Bokhutlo, 2011; Panfili et al., 2001) and prepared on the convex side through grinding (Admassu & Casselman, 2000) with carborundum paper of 400 & 600 gri sizes (Carborundum Company, Chennai, India) (Admassu & Casselman, 2000; Tefera et al., 2019). The macro-opaque zones were properly distinguished when the hind side of the convex side was ground (thinned) equal in size to the canal sulcus acusticus of the sulcus tympanicus area of the petrosal bone of the skull (Tekle-Giorgis & Casselman, 1995). Microscopically examined through a dissecting microscope in a darkly lighted background in an Italian optical microscope, the light and pale portion or opaque areas in the sagittal otolith represented the rapid growth zone areas.
Formation of the translucent zone was measured by the frequency of otoliths having a translucent macrozone at the edge (Admassu & Casselman, 2000; Tekle-Giorgis & Casselman, 1995). Discontinuous annuli, which are those that are incomplete, with pale colors and often found in the anterior part of the otoliths near the core, are false annuli and therefore excluded (Admassu & Casselman, 2000). The age of the fish was determined by estimating the total number of translucent macrozones in the otoliths, considering the time of translucent zone formation.
To hold impartial readings, translucent zones of otoliths were counted twice for every otolith without knowledge on (fish size and date of capture) (Admassu & Casselman, 2000; Panfili et al., 2001; Tekle-Giorgis & Casselman, 1995).
Marginal increment analysis (MIA) was used to validate the periodicity of growth zone formation. The marginal increment (MI) is the width of the opaque macrozone on the edge divided by the mean width of that particular opaque zone in O. niloticus that are caught later and completed their current seasonal growth (Tekle-Giorgis & Casselman, 1995). That period of time, when the relative MI is lowest, was then taken as the time of translucent zone formation. In addition, the time when there is a slight increase in a relative MI is conceived to be the period of completion of translucent zone formation (Tekle-Giorgis & Casselman, 1995). In addition to MIA, edge analysis model was also used to validate the periodicity of growth zone formation using R statistical software (Okamura & Semba, 2009). The model was fitted for no peaks formed, one peak formed and two peaks formed per year. The model was fitted for the total number of otoliths examined and the number of otoliths that has translucent zone at the edge for each month. The model with the lowest Akaike information criterion (AIC) value was taken as the best fit.
To validate the proportionality between the somatic growth of fish and otolith, a regression relationship between the length of a fish and the radius of its otolith was established for 24 otolith specimens (Admassu & Casselman, 2000). After fixing the magnification of the microscope using a stage micrometer (50 mm units), the maximum posterior radius of each otolith was measured using an ocular micrometer (10-micrometer units). The width of the opaque zone at the edge of otoliths was also measured along the maximum posterior radius. According to Maceina & Betsill (1987), the relationship between the size of a hard structure and fish length is expected to be proportional. A linear function was used to describe the relationship lj = bXj + a, where, lj = length of the fish (j) (cm), Xj = size of the corresponding otolith radii (mm) and a and b are regression parameters (Admassu & Casselman, 2000; G<ómez-M<árquez et al., 2008).
Estimation of growth parameters for O. niloticus can be calculated using a fish length-related growth model following the von Bertalanffy growth equation presented as follows:
Where, Lt = fish length at the age of t (cm); L∞ = asymptotic length (cm); K = growth rate coefficient (per year); t0 = theoretical age at zero length in fish (years); t = fish age. After that, the theoretical age of zero length in fish (t0) was determined using the following formula (Pauly, 1980):
Results and Discussion
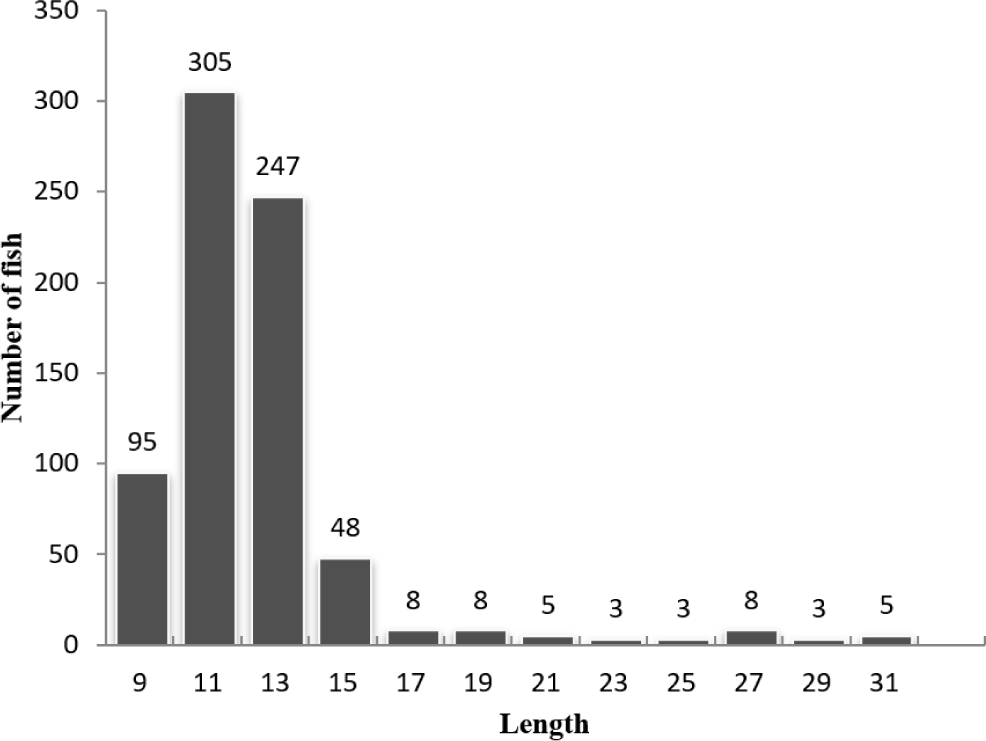
A total of 738 fish sample were collected from the three sampling sites. Of the total, 316 were males and 422 were females. High number of the specimens was recorded shoreline (270), open water (255) and river mouth (213) sites. The collected sample ranged from 9 cm to 32 cm in the total length and from 14 to 495 g in total weight. Of the fish sampled 87.7% were ≤ 13 cm, (Fig. 2).
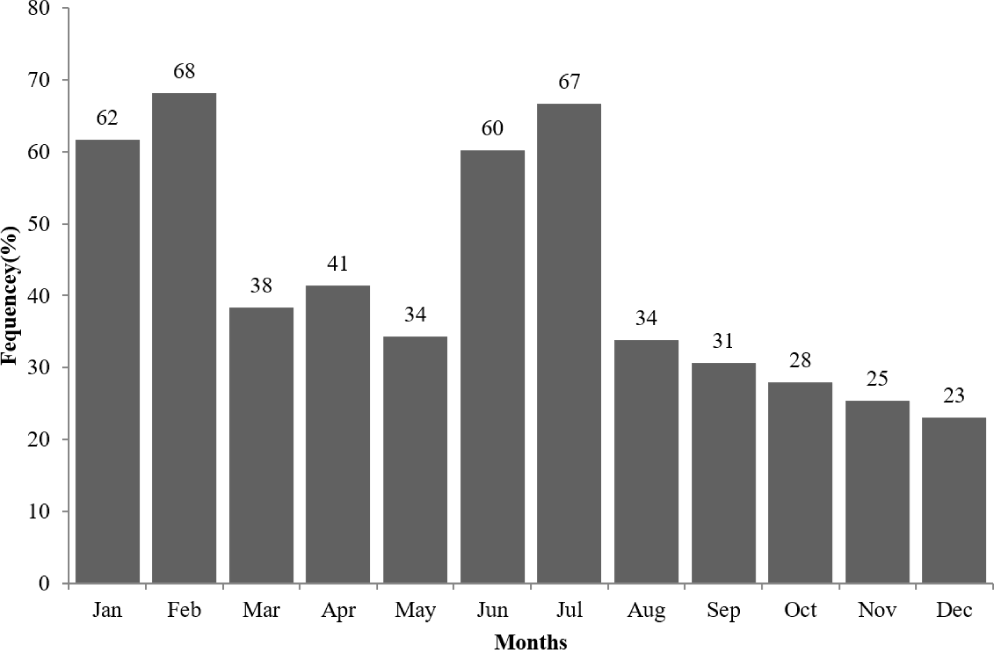
Growth zone were visible as alternating opaque and translucent bands. Visibility of the translucent zones decreases as the fish length increase. Otoliths that had translucent zones at the margin were present in all sampling occasions, but their frequency of occurrence varied with the season (Fig. 3). The highest percentages of translucent zone occurrence were recorded in January, February, June, and July ranging from 62% to 68%. The distributions of translucent zones were bimodal with a first maximum from January to February and a second one from June to July. Therefore, two translucent and two opaque zones were formed per year.
The age composition of O. niloticus in Lake Hayq indicates a population dominated by younger age classes, with individuals aged two years forming the largest proportion of the catch (41.3%). This dominance of age group 2 suggests strong recent recruitment and relatively rapid early growth, enabling fish to quickly enter the fishable stock. The high representation of age groups between 1 and 1.5 years further supports the presence of successful juvenile survival and favorable environmental conditions during early life stages (Table 1).
| Age | Composition (%) |
|---|---|
| 0.5 | 12 |
| 1 | 41 |
| 1.5 | 34 |
| 2 | 7 |
| 2.5 | 1.1 |
| 3 | 1.1 |
| 3.5 | 0.7 |
| 4 | 0.4 |
| 4.5 | 0.4 |
| 5 | 1.1 |
| 5.5 | 0.4 |
| 6 | 0.7 |
In contrast, older age classes (≥ 3 years) were poorly represented, together accounting for a small fraction of the population. This pattern may reflect high fishing mortality, particularly the selective removal of larger and older individuals, or increased natural mortality with age. The low contribution of age groups above four years, despite a maximum life span of six years, suggests that few individuals survive to older ages in the lake.
The presence of multiple age classes (0.5–6 years) indicates continuous recruitment and a stable breeding population. However, the skewed age structure toward younger fish implies a fast-growing but heavily exploited stock, where growth is sufficient to sustain recruitment but longevity is constrained. Overall, the age and growth pattern of O. niloticus in Lake Hayq is characteristic of a population under moderate to high exploitation, emphasizing the need for management measures that protect older, larger individuals to maintain spawning biomass and long-term sustainability (Fig. 4).
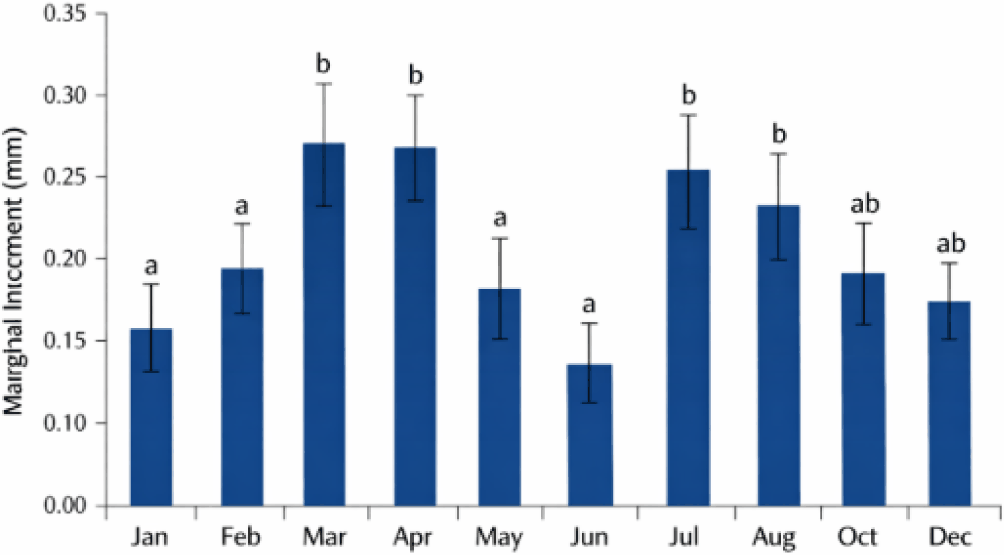
The bar graph of MI in O. niloticus otoliths illustrates clear seasonal variation in growth throughout the year (Fig. 5). The x-axis represents months from January to December, while the y-axis shows MI in millimeters. Bars indicate the mean MI per month, with error bars representing standard deviation, and letters above the bars denote significant differences based on Tukey’s honestly significant difference (HSD) test (p < 0.05). Two distinct low-growth periods were observed in January–February and June–July, corresponding to the smallest MI values (~0.1 mm), which likely reflect slower growth due to seasonal factors such as lower temperature, reduced food availability, or reproductive activity. In contrast, March–May and August–October exhibited the highest MI (~0.25–0.28 mm), indicating faster otolith growth under favorable environmental conditions. November and December showed intermediate growth (~0.2 mm), suggesting a gradual transition between slow- and fast-growth periods. Statistical analysis confirmed that MI in January–February and June–July was significantly lower than in March–May and August–October, while some months (e.g., November–December) did not differ significantly from either group (Fig. 5). These results demonstrate a biannual growth pattern consistent with the MIA and indicate that otolith deposition in O. niloticus is strongly influenced by seasonal environmental variation, with slow-growth periods likely associated with environmental stress or spawning events and fast-growth periods reflecting optimal feeding and metabolic conditions.
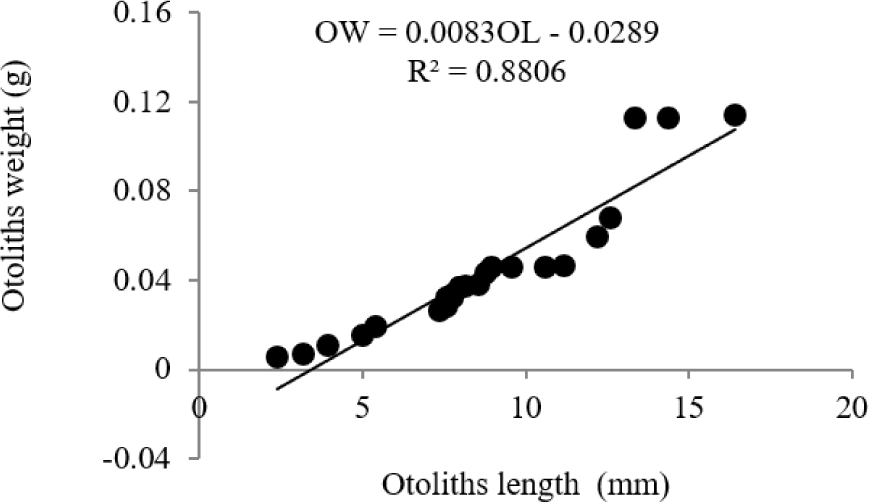
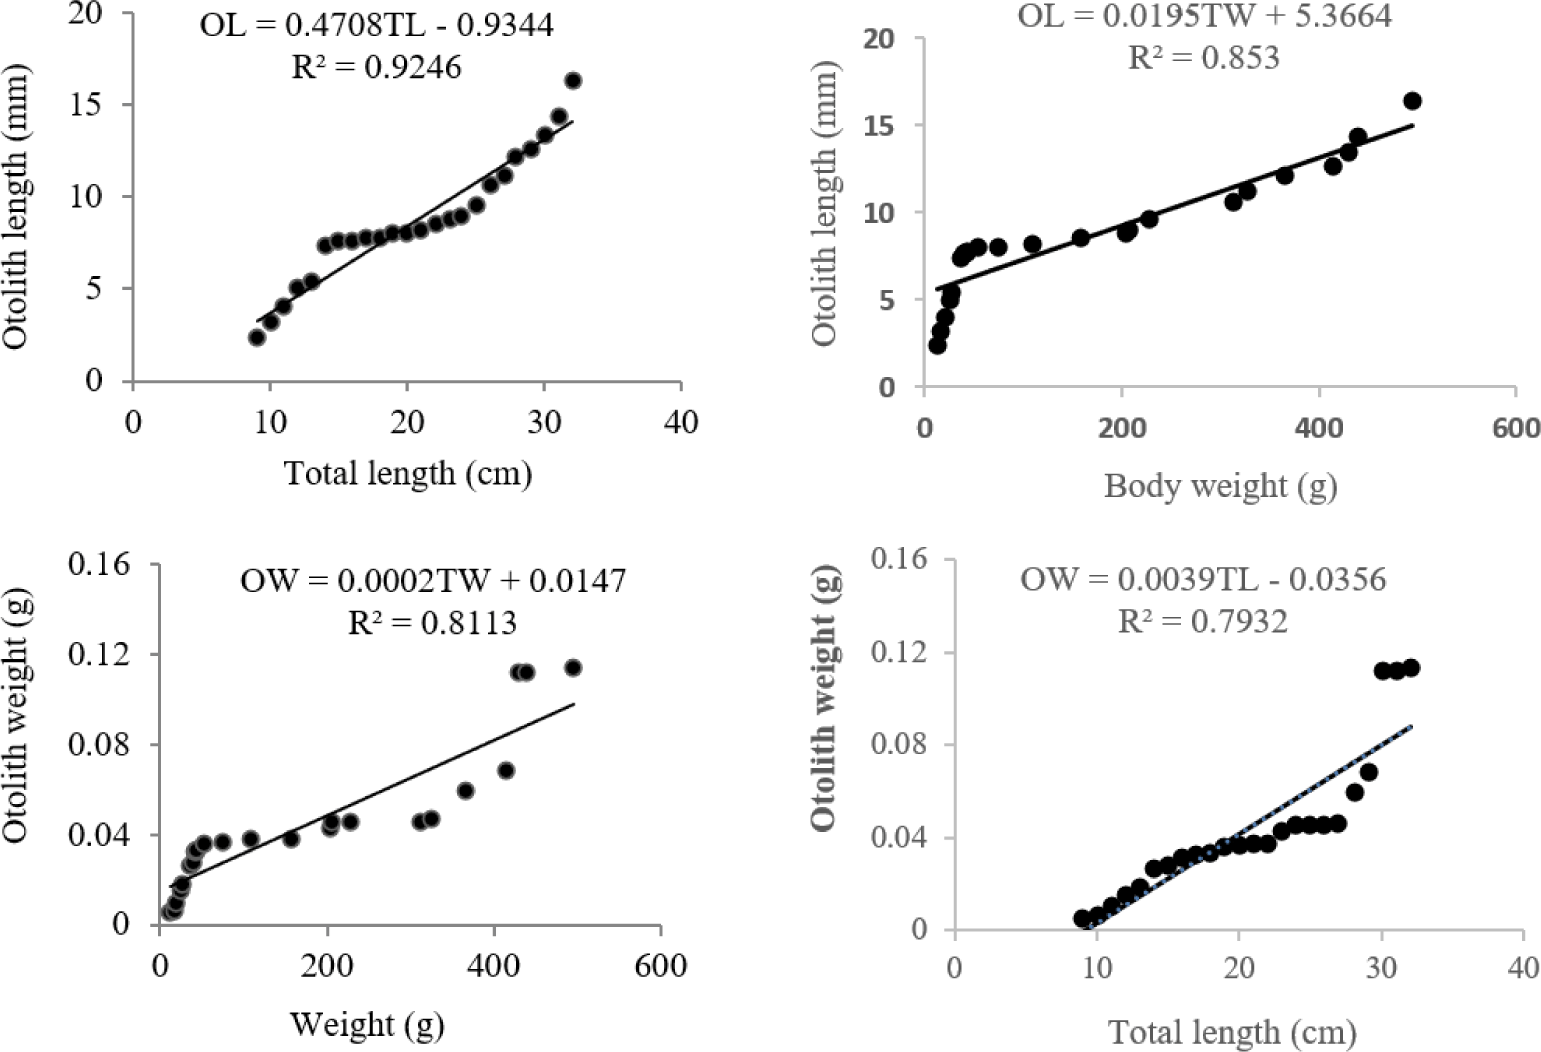
A strong relationship between otolith length and otolith weight (R2 > 0.88) was set up in O. niloticus (Fig. 6). The relationship between total length and otolith size were (R2 > 0.92) are shown in Fig. 7. Otolith weight was set up to be stylish identified with fish weight (R2 > 0.81).
The estimated length-at-age of O. niloticus in Lake Hayq was comparable to that reported for Lake Tana, but lower than estimates from Lake Koka based on length-based growth analyses. In contrast, growth in Lake Hayq exceeded that reported for Lakes Ziway and Hawassa (Alemu, 1995; Admassu, 1998; Tesfaye & Wolff, 2015) (Table 2). Under favorable tropical conditions, O. niloticus may attain total lengths of 14–16 cm within its first year of life (Rinne, 1976).
| L∞ (cm) | K (yr−1) | Ø'L | Lake | Reference |
|---|---|---|---|---|
| 31 | 0.90 | 2.93 | Lake Hayq | Present study (age data) |
| 31.5 | 0.94 | 2.96 | Lake Hayq | Present study (length frequency) |
| 36.6 | 0.80 | 3.00 | Lake Hayq | Admassu (1998) |
| 34.4 | 0.90 | 3.0 | Lake Hayq | Alemu (1995) |
| 45.1 | 0.21 | 2.83 | Lake Tana | Degsera et al. (2020) |
| 35.7 | 0.50 | 2.83 | Lake Tana | Wudneh (1998) |
| 44.5 | 0.41 | 2.90 | Lake Koka | Tesfaye & Wolff (2014) |
| 44.1 | 0.26 | 2.70 | Lake Koka | Tesfaye (2006) |
| 36.6 | 0.40 | 2.73 | Lake Koka | LFDP (1997) |
| 32.1 | 0.31 | 2.51 | Lake Langano | Tesfaye (2006) |
| 28.1 | 0.43 | 2.53 | Lake Ziway | Tesfaye (2006) |
| 28.1 | 0.50 | 2.70 | Lake Ziway | Admassu (1998) |
| 35 | 0.28 | 2.54 | Lake Hawassa | Admassu (1998) |
| 64.6 | 0.25 | 3.00 | Lake Victoria | Getabu (1992) |
| 71.5 | 0.14 | 2.80 | Lake Itassy | Moreau (1979) and Getabu (1992) |
| 70.4 | 0.41 | 3.3 | Kainji | Moreau (1979) |
| 57.8. | 0.55 | 3.3 | Lake Nasser | Moreau (1979) |
| 48.8 | 0.50 | 3.1 | Mobutu | Moreau (1979) |
| 64.6 | 0.25 | 3.0 | Nyanza Gulf | Getabu (1992) |
| 31.4 | 0.69 | 2.8 | Egypt (pond) | Jensen (1957) |
| 26.8 | 0.47 | 2.5 | Syria | El Bolock & Koura (1961) |
| 39.9 | 0.42 | 2.8 | Chad | Placke et al. (1964) |
| 29.4 | 0.594 | 2.71 | Lake Mariout | Moreau et al. (1986) |
| 29.4 | 0.294 | 2.41 | Lake Manzala | Moreau et al. (1986) |
| 32.6 | 0.356 | 2.58 | Nozha Hydrodome | Moreau et al. (1986) |
| 36.9 | 0.545 | 2.87 | High DamLake Female | Yamaguchi et al. (1990) |
| 42.8 | 0.384 | 2.85 | High DamLake Male | Yamaguchi et al. (1990) |
| 28.73 | 0.46 | 2.58 | Lake Timsah | El-Ganainy & Hassan (2008) |
Observed inter-lake differences in growth performance are likely attributable to spatial variation in environmental conditions, including food availability and quality, thermal regimes, and population density. For instance, the relatively enhanced growth of O. niloticus in Lake Hawassa compared to Lake Ziway has been attributed to the greater availability of nutritionally superior food resources (Admassu, 1998). However, the lack of detailed information on the diet composition and trophic conditions of O. niloticus in Lake Hayq limits comprehensive inter-lake comparisons. In addition, fishing pressure can substantially influence growth dynamics by altering population size structure and growth parameters through selective removal of larger and faster-growing individuals (Ojuok et al., 2007).
Otolith macrostructure analysis demonstrated the formation of two translucent zones per year (biannuli) in O. niloticus from Lake Hayq, a pattern validated through MIA and edge-type assessment. The occurrence of biannuli in calcified tissues has been widely reported for O. niloticus and other tropical fish species (Admassu, 1998; Admassu & Casselman, 2000; Alemu, 1995; Bwanika et al., 2007; Tekle-Giorgis, 1990; Tekle-Giorgis & Casselman, 1995). Conversely, annual annulus formation has been documented in some cichlid species, such as Tropheus moorii from Lake Tanganyika (Egger et al., 2004), emphasizing that annulus periodicity is species-specific and strongly influenced by local environmental conditions.
In Lake Hayq, translucent zones occurred seasonally at the otolith margin, with peak formation during January–February and June–July. Although the precise mechanisms underlying translucent zone formation remain incompletely understood, several interacting factors have been proposed, including seasonal thermal fluctuations (Admassu, 1998; Grammer et al., 2012; Tekle-Giorgis & Casselman, 1995), variation in food availability and nutritional quality (Alemu, 1995; Tekle-Giorgis, 1990), and changes in physiological condition associated with reproductive activity (Gómez-Márquez et al., 2008; Jimenez-Badillo, 2006; Tekle-Giorgis & Casselman, 1995).
Water temperature is considered one of the most influential drivers of annulus formation in fish otoliths. In the present study, periods of minimum water temperature coincided with the timing of biannuli formation. Similar relationships have been reported for immature O. niloticus in Lake Hawassa, where seasonal temperature variation was identified as a primary determinant of biannuli formation (Tekle-Giorgis & Casselman, 1995). In Lake Ziway, the formation of biannuli corresponded with annual temperature ranges of approximately 5℃–6℃, while temperature fluctuations of 3℃–5℃ were shown to significantly influence somatic and otolith growth in O. niloticus (Admassu, 1998).
Optimal growth of O. niloticus occurs within a thermal range of 28℃–36℃, with both growth rate and feeding activity declining substantially at lower temperatures (Caulton, 1982; Teichert-Coddington et al., 1997). Gómez-Márquez (1998) further reported the formation of two translucent zones in O. niloticus, one of which developed during December–January when water temperatures declined to approximately 21℃. Comparable findings were reported for T. moorii in Lake Tanganyika, where seasonal temperature extremes resulted in growth deceleration and the formation of growth zones (Egger et al., 2004). Accordingly, the reduced water temperatures experienced in Lake Hayq during January–February are likely a primary factor contributing to translucent zone formation.
Food availability and nutritional quality also play a critical role in growth zone formation. Reduced food quality has been associated with the development of checks on scales and translucent zones on otoliths of O. niloticus in Lake Hawassa (Admassu, 1998; Tekle-Giorgis, 1990), a pattern similarly reported for Lake Hayq (Alemu, 1995). In Lake Tana, the diet of O. niloticus is dominated by phytoplankton taxa including Aulacoseira, Navicula, Nitzschia, Microcystis, Scenedesmus, Pediastrum, and Chroococcus spp. (Tadesse, 2011). These taxa typically exhibit peak abundance during post-rainy and dry seasons but decline markedly during the rainy season (Wondie & Akoma, 2008), coinciding with periods of translucent zone formation and suggesting a link between reduced food availability and slowed somatic growth.
Reproductive activity may further exacerbate growth reduction and contribute to translucent zone formation. The breeding season of O. niloticus extends from April to August, with peak spawning occurring during June–July (Tadesse, 1997), corresponding closely with one of the biannuli formation periods observed in this study. Mouthbrooding behavior in females results in reduced feeding, while males allocate considerable energy to nest construction, territory defense, and repeated spawning activities, collectively leading to reduced somatic growth (Gómez-Márquez et al., 2008; Jimenez-Badillo, 2006). Consequently, reproductive investment is likely a key factor contributing to translucent zone formation in Lake Hayq, consistent with observations from Lakes Hawassa, Hayq, and Ziway (Admassu, 1998).
Otolith length and relationships among fish length and otolith length and length-weight relationship of otolith can be used in feeding ecology assessment for calculating fish size and weight. There are limited studies available on the association among fish length and otolith length and length–weight relationship of otolith for the desired species and almost all else on otolith length relationships for O. niloticus. Various researchers have stated that relationships among fish length and otolith length can be used for reverse calculation of fish length from otolith length (Ankita & Khan, 2022).
Strong correlation between fish length and otolith sizes indicates that the physical development has a great effect on otolith development. There are reviews with similar correlations found between the physical and otolith size (Aneesh-Kumar et al., 2017; Yilmaz et al. 2019) (Table 3). In the current study, linear regressions between fish length and otolith sizes (length) showed greater values of determination (R2 > 0.92) in O. niloticus. Various types of factors are that affect the relationship between fish length and otolith sizes such as differences in fish types, niche conditions, emptiness of foods, as well as different elements in the surroundings (Aydin et al., 2004). Therefore, further investigation on the effect of these elements is greatly warranted.
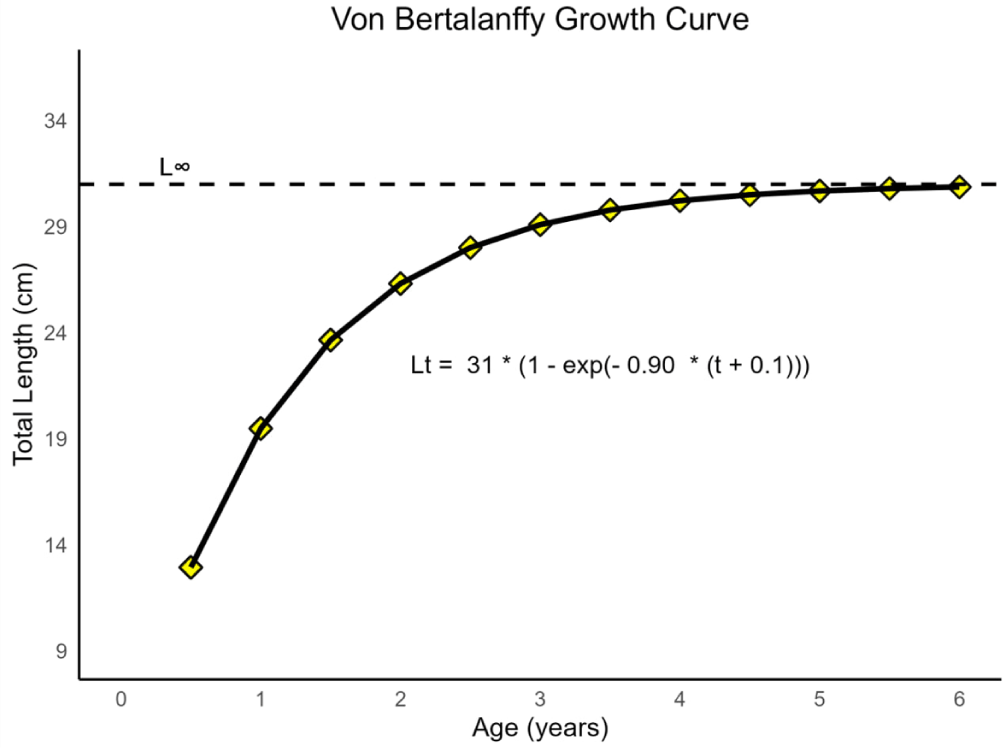
The value of asypmptotic length (L∞) estimated in this study is lower than that reported before for O. niloticus in Ethiopian and other Africa water bodies (Table 2). A value of 31 cm was estimated for L∞ compared to a size of 36.6 cm of the largest fish recorded in previous study. Similar result was reported from Lake Ziway with L∞ = 28.1 cm (Tesfaye, 2006). Compared to the former study on growth parameter of O. niloticus with L∞ = 36.6 and growth coefficient (K) = 0.8 of Lake Hayq (Admassu, 1998), both L ∞ and K are different values in this study. This may be attributed to difference of slice system and experience of reading of otoliths. Larger size of fish was recorded from lake Hayq (Admassu, 1998), which is 36.6cm compared to this study (Lmax = 32 cm). Compared to former study of growth parameter of O. niloticus from lake Hayq (Alemu, 1995). However, for this study on growth parameter of O. niloticus with L∞ = 31 cm and a value of 0.90 per year (from age data)(Fig. 8). Similarly for L∞ = 31.5 cm and 0.94 per year. These values are attained from length–frequency data. There is a difference between value of L∞ and K of this study this may attributed to difference of sampling techniques and experience of reading of otoliths.
At Lake Koka, varying estimates of the growth parameters were considered for O. niloticus at different occasions. Estimates of L∞ and K by Lake Fishery Development Project (LFDP, 1997) and Gashaw Tesfaye (2006) were given as 36.6 cm, 0.40 and 44.1 cm, 0.26, respectively. Sampling techniques (length) might have been the cause for the variation in the growth parameters. At Lake Koka, the estimates of L∞ and K were lower in the age-based estimation method (44.1 cm and 0.26 per year) as compared to that in the length frequency method (45.5 cm and 0.36 years) (Tesfaye, 2006). There might also be variations in the value of the growth rate due to the varying levels of food or O. niloticus population density.
Conclusion
A total of 738 fish samples were collected from all sampling sites. Of the total, 316 were male and 422 were female. A high wide variety of the samples were recorded at shoreline (270), open water (255) and river mouth (213) sites. The collected samples ranged from 9.3 to 32 cm in TL and from 14 to 495 g in TW. Of the fish sample 87.7 % were ≤ 13 cm. in the present study otolith was used for age determination of O. niloticus in Lake Hayq and the maximum life span of this species was 6 years. The seize of O. niloticus composed of 12 age group from 0.5 to 6 and age group 2 was the most frequent one (41.3). A strong relationship between otolith length and otolith weight (R2 > 0.88) was found in O. niloticus. The relationship between fish length and otolith length (length and length) were (R2 > 0.92) and otolith weight was found to be affable identified with fish weight (R2 > 0.81). Otolith morphology and morphometric relationship are precious parameter for stock identification and can also be used in studying fish feeding ecology to estimate prey size and biomass.