


Background
Yellowfin tuna Thunnus albacares is a large tuna species found in the Pacific, Indian and Atlantic oceans. It is an important component of tuna fisheries worldwide and is one of the major target species for the tuna fishery in the major oceans, and popularly catched marine fish with annual availability of 44,013 t on overseas fishery in Korea during 2013 (Ministry of Ocean and Fisheries 2014). It is used extensively in raw cuisine such as sushi and sashimi. Byproducts such as scales, heads, skin, fat, visceral, and roe are generated increasingly and discarded as waste, without any attempt to recover the essential nutrients (Chalamaiah et al. 2010). Among by-products, roes are highly nutritious material rich in essential fatty acids and amino acids (Heu et al. 2006; Narsing Rao et al. 2012b). Fish roes are produced in large quantities during the spawning seasons, which constitute about 1–3 % of the weight of fish (Chalamaiah et al. 2013; Klomklao et al. 2013; Intarasirisawat et al. 2011). Currently roe obtained from fish such as salmon, cod, and pollock have a potential commercial market, especially they have a higher demand in Asian countries (Sathivel et al. 2009). Yellowfin tuna roe is an abundant and underutilized byproduct that can be used as a unique protein source (Heu et al. 2006). The roe can be used to recover protein that may be converted into a higher value food ingredient suitable for use as an emulsifier in food and feed systems (Sathivel et al. 2009).
Protein concentrates are widely used as ingredients in food industry because of their high nutritional quality, functional properties, high protein level and low content of antinutritional factors (Cordero-de-los-Santos et al. 2005). Using fish proteins in powder form presents some advantages since they do not require special storage conditions and they can also easily be used as an ingredient in foods (Pires et al. 2012). Drying preserves fish by inactivation enzymes and removing the moisture necessary for bacterial and mold growth (Bellagha et al. 2002; Bala and Mondol 2001; Duan et al. 2004). Recently, protein concentrate preparation have been reported for different protein sources such as roe of Channa striatus and Lates calcarifer (Narsing Rao et al. 2012a), byproducts of Alaska pollock (Sathivel and Bechtel 2006), mrigal egg (Chalamaiah et al. 2013) and roes of hake and ling (Rodrigo et al. 1998).
Before the drying process, boiling and steaming of fish improve their digestibility, enhances palatability, and provide a safe eating by killing harmful bacteria, other micro-organisms and parasites. Thus, means of processing are required to convert the underutilized yellowfin tuna roes into more marketable and acceptable forms as protein concentrate. There is no information about protein concentrate by cook-dried process. The objectives of this study were to investigate chemical characteristic for protein concentrate from yellowfin tuna roe prepared by cook-dried process and to identify possibility on utilization of 2’nd byproduct. Hence, we expected that full utilization for fish roe concentrate will be possible by reducing the 2’nd byproduct wastage and environmental pollution.
Methods
Yellowfin tuna Thunnus albacares roe was obtained from Dongwon F&B Co., Ltd. (Changwon, Korea). Roe was stored at −70 °C in sealed polyethylene bags, and transferred to the laboratory. Frozen roe was partially thawed for 24 h at 4 °C and then cut into small pieces with an approximate thickness of 1.5–3 cm and minced with food grinder (SFM-555SP, Shinil Industrial Co., Ltd., Seoul Korea). Minced roe was frozen at −20 °C until used.
Sodium dodecyl sulfate (SDS) and glycine were purchased from Bio Basic Inc., (Ontario, Canada). Coomassie Brilliant Blue R-250 was purchased from Bio-Rad Laboratories (Hercules, CA, USA). Bovine serum albumin (BSA), β-Mercaptoethanol (β-ME), egg white, glycerol, N,N,N′,N′-tetramethyl ethylene diamine (TEMED), sodium carbonate, sodium hydroxide, sodium L-tatarate, and potassium hydroxide were purchased from Sigma-Aldrich Co., Ltd. (St. Louis, MO, USA). Copper (II) sulfate pentahydrate was purchased from Yakuri Pure Chemicals Co., Ltd. (Kyoto, Japan). Bromophenol blue and Folin-Ciocalteu’s reagent were purchased Junsei Chemical Co., Ltd. (Tokyo, Japan). All reagents used analytical grade.
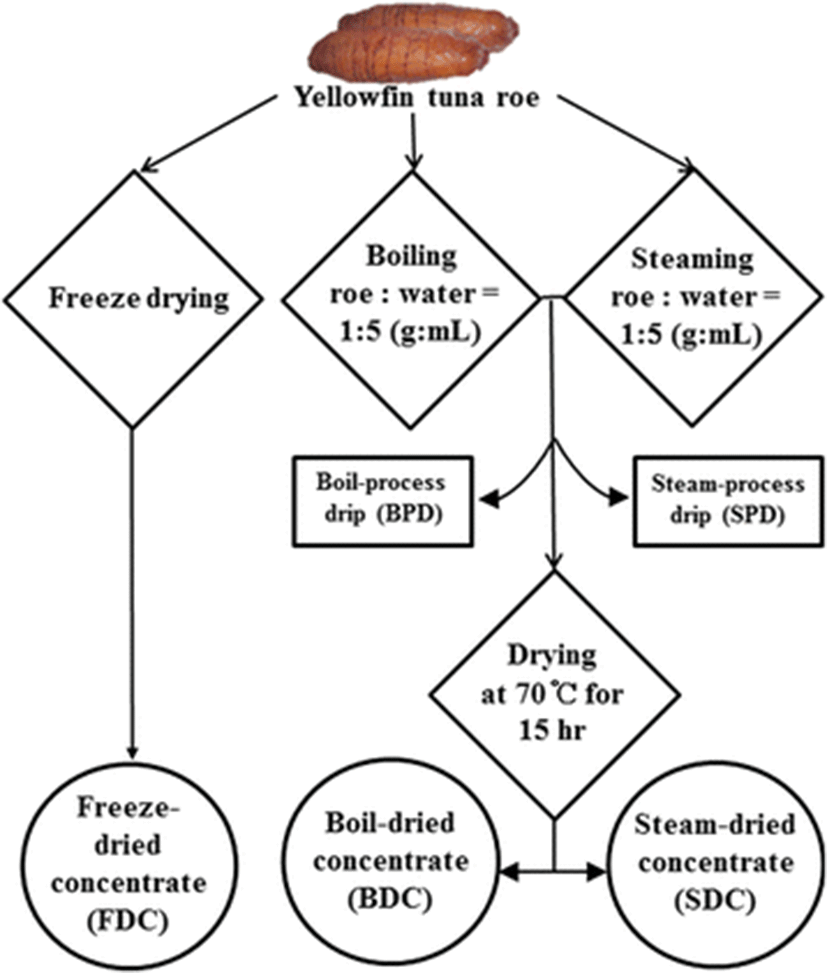
300 g of frozen minced roe was put into pouch type tea bag (polyethylene polypropylene, 16 × 14.5 cm) for cook-dried process. Freeze-dried concentrate (FDC) as an un-cooked sample was prepared using freeze dryer (PVTFD50A, ilShinbiobase Co., Ltd., Dongducheon, Korea). To prepare the boil-dried concentrate (BDC), sample immerged in five volume of distilled deionized water (DDW) and was boiled for 20 min after sample core temperature was reached to 80 °C. In case of steam-dried concentrate (SDC), sample was steamed for 20 min after sample core temperature was reached to 80 °C. Cooked (boiled or steamed) samples were dried at 70 ± 1 °C for 15 h using an incubator (VS-1203P3V, Vision Scientific, Co., Ltd., Daejeon, Korea). Boil or steam-dried samples were ground to powder using a food grinder and sieved to pass through a 180 mesh to obtained dehydrated RPCs. Grounded powders were referred to as BDC and SDC, respectively. During these processes, cooking process drips such as boil-process drip (BPD) and steam-process drip (SPD) were generated as the 2’nd byproduct. They were packed in plastic bottles and stored at −20 °C for further experiments. A flow chart for the preparation of roe protein concentrates (RPCs) is shown in Fig. 1.
The proximate composition was determined according to the AOAC method (AOAC 1995). Moisture content was determined by placing accurately weighed 0.2 g of sample into an aluminum pan. Sample was dried in a forced-air convection oven (WFO-700, EYELA, Tokyo, Japan) at 105 °C until a constant weight was reached. The ash content was determined by charring approximately 0.1 g of sample in a ceramic crucible over a hot plate and then heating in a muffle furnace (Thermolyne 10500 furnace, a subsidiary of Sybron Co., Dubuque, IA, USA) at 550 °C until a constant final weight for ash was achieved. The total crude protein (nitrogen x 6.25) content of samples was determined using the semi-micro Kjeldahl method. Protein concentration of cooking process drips was determined by the method of Lowry et al. (1951) using bovine serum albumin as a standard. Total lipid content was determined according to the Soxhlet extraction method. 5 g of sample was extracted with dimethyl ether and performed for 30 min at a drip rate of 10 mL/min. Total lipid content was determined on a gravimetric basis and expressed as percent.
Total amino acid analysis was conducted according to AOAC method (AOAC 1995). The sample (20 mg) was hydrolyzed with 2 mL of 6 N HCl at 110 °C for 24 h in heating block (HF21, Yamoto Science Co, Tokyo, Japan) and filtered out using vacuum filtrator (ASPIRATOR A-3S, EYELA, Tokyo, Japan). Amino acids were quantified using the amino acid analyzer (Biochrom 30, Biochrom Ltd., Cambridge, United Kingdom) employing sodium citrate buffers (pH 2.2) as step gradients. The data are reported as g of amino acid per 100 g of protein. Asparagine is converted to aspartic acid and glutamine to glutamate during acid hydrolysis, so the reported values for these amino acids (Asp and Glu) represent the sum of the respective amine and amino acid in the proteins.
Analysis of iron (Fe), copper (Cu), manganese (Mn), cadmium (Cd), nickel (Ni), lead (Pb), zinc (Zn), chromium (Cr), magnesium (Mg), sodium (Na), phosphorus (P), potassium (K), calcium (Ca), and sulfur (S) contents in sample was carried out using the inductively coupled plasma optical emission spectrophotometry (OPTIMA 4300 DV, Perkin Elmer, Shelton, Conn., USA). Briefly, teflon digestion vessel was washed overnight in a solution of 2 % nitric acid (v/v) prior to use.
Sample was dissolved in 10 mL of 70 % nitric acid. The mixture was heated on the hot plate until digestion was completed. The digested samples were added in 5 mL of 2 % nitric acid and filtered using filter paper (Advantec No. 2, Toyo Roshi Kaisha, Ltd., Tokyo, Japan). Sample was massed up to 100 mL with 2 % nitric acid in a volumetric flask. Sample was run in triplicate. The concentration of mineral was calculated and expressed as mg/100 g sample.
Hunter color properties of samples were equilibrated to room temperature for 2 h prior to the color measurement. Colors were determined using color meter (ZE-2000, Nippon Denshoku Inc., Japan). The colorimeter was calibrated by using a standard plate (L* = 96.82, a* = −0.35, b* = 0.59) supplied by the manufacturer. The values for the CIE (Commission Internationale d’Eclairage of France) color system using tristimulus color values, L* (lightness), a* (redness), and b* (yellowness) were determined. The whiteness was calculated by the following equation:
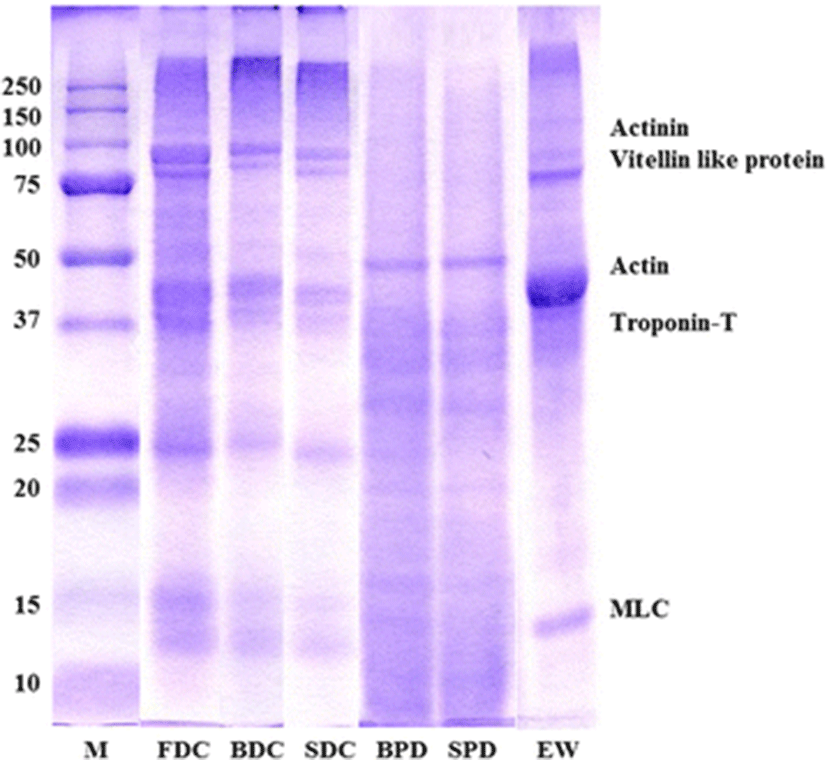
The molecular weight distribution of YTR and RPCs was observed by sodium dodecyl sulfate polyacrylamide gel electrophoresis (SDS–PAGE). It was performed according to the method of Laemmli (1970). Briefly, 10 mg of sample was solubilized in 1 mL of 8 M urea solution containing 2 % β-mercaptoethanol and 2 % sodium dodecyl sulfate (SDS) solution. Protein solution was mixed at 4:1 (v/v) ratio with the SDS-PAGE sample treatment buffer (62.5 mM Tris–HCl (pH 6.8), 2 % SDS (w/v), 10 % glycerol, 2 % β-mercaptoethanol and 0.002 % bromophenol blue) and boiled at 100 °C for 3 min. The sample (20 μg protein) was loaded on the 10 % Mini-PROTEAN® TGX™ Precast gel (Bio-Rad Lab., Inc., Hercules, CA, USA) and subjected to electrophoresis at a constant current of 10 mA per gel using a Mini-PROTEANⓇ tetra cell (Bio-Rad Lab., Inc., Hercules, CA, USA).
Electrophoresed gel was stained in 0.125 % Coomassie brilliant blue R-250 and destained in 25 % methanol and 10 % acetic acid until background was clear. Molecular weight of protein bands was estimated using Precision Plus Protein™ standards (10–250 K, Bio-Rad Lab., Inc., Hercules, CA, USA).
All experiments were conducted in triplicates. The average and standard deviation were calculated. Data were analyzed using analysis of variance (ANOVA) procedure by means of the statistical software of SPSS 12.0 KO (SPSS Inc., Chicago, IL, USA). The mean comparison was made using the Duncan’s multiple range test (P < 0.05).
Results and discussions
Proximate compositions of yellowfin tuna roe (YTR) and roe protein concentrates (RPCs) named freeze-dried concentrate (FDC), boil-dried concentrate (BDC) and steam-dried concentrate (SDC) are shown in Table 1. YTR as a raw material contained 77.3 % moisture, 18.2 % protein, 2.4 % lipid and 1.5 % ash. Heu et al. (2006) reported that skipjack and yellowfin tuna roes contained 71.1–71.2 % moisture, 21.4–21.5 % protein, 2.0–2.1 % lipid and 1.9 % ash, and both tuna roes were no difference in proximate compositions. Intarasirisawat et al. (2011) reported that three different tuna species (skipjack, tongol and bonito) roes contained 72.17–73.03 % moisture, 18.16–20.15 % protein, 3.39–5.68 % lipid and 1.79–2.10 % ash. Iwasaki and Harada (1985) described the proximate composition of raw roe from different species with a wide range in protein content (11.5 % in angler fish to 30.2 % in crab). The chemical composition of roes of 18 fish species was reported and the protein content was estimated to be in the range of 11.5–30.2 % (Iwasaki and Harada 1985). Therefore, yellowfin tuna roe could be source of proteins. The yield of RPCs prepared from YTR were 25.3 % for FDC, 22.2 % for BDC and 22.8 % for SDC, respectively, and uncooked FDC was higher than those of cooked BDC and SDC (P < 0.05). It was due to released soluble protein and other compounds to process drip through cook-dried process (boiling or steaming). Moisture and ash content of RPCs ranged from 4.3 to 5.6 %, and 4.3 to 5.7 %, respectively. Lipid content in RPCs was in the range of 10.6–11.3 %. RPCs had a high protein content accounting for 72.3 % for FDC, 77.3 % for BDC and 76.0 % for SDC, but RPCs were lower protein content than 81.4 % egg white as a positive control (P < 0.05). From the result and reports, difference in moisture and protein content of RPCs was due to processing condition (Mahmoud et al. 2008). Narsing Rao et al. (2012a) was reported that Channa and Lates roes yielded 20.7 % and 22.5 % of protein concentrates possessing 90.2 % and 82.5 % protein, respectively. Protein content in the range of 39.1–43 % and fat content in the range of 14.1–14.8 % were reported in dried and salted roes of hake (Merluccius merluccis) and ling (Molva molva) (Rodrigo et al. 1998). Sathivel et al. (2009) was reported that moisture, protein, ash, and fat contents of spray dried soluble protein powder were 4.5 ± 0.5 %, 67.1 ± 0.2 %, 10 ± 1.0 %, and 18.3 ± 0.6 %, respectively. Chalamaiah et al. (2013) was reported that total ash content of dehydrated and defatted protein concentrates was found to be 5.95 % and 1.95 %, respectively.
Data are given as mean values ± SD (n = 3)
Values with different letters within the same column are significantly different at P < 0.05 by Duncan’s multiple range test
FDC freeze-dried concentrate, BDC boil-dried concentrate, SDC steam-dried concentrate, respectively
1) Yield is weight (g) of roe protein concentrate obtained from 100 g of raw YTR
2) Protein yield (g) = yield x protein (%)
During the preparation of yellowfin tuna roe concentrate, boiling process drip (BPD) and steaming process drip (SPD) as 2’nd byproduct were generated through cooking process, and data are shown in Table 2. Moisture content of BPD (92.0 %) was higher than that (90.5 %) of SPD (P < 0.05). Protein content of BPD and SPD were 5.8 and 6.4 %, respectively with no significant difference. Starting process water (600 mL) for cooking process was concentrated to 29.6 (BPD) and 18.1 mL (SPD), respectively. Total protein in BPD (500.2 mg/100 g roe) and SPD (365.6 mg/100 g roe) were meaningful difference. This means that boiling process could be easier released to soluble protein and other compounds than steaming process. The proximate composition of fish roe depends on the age of fish, seasons and type of processing (Iwasaki and Harada 1985).
Sample | Moisture (%) | Protein (%) | Volume (mL/100 g roe) | Proteina (mg/mL) | Total protein (mg) |
|---|---|---|---|---|---|
BPD | 92.0 ± 0.1a | 5.8 ± 0.0a | 29.6 | 16.9b | 500.2 |
SPD | 90.5 ± 0.7b | 6.4 ± 0.5a | 18.1 | 20.2a | 356.6 |
Data are means ± standard deviation of triplicate determinations
Values with different letters within the same column are significantly different at P < 0.05 by Duncan’s multiple range test
BPD boiling process drip, SPD steaming process drip, respectively
aBased on Lowry’s method (1951)
YTR and RPCs contained protein ranged from 81.6 to 83.6 % on a dry base were still a considerable amount of fish protein that could be possible to use as protein resource. To assess protein quality, we determined the content of total amino acid in the YTR and RPCs. Total amino acid composition (g/100 g of protein, %) of RPCs from yellowfin tuna roe and positive control (egg white) is shown in Table 3. The major non-essential amino acids of YTR were glutamic acid (12.3 %), aspartic acid (9.1 %) and arginine (6.6 %), respectively. Leucine (8.8 %) and lysine (8.5 %) were the major essential amino acids in YTR. Intarasirisawat et al. (2011) reported that leucine (8.28–8.64 %) and lysine (8.24–8.30 %) were the predominant essential amino acids in defatted tuna roe from skipjack, tongol and bonito. YTR had an essential amino acids/non-essential amino acids ratio of 1.11. From these results, total essential amino acids content of YTR (52.6 %) was higher than total non-essential amino acids content of that (47.4 %). The major non-essential amino acids of RPCs were glutamic acid (13.1–13.2 g/100 g of protein), aspartic acid (8.7–9.2 %) and arginine (6.5–6.6 %), respectively. Among RPCs, glutamic acid (13.1–13.2 %) was the predominant essential amino acid followed by aspartic acid (8.7–9.2 %), leucine (8.5–8.6 %) and lysine (8.5 %). Amino acids namely glutamic acid (13.14 g), aspartic acid (8.08 g) and leucine (7.57 g) were reported per 100 g roe protein of Channa roe protein concentrate (Narsing Rao et al. 2012a).
Data are means ± standard deviation of duplicate determination
Values with different letters within the same row are significantly different at P < 0.05 by Duncan’s multiple range test
TAA total amino acid, EAA essential amino acids, NEAA non essential amino acids
∮Essential amino acids for infant
†Hydrophobic amino acids
RPCs had essential amino acid/non-essential amino acid ratio in range of 1.00–1.06. From this result, essential amino acid/non-essential amino acid ratio of PRCs was lower than that (1.10) of egg white, but it was similar to the value reported Heu et al. (2006) for yellowfin tuna roe. Lysine is often considered a first limiting amino acid for cereal food. Therefore, it needs to be emphasized that the RPCs had a higher content of lysine (8.5 %) than egg white (8.2 %) (P < 0.05). The lysine content of RPCs was 8.5 % which was higher than that reported for Channa (6.94 %) and Lates (6.86 %) roe protein concentrate (Narsing Rao et al. 2012a).
YTR and RPCs had hydrophobic amino acids ranged from 45.0 to 46.6 %. Hydrophobicity plays an important positive role in determining emulsifying properties (Chalamaiah et al. 2013). FitzGerald and O’Cuinn (2006) reported that bitterness of protein hydrolysate is associated with the release of peptides containing hydrophobic amino acid residues. Thus, RPCs could possibly be a dietary protein supplement to poorly balanced dietary proteins exhibiting to low bitterness.
Mineral (K, S, Na, P, Fe, Mg, Zn, Ca, Fe, Mn, Cu, Pb, Cd, Cr and Ni) composition was determined to identify the nutritional properties as a food compounds. Mineral content of YTR and RPCs is presented in Table 4. K content was the most predominant mineral in YTR (456.0 mg/100 g of sample), followed by P, Na and Mg (437.0, 167.0 and 29.0 mg/100 g, respectively). Minor minerals were Ca and Zn (11.0 and 8.0 mg/100 g, respectively). Heu et al. (2006) reported that predominant mineral in YTR was P (371.5 mg/100 g) followed by K and Ca (325.4 and 61.9 mg/100 g, respectively). Na content of YTR (167.0 mg/100 g) was very lower than that (2473 and 2348 g/100 g, respectively) of dried salted roes of hake Merluccius merluccius and ling Molva molva reported Rodrigo et al. (1998). This high Na content is clearly due to the salting process used to obtain the commercial product. FDC had significantly higher K, Na and P content (1179.9, 376.2 and 257.7 mg/100 g of sample, respectively) compared with those of BDC and SDC (P < 0.05). Similar K, P and Na contents in defatted-tuna roes were found in salmon roe (Bekhit et al. 2009). P content has been generally associated with the phospholipid content and the presence of phosphoprotein (Mahmoud et al. 2008; Matsubara et al. 2003). The highest S content was found in egg white (1341.3 mg/100 g) as a positive control (P < 0.05). Bekhit et al. (2009) reported that salmon roe had S content of 1647–2443 mg/kg (wet basis). Catfish roe protein powder had S content of approximately 0.56 mg/kg (Sathivel et al. 2009). The result implied that tuna roe had a high content of sulfur-containing compounds, which could undergo decomposition during storage, causing off-odor. Fe (9.7–12.9 mg/100 g of sample), Cu (0.4–0.5 mg/100 g of sample), Mn (0.1–0.2 mg/100 g of sample) and Mg (59.1–70.6 mg/100 g of sample) were minor minerals in RPCs. Fe and Cu are classified as the essential trace elements required for physiological and metal metabolic processes of marine organisms (Thanonkaew et al. 2006). Metal ions (Fe, Cu, Mn and Mg) might serve as catalysts for lipid oxidation, and have been shown to exhibit pro-oxidant activity (Thanonkaew et al. 2006). However, Fe and P contents of all samples were lower than those of catla, carp and rohu roes (Balaswamy et al. 2009). The variation in the mineral composition of marine foods is closely related to seasonal and biological differences, area of catch, processing methods, food source and environmental conditions (salinity, temperature and contaminant) (Alasalvar et al. 2002). According to Korean Food Standards Codex, Pb and Cd do not exceed 0.5 and 0.1 mg/kg for fish roe. YTR and RPCs could serve as safety and mineral source.
–; not determined
Data are means ± standard deviation of three samples
Values with different letters within the same row are significantly different at P < 0.05 by Duncan’s multiple range test
RPCs were light yellow in color and the L, a, b values are listed in Table 5. FDC was the lightest with L* value of 59.2. L* value of BDC and SDC (55.7 and 55.4, respectively) were no significant (P > 0.05). a* value of FDC (6.5) was higher than that of BDC (5.2) and SDC (5.3). FDC had the highest b* value (18.6) than that (17.8 and 17.4, respectively) of BDC and SDC (P < 0.05). However, total color change (ΔE) value is not significantly difference among the RPCs. (P > 0.05). Whiteness values of FDC (54.7), BDC (52.0) and SDC (51.8) were observed with no significant (P > 0.05). Sathivel et al. (2009) reported that the catfish roe soluble protein powder was light and yellow in color (L* = 71.7; a* = 3.9; b* = 28.8).
Data are means ± standard deviation of triplicate determinations
Values with different letters within the same row are significantly different at P < 0.05 by Duncan’s multiple range test
SDS-PAGE patterns of FDC, BDC and SDC prepared from yellowfin tuna roe and their 2’nd byproduct (BPD and SPD, respectively) are shown in Fig. 2. Actinin band of FDC was observed around 120 K. The major bands of FDC observed at molecular weight around 97 K. FDC exhibited two clear protein bands in the range of 75–100 K. Protein bands at approximately 97 K could be vitellin like protein, which was found in skipjack, tongol, bonito roes (Intarasirisawat et al. 2011), chicken egg yolk (DeMan 1999) and salmon Oncorhynchus keta and sturgeon Acipenser transmontanus roes (Al-Holy and Rasco 2006). Protein bands in range of 50–37 K and 15 K were observed. They could be the actin, troponin-T and myosin light chain (MLC), respectively. Protein bands of egg white (EW) were observed that in range of 75–100 K, 37–50 K and around 15 K, respectively. More clearance actin band was observed on EW than that of FDC. Whereas, vitellin like protein band of FDC was more clear than that of EW. SDS-PAGE patterns observed for BDC and SDC were comparable. Above 250 K of protein band was clearly observed on BDC and SDC. However, actinin was not found both of them. Protein bands of 170, 95, and 55 K was reported in Channa and Lates roe protein concentrate (Narsing Rao et al. 2012a). Sathivel et al. (2009) observed the presence of four abundant proteins with molecular weights between 40 and 100 K in spray dried catfish roe protein powder. The major bands of dehydrated and defatted egg protein concentrates from mrigal observed occurred at molecular weight (MW) of 97 K (Chalamaiah et al. 2013). In case of BDC and SDC, band patterns in range of 15–25 K more reduced than those of FDC. Because association and aggregation of protein on low molecular protein was occurred due to cooking process which caused protein degradation and soluble protein like a sarcoplasmic protein was released from YTR. Released soluble protein was found on BPD and SPD. Their major protein band was 50 K. Low molecular soluble protein was observed in range of 25–50 K caused by degradation of high molecular protein.
Conclusion
Fish roe, a by-product in fishery industry, can be utilized as a low cost source of protein for value addition. Production of roe protein concentrate from yellowfin tuna roe is a simple and economical process. This study demonstrated that is feasible to produce concentrates from yellowfin tuna roe by cook-dried process. The roe protein concentrates were found to be rich in protein with essential amino acid. Fish roe protein concentrates may potentially serve as a good source of protein with desirable functional properties. Therefore, these protein concentrates could be used as protein supplements and functional ingredients in human diets.