Introduction
Ghana’s coastline is endowed with many lagoons that support the livelihood of adjacent local communities (Dankwa et al. 2004; Davies-Vollum et al. 2019). Cichlids, especially the tilapias, are among the most important fish resources endemic to the aquatic ecosystems of tropical Africa (Panfili et al. 2004). They are known to be continuous spawners with multiple reproduction rates (Legendre and Ecoutin 1989; Jiménez-Badillo 2006) and feed on a range of plankton organisms and detrital matter (Kone and Teugels 2003; Ofori-Danson and Kumi 2006). In Ghana, there are two upwelling seasons that drive marine fisheries. The major upwelling season is from July through September, and the minor upwelling season is from late December to early February. These are the high seasons for fishing (MoFAD 2015). During the off-season, the price of marine fish is high but there is reduced fishing activity due to scarcity of surface shoals (Bannerman and Quartey 2004). Tilapias constitute an important food source, providing protein and also play a very important role in the economy of coastal inhabitants, especially during the off season for marine fishing (Blay and Asabere-Ameyaw 1993). Due to their potential to adapt and thrive in varying environmental conditions, they have either invaded or have been introduced into several water bodies in various regions around the world (Lazard 1990). Sarotherodon melanotheron is a tilapia confined to brackish waters in lagoons and estuaries (Dankwa et al. 2016; Myers et al. 2018). The species, though not developed for aquaculture, is an important resource in the commercial and subsistence fisheries of many West African lagoons (Ekau and Blay 2000). It constitutes a high proportion (50–95%) of total catch in the lagoons along the coast of Ghana (Blay and Asabere-Ameyaw 1993; Koranteng et al. 2000; Panfili et al. 2004; Dankwa et al. 2016).
Information on age is fundamental in studying the impact of environmental factors on growth and survival, particularly of the juvenile stages of fish (Ekau and Blay 2000). Labropoulou and Papaconstantinou (2000) also posited that age information is valuable for studying population characteristics such as growth, recruitment, mortality and reproduction, and it is often required before more detailed studies on life-history strategies and ecology can be carried out. The use of otoliths in ageing fish is often reliable such that the information on age and growth is used to (1) determine the effect of fishing on the stocks and the effectiveness of management policies, (2) understand life history events and (3) maximise yield whilst still ensuring the sustainability of the resource (Campana and Jones 1992). Otoliths have been widely used for estimating fish age since the first description of daily micro-increments by Pannella (1971). Examining the otolith microstructure provides a dated record of past fish growth which has been used for age determination and as a source of information on growth rate and life history (Aguilera et al. 2009; Smylie et al. 2016). Validation of daily deposition of otolith is required before it can be used for the determination of age and growth. Many scientists have validated daily micro-increment of otolith of different fishes including horse mackerel (Waldron and Kerstan 2001), tilapias (Panfili and Tomas 2001) and tropical reef fish, Macentrus mollucensis (Fowler 1990).
Ekau and Blay (2000) found a one to one relationship between days of rearing and daily increment in the otoliths of S. melanotheron from Fosu and Benya lagoons and Kakum estuary of Ghana, thus verifying daily deposition. However, the use of otolith to accurately estimate and also make a comparison of the age and growth of this important resource in the lagoons of Ghana is very limited. According to Gauldie (1990), fishes in their natural environment are constrained by changing environmental conditions that influence the metabolic and growth rates. Fishes show differences in growth patterns which are caused by several intrinsic and extrinsic factors such as environmental temperature, food availability, metabolic activity and reproductive activity which can subsequently produce different budget of anabolism and catabolism reflected in the L∞ and K parameters (Isaac 1990).
Feeding experiments conducted on different fishes revealed that food intake and food deprivation have an influence on microstructure deposition. Increment width and periodicity appear to be sensitive indicators of feeding history in fish larvae and juveniles (McCormick and Molony 1992; Molony 1996; Massou et al. 2002). Preliminary investigations of these two lagoons revealed differences in their characteristics and the level of catch of the fishery resources. There is also generally limited information on age and growth of the species which often are very important for effective management of the resources. This study, therefore, sought to use fish size and otolith size as proxies to determine the age and growth of Sarotherodon melanotheron from the two lagoons and to assess the range of food items available to the species in both lagoons.
Materials and methods
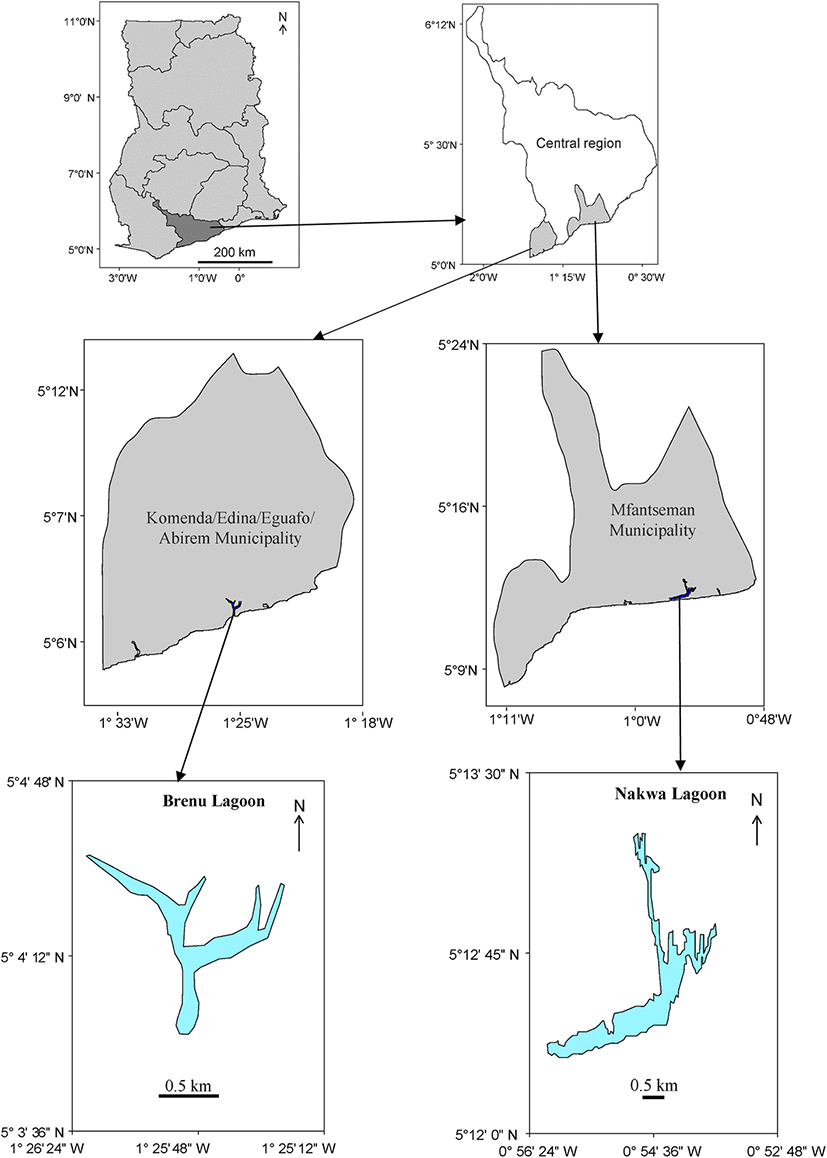
The study was carried out on the Nakwa and Brenu Lagoons in Ghana (Fig. 1). The Nakwa lagoon lies adjacent to the Ekumfi Nakwa fishing community. It is located on 5° 13′ 00″ N, 0° 54′ 00″ W. The lagoon is relatively shallow with a surface area of 3.6 km2. It opens into the sea during a greater part of the year and therefore experiences both tidal influence from the sea and fresh water discharge from the Ochie River. The mouth is frequently dredged to allow for passage of outboard motor-powered canoes. On the periphery of this lagoon are mangroves, shrubs and large tracts of marshland mostly covered with Paspalum vaginatum. Beside fishing in the adjacent sea, residents of Nakwa and Ekumpuano derive much of their livelihood from this lagoon.
Brenu lagoon, on the other hand, is located on 5° 4′ 60″ N, 1° 25′ 0″ W near Brenu Akyenim. The lagoon covers an area of 0.82 km2. The Brenu lagoon is closed and cut off from the adjacent sea by a sand bar for the greater part of the year and contact with the sea is re-established during the rainy season, either naturally or artificially, to prevent flooding of nearby villages and farms. Dilution is mainly from rainfall and small creeks that feed into it. Therefore, the lagoon experiences hypersaline conditions in the dry season due to increased evaporation (Yankson 1982). It is bordered by large strands of mangroves, mostly Avicennia sp. and small patches of marsh. Fishing in the lagoon is seasonal. Residents of the nearby communities of Brenu Akyenim and Ampenyi-Ayensudo exploit resources from this lagoon for their livelihood, mostly in the dry season, when farm activities are minimal.
Fish samples from the two lagoons were obtained from fishermen using cast, drag and gill nets between September 10 and October 26, 2010. The samples were kept chilled in sealed poly bags to reduce digestion of stomach contents to the minimum and transported to the laboratory. In the laboratory, standard length (SL) was measured from the tip of the snout to the caudal peduncle. The lengths were taken with measuring board to the nearest 0.1 cm. Body weights of individual fishes were measured to the nearest 0.01 g with an electronic balance after wiping the water and other particles from the body surface. A total of 382 fish samples from both lagoons were measured, comprising 209 from Nakwa lagoon and 176 from Brenu lagoon.
After length and weight measurements, fishes were then gutted for examination of stomach contents. The extracted stomachs were stored in 10% formalin to preserve the food items. At the laboratory of the University of Cape Coast, Ghana, the samples were removed from the formalin solution, split open on a petri dish and contents examined using a binocular microscope (× 400 magnification). With the help of identification manuals, organisms in the stomach were identified and grouped into broad categories of food items. From each of the lagoons, forty-two (42) stomachs were analysed.
Pairs of sagittal otoliths of the fish were extracted using instruments from dissection kits. This involved completely removing the heads of the specimen and then dividing it horizontally to separate the head into upper and lower sections. Otoliths were extracted with forceps after carefully teasing off the flesh, cleaned in 70% alcohol, dried and stored in capped vials for preparation and examination. One hundred and thirty-eight pairs were sorted for examination and 110 samples were used for analysis.
Simon et al. (2010) found no difference in shape and size between left and right otoliths and therefore samples of right-sided otoliths of the 138 pairs were sorted under the dissecting microscope and used for the ageing and growth assessment. At the Biolab of the Center for Tropical Marine Research, Bremen, the otolith samples were weighed to the nearest 0.1 mg with an electronic balance and the length on the longest axis measured to the nearest 0.001 mm using a dissecting microscope at × 250. Measured otoliths were embedded in epoxy resin block and sectioned with a linear precision saw (Buehler Isomet 4000). Sectioned otoliths were mounted on microscope slides with a transparent glue, ground on wet waterproof silicon carbide abrasive paper (FEPA P # 1000, 1200, 2400 and 4000 grits) with intermittent monitoring under the light microscope until the nucleus was reached, polished with Buehler Cerium oxide polishing compound and etched with 2% ethylenediamine tetra acetate (EDTA) for 5 min and then rinsed with distilled water. This process enhanced the visibility of growth rings making them more readable under the microscope.
The otoliths were analysed under the microscope and photographed with a digital microscope camera (ZEISS AxioCamICc 3) and AxioVision 4.8.2 software. Daily increment counts were carried out on the photographed images using the Image-Pro Plus analysis software (version 5). Daily growth increment consisted of light and dark zones visible as the area from the beginning of a dark band to the beginning of the next dark band (Geffen 1982) and these increment counts were used to estimate the age of the fishes. Growth increments were counted from the nucleus to the edge of the otolith. Otolith readings were carried out thrice, without reference to the length and weight of the fishes, to minimise errors and also eliminate biases that might be introduced during reading.
The length-weight relationship (LWR) of the fish species was analysed using the equation:
where W = weight (g), L = standard length (cm), a = constant and b = growth exponent. The LWR analysis were conducted in the R statistical computing environment using the package ‘FSA’-Fisheries Stock Assessment (Ogle 2016).The condition factor, to estimate the wellbeing of the fishes, was calculated with the equation:
where K′ = condition factor, W = body weight, L = standard length and b = length exponent (slope). For each population, the exponent b of the length-weight regression was checked to determine whether the value was significantly different from 3 or the population exhibited isometric growth (i.e. the exponent b value is statistically not different from 3). For this purpose, the Student’s t test was conducted as expressed by the equation: ts = (b−3)/SE (Sokal and Rohlf 1987), where ts is the t test value, b the exponent and SE the standard error of the exponent b. The formula is implemented in the R package FSA with the function called ‘hoCoef()’.
The von Bertalanffy growth model of the form:
where Lt is the length of the fish at time t, L∞ is the asymptotic length of fish in cm, K is the growth coefficient and to being the age at length zero, was used to analyse the relations between length and age of the fish samples from the two lagoons. The model was also fitted in R using ‘FSA’ package. The estimated L∞ and K values were used to calculate the growth performance index (Ø′) = logK + 2 × logL∞ (Pauly and Munro 1984), to compare the growth performance of the black-chinned tilapia between the two lagoons. An error level of 0.05 was used for all statistical tests. The percentage occurrence method was used to analyse the stomach content of the fish specimen. All statistical analyses were performed in the R environment for statistical computing (R CT 2019).
Results
The standard lengths of the fish samples were in a range of 3.0–8.6 cm and 4.2–9.9 cm for Nakwa and Brenu lagoons, respectively (Additional file 1: Figure S1). The most abundant size class from Nakwa lagoon is 3.6–4.0 cm but size classes of 4.1–4.5, 4.6–5.0, 5.1–5.5 and 5.6–6.0 cm constituted some substantial proportions of the catch. Percentage frequency of the fish samples decreased with increasing size classes from 3.5 to 4.0 cm (Additional file 1: Figure S1). Fish samples with sizes between 5.1 and 9.0 cm were observed to constitute quite a substantial proportion of the fish caught in the Brenu lagoon. The results also show that fish from Brenu lagoon (mean ± SD = 6.86 ± 1.16 cm) were generally bigger compared with the population from Nakwa lagoon (mean ± SD = 4.62 ± 0.95 cm).
The length-weight relationship for fish samples from the two lagoons (Fig. 2) showed very high coefficients of determination, with r2 = 0.971 for Nakwa and 0.968 for Brenu lagoons (Table 1). The exponent b of the length-weight relationship, which give an indication of the increase in fish size in relation to body weight, was 3.0022 for Nakwa and 2.8399 for Brenu. Fish are said to exhibit isometric growth when length increases in equal proportions with body weight for constant specific gravity. The value of exponent b for isometric growth is 3 and values greater or lesser than 3 indicate allometric growth (Gayanillo et al. 2005). A Student’s t test showed that the exponent b values of the length-weight relationships for the fish samples from the two lagoons were different. The estimated b value of 3.0022 (confidence interval 2.94, 3.07) for Nakwa lagoon was not statistically different from 3 (p = 0.9512), therefore suggested that the population in Nakwa exhibit isometric growth. In contrast, the exponent b value of 2.8399 (confidence interval 2.76, 2.92) of the length-weight relationship for the fish samples from Brenu lagoon was statistically different from 3 (p < 0.0001), and thus indicated allometric growth for the population in this lagoon.
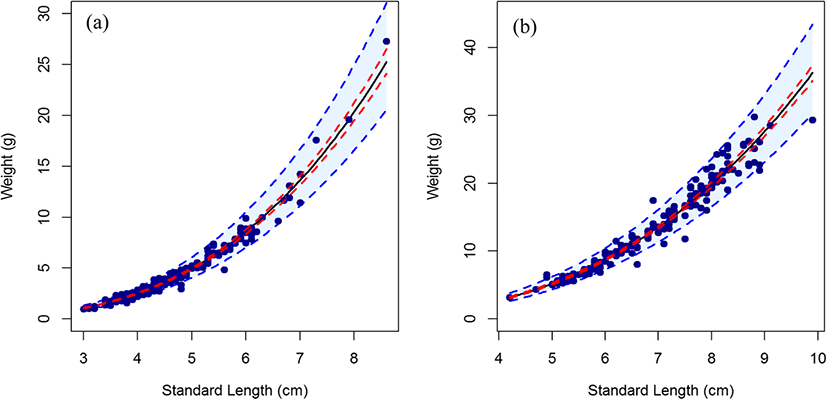
FW, fish weight; SL, standard length; OL, otolith length; OW, otolith length; CI, confidence interval
The condition factor of fish samples from Brenu lagoon (5.40 ± 0.48) was significantly higher than the value found for samples from Nakwa lagoon (3.96 ± 0.39) (Student’s t test of the samples gave p < 0.05; Table 2). The condition factor for fish samples from Nakwa lagoon, however, showed very minimal changes across the size bins. The mean values ranged between 3.85 ± 0.31 at a length of 6.5 cm and 4.27 ± 0.00 at the size of 8.5 cm.
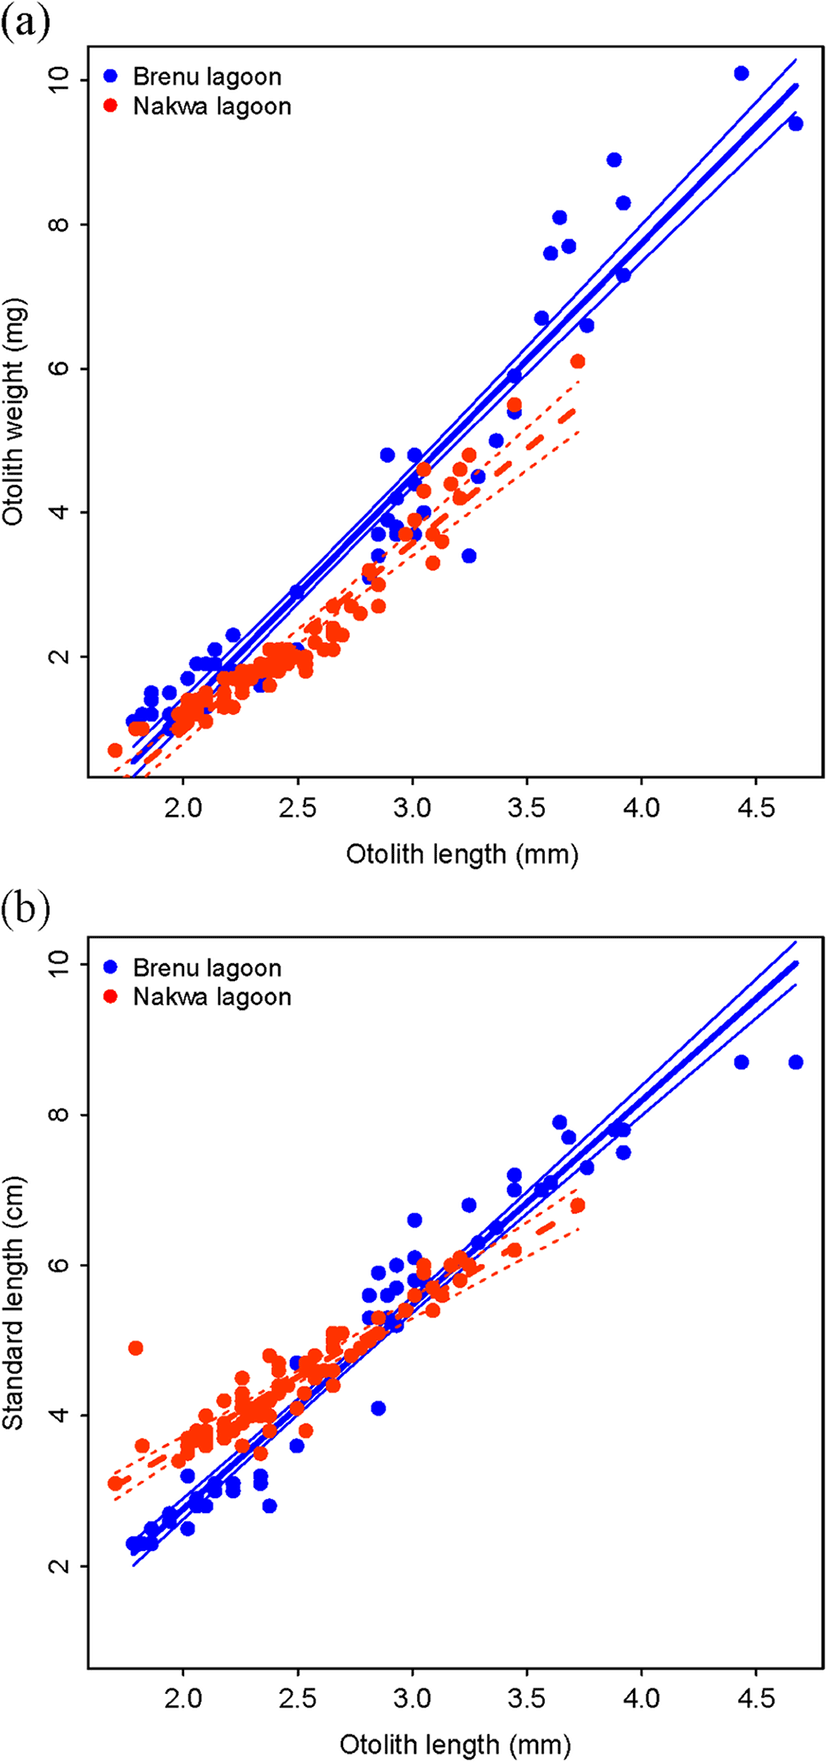
Otoliths of fish samples from the two lagoons, used for the analysis, ranged in size from 1.70–3.72 mm (n = 82) for Nakwa lagoon to 2.49–4.67 mm (n = 28) for Brenu lagoon. A high correlation was found between otolith size and otolith weight and also between otolith size and fish size (Fig. 3). Allometric coefficients of the otolith size-otolith weight relationships were found to be 2.4696 and 2.7242, for Brenu and Nakwa, respectively. For otolith size-fish size relationships, the allometric coefficients were 1.6598 and 0.9815 for Brenu and Nakwa, respectively. The results of ANOVA suggest that the Sarotherodon melanotheron populations in Brenu and Nakwa have significantly different slopes (F = 15.6, p = 0.0001264) and (F = 50.9, p < 0.0000005), for the otolith size-otolith weight relationship and otolith size-fish length relationship, respectively. See Additional file 1: Tables S1 and S2 for the ANOVA results and Additional file 1: Figure S1 for the length frequency histogram.
Out of the 110 samples of otoliths prepared for age estimation, 40 (Nakwa = 29; Brenu = 11) were selected for analysis. The rest were rejected due to preparation errors, inability to visualise and count the rings and also inconsistency in all the otolith readings. Otoliths accepted showed clear zones with each zone consisting of opaque and translucent bands. The population from Brenu had a higher growth performance index (Ø′ = 2.77) than those from Nakwa (Ø′ = 2.60). Other details of the estimated growth parameters are presented in Table 3 and Additional file 1: Figure S2.
Lagoon | Parameters | Estimates | Standard errors | ||
|---|---|---|---|---|---|
Nakwa Lagoon | L∞ | 12.04 cm | 10.07 | ||
K | 2.76 year−1 | 4.62 | |||
to | −0.02 year | - | |||
Brenu Lagoon | L∞ | 13.44 cm | 25.91 | ||
K | 3.27 year−1 | 15.89 | |||
to | 0.02 year | - |
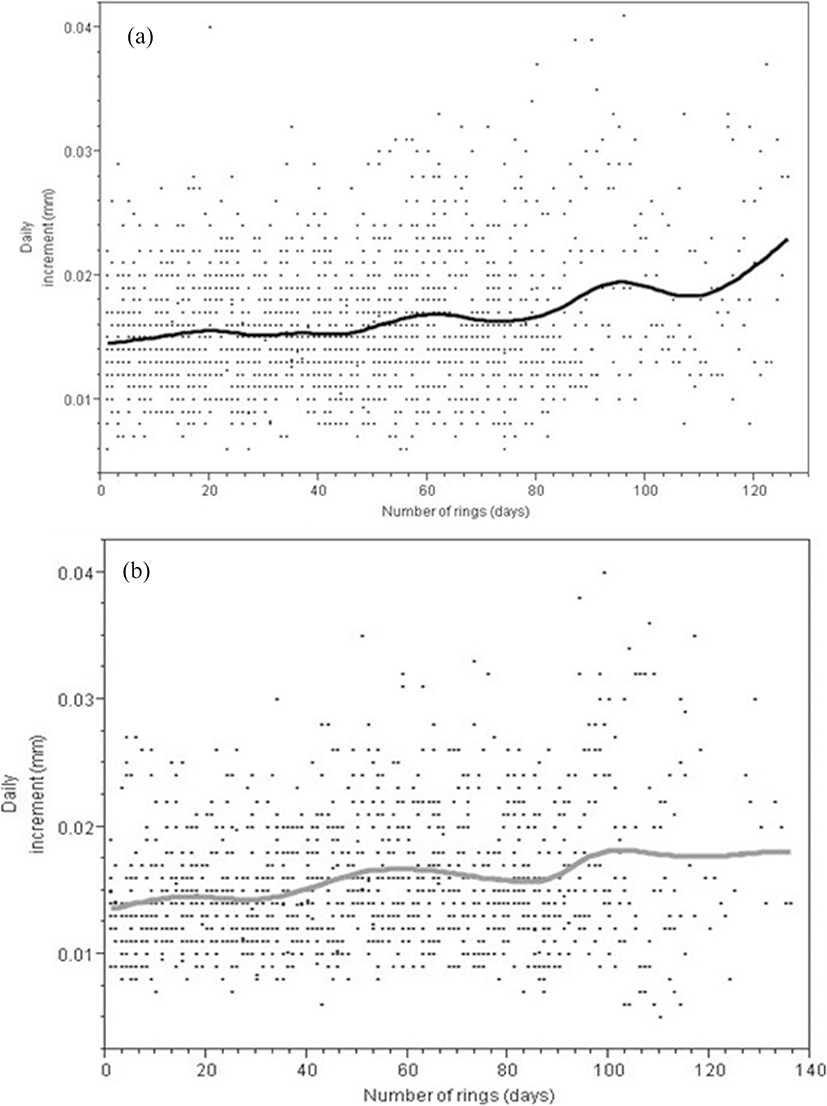
The daily increment rates of S. melanotheron ranged between 0.01 and 0.03 mm day−1 in Nakwa lagoon and 0.01 to 0.02 mm day−1 in Brenu lagoon (Fig. 4). In both lagoons, there was an initial increase in the daily increment rings over the first 20 days. In the Nakwa lagoon, increment remained constant over the next 50 days and then increased over the 60th day. An unstable pattern characterised the increment over the rest of the days with the highest increment occurring over the 120th day. In Brenu lagoon, however, there was a rise over the 60th day and a fall on the 90th day. Increment rose to the maximum near the 100th day and became relatively stable to the last day.
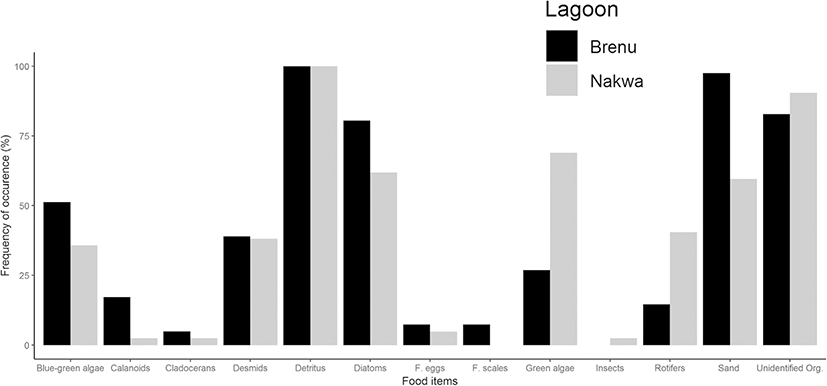
A total of 83 stomachs were examined for categorisation of food items. This comprised 42 and 41 stomachs of fish samples from Nakwa and Brenu lagoons respectively. Green algae were the commonest phytoplankton food items that occurred in the stomachs of fish samples from Nakwa lagoon (69.0 %), compared with Brenu lagoon (26.8%). Spirogyra sp., Geminella sp. and Mougeotia sp. were mostly encountered in the fish samples from Nakwa whilst few species of Euglena, Microspora, Chrysoccocus and Treubaria were also seen (Fig. 5 and Additional file 1: Table S3). Elakatrothrix and Oocystis spp. were seen in samples from Brenu lagoon in addition to Microspora, Spirogyra and Euglena spp. (Fig. 5). Phytoplankton food items that were most common in the stomachs of fish samples from Brenu lagoon were the diatoms (80.5%). The diatoms mostly present were the Navicula spp. and few species of Gyrosigma, Flagilaria, Coscinodiscus and Merismopedia. Species of Diatoma, Striatella, Tabellaria, Rhizosolena and Surirella in addition to Flagillaria, Gyrosigma and Navicula formed 61.9% of phytoplankton food that occurred in stomachs of fish samples from Nakwa lagoon. About 51.2% and 35.7% of the blue-green algae occurred in the stomachs of fish samples from Brenu and Nakwa lagoons respectively. Species of Lyngbya and Anabaena were mostly encountered with species of Spirulina, Gloeotrichia, Nodularia, Oscillatoria and Gomphospheria constituting little to proportions of food in stomachs of fish samples from Brenu. Gloeotrichia, Spirulina, Oscillatoria, Lyngbya together with Aphanizomenon spp. were seen in the stomachs of fish samples from Nakwa lagoon. About the same amount of desmids were eaten by fishes from both lagoons. There were also Closterium and Pleurotaenium spp. in the stomachs of fish samples from Nakwa lagoon whilst Closterium, Pleurotaenium, Desmidium and Microsterias were found in the fish samples from Brenu lagoon. Detrital matter was always present in food ingested by fishes from the two lagoons whilst sand particles represented 59.5% and 97.6% of food items ingested by fish samples from Nakwa and Brenu respectively. Animal food organisms such as rotifers made up more than 40% of food in stomachs of fish from Nakwa but only about 15% food in stomachs of fish from Brenu lagoons. Sand particles and unidentified organisms constituted 59.5% and 90.5% respectively in stomachs of fish from Nakwa lagoon compared with 97.6% of sand particles and 82.9% of unidentified organisms ingested by fish from Brenu lagoon.
Discussion
Fish samples collected from these lagoons showed differences in their sizes. Fish samples from Brenu lagoon were of significantly bigger sizes (mean ± SD) with a maximum length of 12.8 cm compared with fishes from Nakwa lagoon (mean ± SD) with a maximum length of 11.5 cm. In Nakwa lagoon, unimodal size class of fish samples was observed. In Brenu lagoon, however, three different size classes were evident in the fish samples (Additional file 1: Figure S1). The estimated b values derived from the allometric length-weight relationship for the Brenu lagoon showed that the weights of fish samples from the lagoon are lighter for their lengths. The b value of the model for the Brenu lagoon was significantly different from 3 (p < 0.05). A proportional relationship between length and weight of fish samples from Nakwa lagoon was observed, implying that fishes in this lagoon exhibited an isometric growth pattern. This is in agreement with the findings on S. melanotheron from Ologo Lagoon, Lagos (Ndimele et al. 2010) and Eleiyele Lake in Southwestern Nigeria (Ayoade and Ikulala 2007). Other studies found isometric and allometric growth in different cichlids in the same waterbody (Abowei et al. 2009; Dankwa et al. 2016) and among different fishes from the same environment (Kumolu-Johnson and Ndimele 2010).
Although fish samples from Brenu lagoon show negative allometric growth, their condition factors are significantly higher (5.398 ± 0.479) than fish samples from Nakwa lagoon (3.955 ± 0.389) (p < 0.05). Abowei et al. (2009) stated that the condition factor of a fish reflects, through its variations, information on the physiological state of the fish in relation to its welfare. Saliu (2001) also reported that condition factor might be influenced by both biotic and abiotic factors such as feeding regimes and state of gonadal development. No much variation was observed in the condition factor across sizes of fish samples in Nakwa lagoon but the condition factor was high in small-sized fish and low in the large-sized fishes. The results of this preliminary study show that the condition factor of the fish samples varied between the lagoons. The mean condition factors for S. melanotheron from both lagoons are greater than 1 and this shows that the fish samples are above average condition in their environment (Wade 1992; Abobi 2015). The difference in growth may be due to the relatively low aeration and high salinity levels in the Brenu lagoon. The lagoon bottom is very muddy due to deposition of fine allochthonous material which expectedly increases the biological oxygen demand and thus, the reduced dissolved oxygen concentration. Also, there is very little or no mixing of the water as the sand bar cuts off the seawater from entering the lagoon which may be the cause of the decreased oxygen and relatively higher salinity levels. The lagoon itself is being used by the locals for salt production. Low fishing activities in addition to strict adherence to off fishing days in the lagoon could also contribute significantly to the observed results. Nakwa lagoon, on the other hand, has vibrant fishing activities. The mouth of the lagoon is the landing site for the marine fishermen and the exposure to the sea coupled with riverine influence are factors that could explain the high oxygen levels in Nakwa.
Otolith length and otolith weight were highly correlated with the coefficient of determination (r2) of 0.9507 and 0.9498 for Nakwa and Brenu, respectively. The relationship between otolith size and fish size (standard length) from both lagoons was also highly correlated but with very small allometric growth coefficients (1.6598 for the fish samples from Brenu lagoon and 0.9815 for the samples from Nakwa).
Fish species of the family Cichlidae are important resources in the aquatic ecosystems of tropical Africa (Fryer and Iles 1972; Panfili et al. 2004). The estimated parameters of the LWR, the otolith length-otolith weight relationship and the otolith length-fish standard length relationship can be used to approximate the fish weight and otolith weight provided data on the fish length and otolith length are available. The estimated parameters are useful as baseline information can support data collection and analysis of S. melanotheron populations in other tropical lagoons.
Results of otolith age determination showed that for S. melanotheron from both lagoons with a size range between 3.9–7.9 cm and 7.0–10.2 cm, estimated ages of 56–166 days and 85–150 days were seen for Nakwa and Brenu lagoons respectively. The mean ages of fish samples were significantly different between the two lagoons (p < 0.05). Fish samples from Brenu lagoon showed a higher condition factor; K′ ± SE value of 3.27 ± 15.8932 compared with the value of 2.76 ± 4.6202 for samples from Nakwa lagoon (Table 2). The difference observed in the condition factors may be due to variation in environmental conditions in the lagoons. Panfili et al. (2004) observed a reduction in growth rate with the corresponding reduction in size at maturity of S. melanotheron with increasing salinity. They concluded that the observation in the reduction in size at maturity may be due to the reduction of growth and early maturity. Dankwa et al. (2016) also observed stunted growth of fish from the Fosu lagoon with length at first sexual maturity of 6 cm for both males and females. This study, however, found that the growth rate in Brenu lagoon, with high salinity, is higher with increased size at maturity and comparatively low growth rate in Nakwa lagoon with reduced size at maturity. They thus tend to approach length at infinity faster than fish samples from Nakwa lagoon. The high asymptotic length calculated from fish samples from Brenu lagoon may be as a result of the large fish sizes in the samples (13.44 ± 25.9103). Asymptotic lengths of S. melanotheron from this study fall in range of asymptotic lengths computed for this species in other lagoons: 11.5 cm (Densu delta), 12.5 cm (Muni lagoon), 12.5 cm (Sakumo Lagoon), 12.4 cm (Songhor Lagoon), and 17.5 cm (Keta Lagoon), 14 cm (Fosu Lagoon) along the coast of Ghana (Entsua-Mensah et al. 2000; Dankwa et al. 2016). The comparatively low growth rate and asymptotic length of fish samples from Nakwa lagoon could be due to the high variability in salinity which may impact their physiology and also the high level of fishing activities which continually take out bigger sizes of fish from the stock.
The daily increment of otolith rings per day of the species in both lagoons did not show a pronounced difference (Fig. 4). This could be due to the fact that temperature which is the main factor impacting metabolic activities in fishes did not show much difference between the lagoons since the lagoons experienced similar illumination.
The results of the von Bertalanffy growth parameters are preliminary and such as the estimated values should be applied with cautious. As a consequence, a comprehensive survey is needed in both lagoons to derive robust estimates of species growth parameters, exploitation rates and management reference points.
The range of food present, how well fishes make use of food in their environment in addition to the existing physicochemical conditions affects their growth and well-being. Food present in the stomach of fish samples from Nakwa lagoon was less varied than that in fishes of Brenu lagoon. Results of the food habit of the S. melanotheron agreed with other findings that showed that the species are planktivorous (Ofori-Danson and Kumi 2006; Ayoade and Ikulala 2007; Ndimele et al. 2010). Also present in the stomachs of fish samples from both lagoons are high proportions of detritus and sand particles. This suggests that the fish samples from both lagoons, especially those at Brenu, feed mostly on the substratum.
Conclusions
Nakwa and Brenu lagoons are very important lagoons along the coast of Ghana that support artisanal fisheries of the most abundant fish species, S. melanotheron. The estimated b values derived from the length-weight relationship of the species indicated that the S. melanotheron population from Nakwa lagoon grew isometrically and the samples from Brenu lagoon grew allometrically but had higher condition factor compared with the species population from Nakwa lagoon. The species are fast-growing as indicated by the rate at which the species approach the asymptotic length. Food habits of the species showed that they are omnivorous and are predominantly bottom feeders.
Though the study was conducted within a short period of time, it provides the basis for further work on this important species in the lagoons and for better management of the resources. It is recommended that further studies be carried out during the two major seasons in the country to obtain knowledge of seasonal differences in the growth and conditions of the species in the lagoons. Otolith analysis proved to be successful in ageing the fishes but with much difficulty for the adults, in terms of preparation of samples. Further work should focus on juvenile otoliths since they are most sensitive to the conditions in their environment.


