Introduction
The giant freshwater prawn, Macrobrachium rosenbergii is one of the most cultivable crustaceans and the largest Macrobrachium species with commercial significance. This species is naturally distributed in South and Southeast Asia, parts of Oceania, and some Pacific islands, and has been introduced in more than 40 countries (Bala et al., 2017). Bangladesh is well-suited for giant freshwater prawn farming due to its favorable agroclimatic conditions and extensive productive inland and brackish water bodies (Ahmed et al., 2008; Wahab et al., 2012). Commercial prawn farming began in Bangladesh in the early 1990s. A high demand for M. rosenbergii in local and international markets presents a significant opportunity to enhance its farming in Bangladesh (Ahmed et al., 2008; Alam & Alam, 2014). Farming M. rosenbergii represents a crucial segment of the aquaculture sector and is a vital source of income for Bangladesh. Captive breeding and the production of postlarvae (PL) play significant roles in the commercial aquaculture of M. rosenbergii in many countries, including China, India, Thailand, Vietnam, and Bangladesh.
Challenges such as slow growth rates, size variations at harvest, diseases, and deterioration of culture environments hinder the growth of the M. rosenbergii farming sector (Chareontawee et al., 2007). In addition to several other factors, poor genetic diversity is believed to be a primary cause of PL’s low productivity. A broodstock with a greater genetic diversity is essential for a sustainable breeding program and efficient management strategy. The genetic diversity of a population promotes the expression of diverse physical traits in individuals, enabling them to adapt to stress, disease, and unfavorable environmental conditions, thereby ensuring long-term survival. Inbreeding has led to genetic deterioration in most hatchery populations, potentially negatively impacting the culture period, growth, economic returns, and natural ecosystems (Nguyen Thanh et al., 2015). Genetic degradation impedes the sustainable development of this species. Genetic diversity is crucial for stock improvement, enabling the prioritization of populations for selection based on genetic criteria (Petit et al., 1998). Genetic diversity is recognized to facilitate better breeding plans by selecting genetically diverse broodstocks and ensuring the maintenance of genetic variation (Charoentawee et al., 2006). The evolutionary potential and fitness of a population are positively correlated with genetic diversity (Vandewoestijne et al., 2008). Therefore, understanding genetic diversity is essential for developing effective conservation strategies. The assessment of genetic variation, determination of inbreeding, and identification of species have entered a new era with the application of genetic markers. Numerous applications of genetic markers include differentiating natural populations for better fishery management, analyzing population genetic structures, conserving, identifying selected lines, identifying quantitative trait loci in aquaculture, and identifying taxa, food products, and forensic samples (Layton et al., 2020; Wenne et al., 2007).
Through molecular techniques, pure stocks with greater genetic diversity can be identified and preserved to produce high-quality broodstock. Microsatellite DNA markers are frequently used to characterize the genetic makeup of both wild and cultured populations for management and breeding purposes. For example, a breeding program can use microsatellite DNA markers to build pedigrees and estimate heritability (Vandeputte et al., 2004). Microsatellites are highly polymorphic, neutral, and codominant DNA markers based on the variable number of short, usually 2–4 bp nucleotide repeats (Yu et al., 2019), that can resolve low genetic differentiation effectively, and play a pivotal role in describing the genetic structure, conserving genetic resources, and enhancing aquaculture by identifying potential sources for broodstock development. Specific microsatellite primers for M. rosenbergii have been developed in Australia (Chand et al., 2005), India (Bhat et al., 2009; Divu et al., 2008), Malaysia (Bhassu et al., 2008), and in Thailand (Charoentawee et al., 2006). Different genetic parameters of M. rosenbergii have been studied in North America (Schneider et al., 2013), China (Nguyen Thanh et al., 2015; Yu et al., 2019), and Thailand (Chareontawee et al., 2007).
In Bangladesh, the genetic diversity of the wild population of M. rosenbergii was also studied a decade ago (Khan et al., 2014), and a declining trend in the effective population size was reported. In 2014, only 349 MT (metric ton) of M. rosenbergii were caught from the major rivers of Bangladesh, which has increased to 4,084 MT in 2024 (DOF, 2024) due to increased fishing pressure, which may reduce the genetic diversity of M. rosenbergii in the wild population. However, the present status of the genetic parameters of the Bangladeshi wild population of M. rosenbergii is not well known. The Kocha River in the district of Pirojpur is one of the natural sources of berried (egg-bearing) and PL of prawn (Khan et al., 2014; Shofiquzzoha et al., 2016) in Bangladesh. The study of genetic diversity and population structure of this river would provide a better understanding of the genetic structure of the prawn used in the hatchery to produce post-larvae and cultured in the farms. Moreover, the genetic parameters of the hatchery-produced population of M. rosenbergii in Bangladesh have yet to be explored. Therefore, the present study aimed to examine the genetic diversity of two farmed (hatchery-produced) populations and two wild populations of M. rosenbergii using nine microsatellite markers. Understanding a population’s genetic structure is vital for developing effective conservation strategies, for monitoring population and identifying vulnerable groups.
Materials and Methods
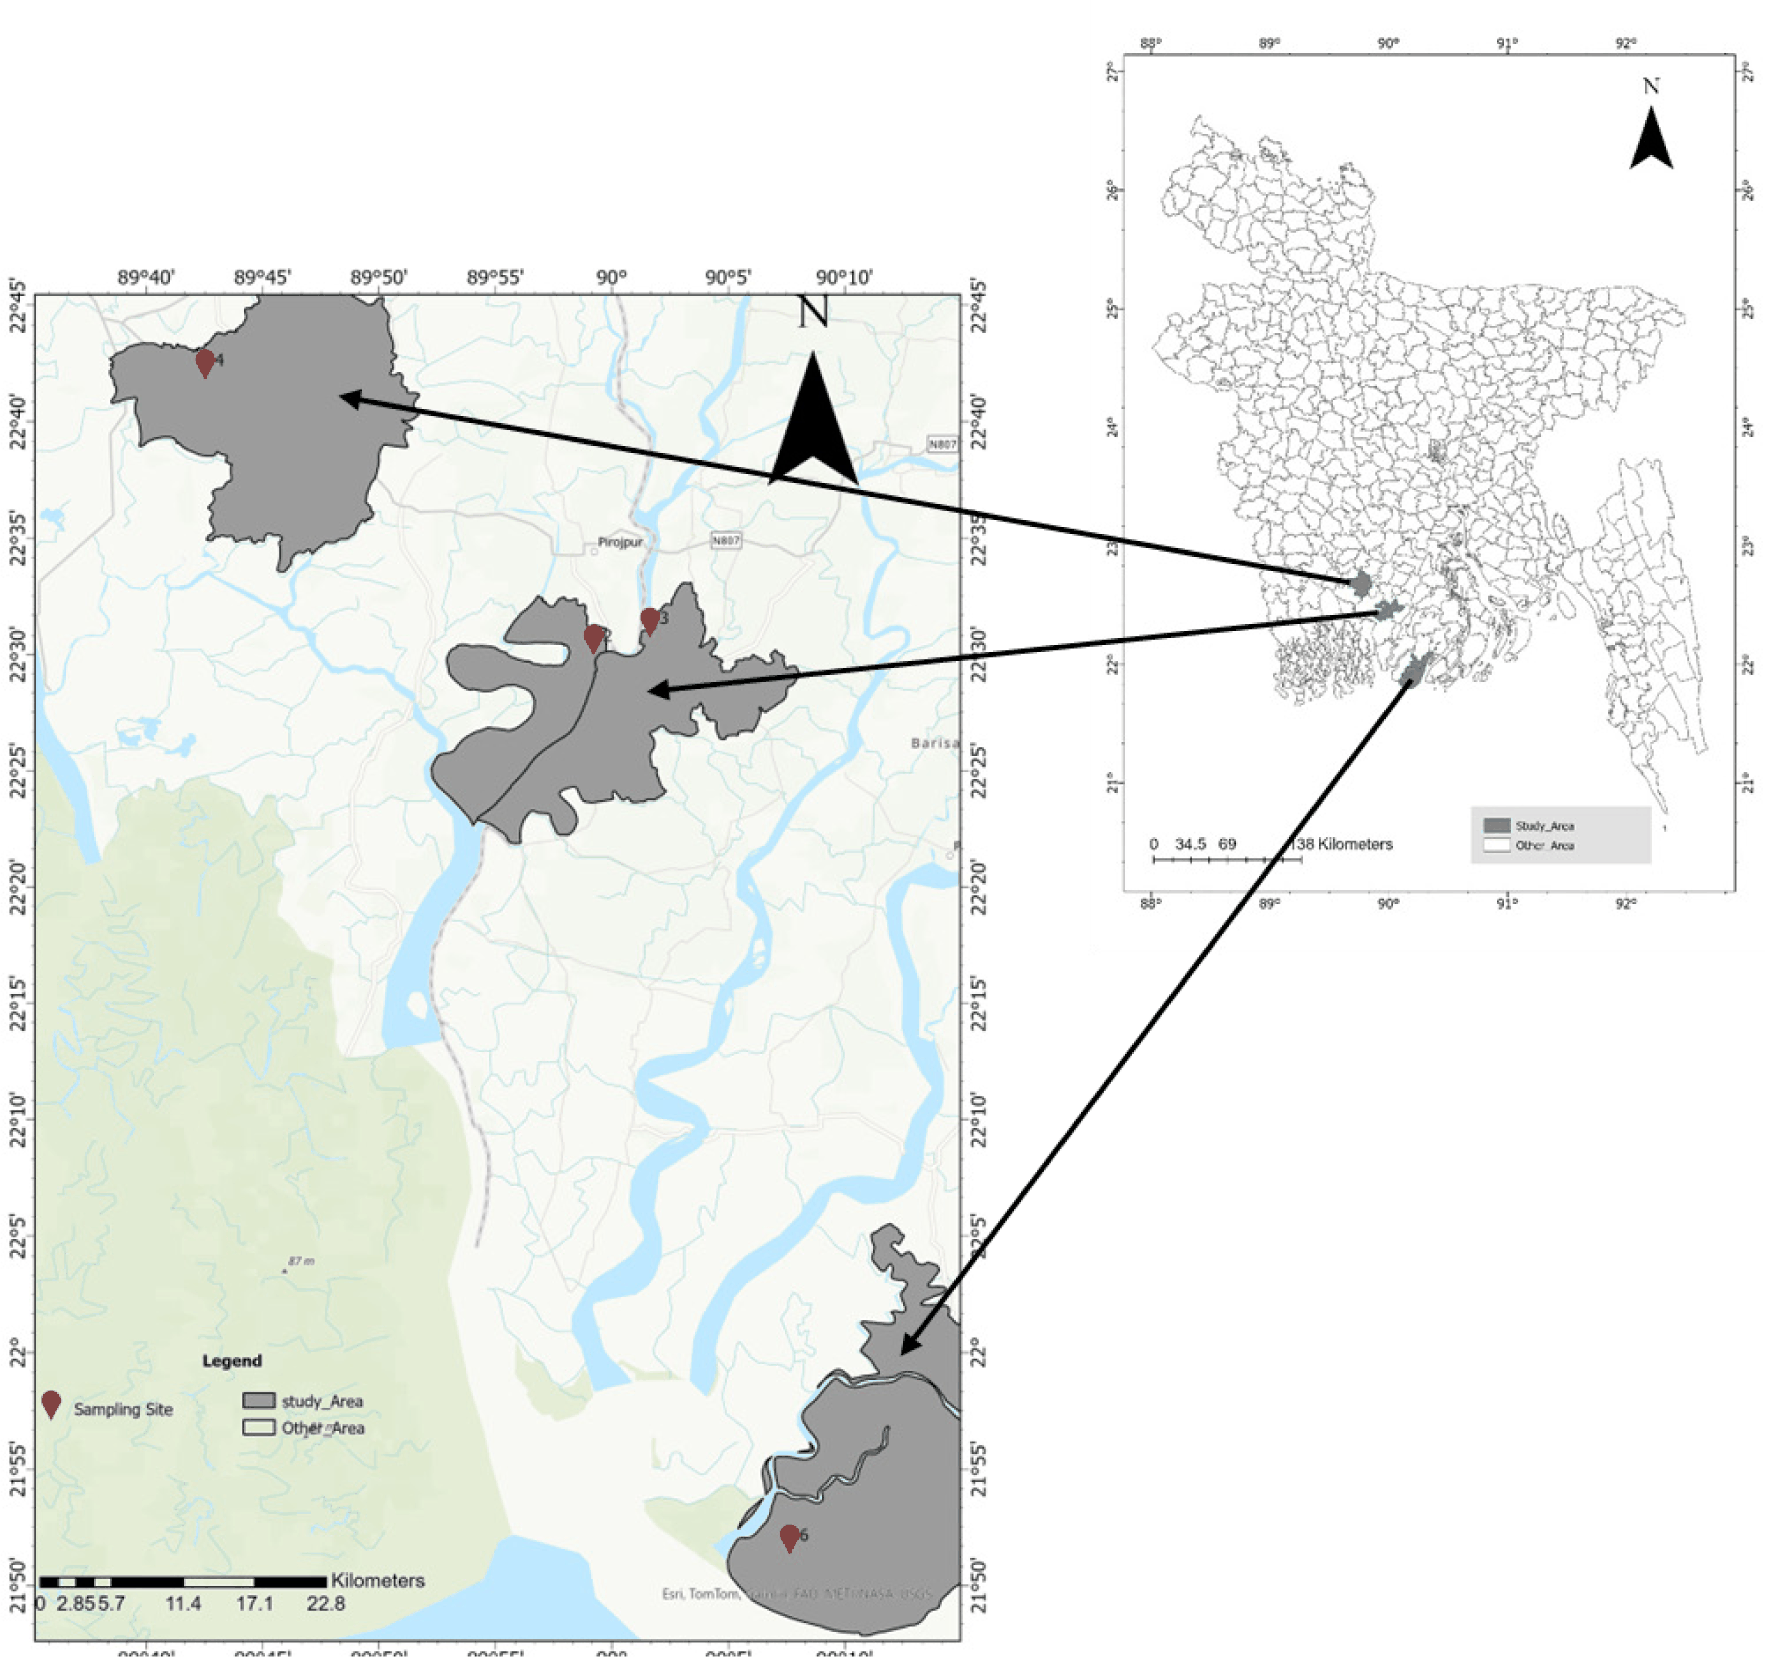
A total of 80 samples (20 from each of the populations) were collected from one wild and two hatchery sources. The samples of the wild population were collected from two different locations (Indurkani point and Zianagar point, as labelled 2 and 3 respectively in Fig. 1) of the Kocha River in Pirojpur district in two consecutive years, 2022 and 2023, while the hatchery-produced samples were collected from the CP hatchery (C.P. Bangladesh Bagerhat, Bangladesh) in Bagerhat district (as labelled 4 in Fig. 1) and the Fish-Tech hatchery (Fishtech BD Limited, Patuakhali, Bangladesh) in Patuakhali district (as labelled 6 in Fig. 1). Between the two hatcheries, the CP prawn hatchery imported the berried (egg-bearing mother prawn) from Thailand, and the Fish-Tech prawn hatchery used their pond-developed berried for PL production. We collected the PLs from hatchery sources and reared them separately until the juvenile stage. Pleopods were collected from 20 individuals in each population, preserved in 95% ethanol, and transported to the Fish Genetics and Biotechnology Laboratory at Bangladesh Agricultural University, where they were stored at –20°C.
Approximately 30 mg of pleopod was used for genomic DNA extraction using phenol-chloroform-isoamyl alcohol (PCI) and the ethanol precipitation method (Ayub et al., 2008). The quantity of DNA was measured by a spectrophotometer (Genova Nano spectrophotometer, Staffordshire, UK).
Nine pairs of primers for M. rosenbergii (Mbr-l, Mbr-2, Mbr-3, Mbr-5, Mbr-7, Mbr-8, Mbr-9, Mbr-10, and Mbr-11 developed by Charoentawee et al. (2006) were used in this study. Polymerase chain reactions (PCRs) were performed in 20 μl containing 10 μl of PCR Master Mix, 2 μl of DNA sample, 1 μl of forward primer, 1 μl of reverse primer, and autoclaved double-distilled water to a final volume of 6 μl. PCR was performed by a gradient thermocycler (Eppendorf Mastercycler® nexus X2, Hamburg, Germany) with the following cycling conditions: initial denaturation at 95°C for 3 min; 35 cycles of denaturation at 95°C for 30 s, annealing at 56°C for 30s, and extension at 72°C for 1 min; followed by a final extension at 72°C for 7 min. The PCR products were electrophoresed on a 6% polyacrylamide gel, using a 100 bp ladder and a Mini Gel Tank, to separate the microsatellite alleles. The gel was then stained in a 0.5% ethidium bromide solution for 15 min and washed with water to enhance visualization under an ultraviolet (UV) illuminator.
The software AlphaEaseFC version 4.0 (Khan et al., 2014) was used for genotyping. Population genetic parameters such as the number of alleles (Na), effective number of alleles (Ne), frequency of alleles, observed heterozygosity (Ho), expected heterozygosity (He), genetic distance (DA) between the population pairs, and chi-square test for the goodness of fit to Hardy–Weinberg expectation (HWE), principal coordinate analysis (PCoA), genetic differentiation coefficient (FST), and analysis of molecular variance (AMOVA) were performed using the software GenAlEx version 6.5 (Peakall & Smouse, 2012) with 1,000 permutations. Fixation index within a specific subpopulation (FIS) was calculated in PopGene (Yeh et al., 1997). Pairwise fixation index for population differentiation (FST) values were corrected for the presence of null alleles using the excluding null allele (ENA) method using FreeNA (Chapuis & Estoup, 2007). The statistical significance of FST values between population pairs was assessed using the Bonferroni test in ARLEQUIN 3.0 (Excoffier et al., 2005) with 1,000 genotype permutations. Polymorphism information content (PIC) values were calculated using the formula PIC = 1 – ΣPi2, where pi is the frequency of the ith allele (Smith et al., 1997). The model-based approach for determining the genetic structure of four different populations of M. rosenbergii was analyzed using STRUCTURE 2.3.4 (Pritchard et al., 2000) to assess genomic clustering (k). In the assumption population menu, the assumed K value was set from 1 to 6, with 100,000 repetitions for the burn-in period length and the number of Markov chain Monte Carlo (MCMC) replications after burn-in. The ΔK is the most likely number of K that represents the population structure (Evanno et al., 2005). To obtain a representative K value for data modelling, 10 independent runs were performed for each value from 1 to 6. The software MEGA version 11 (Tamura et al., 2021) was used to construct the neighbor-joining dendrogram. Before statistical analysis, genotype data were checked for data integrity using Micro Checker version 2.2.3 (Van Oosterhout et al., 2004) to identify null alleles, allelic dropout, and stuttering-related scoring errors. STRUCTURE Harvester (Earl & vonHoldt, 2012) was used to visualize STRUCTURE output, including likelihood values and ΔK, to determine the most probable number of genetic clusters.
Results
We genotyped nine microsatellite loci in four M. rosenbergii populations, all of which were polymorphic. A total of 88 alleles ranging from 220 to 382 bp were detected at nine microsatellite loci with an average of 9.777 alleles per locus. The detailed allele frequencies are shown in Supplementary Table S1. A total of 11 private alleles were detected (Table 1). The CP hatchery population had the highest number of private alleles, with seven, among all other populations. The Kocha river-2022 population had three, and the Kocha river-2023 had one private allele, whereas no private allele was identified in the Fish-Tech hatchery population.
All loci were polymorphic (P95) across the four populations studied. The Na varies from 3 (Mbr-7, Mbr-10) to 11(Mbr-1). The average Na varied from 6 ± 0.799 (Fish-Tech) to 7.111 ± 0.735 (Kocha River population of both years). The Ne ranged from 1.504 for Mbr-7 (CP hatchery) to 7.921 for Mbr-1 (Kocha River-2022). The mean effective allele number varied from (3.865 ± 0.591) for the Fish-Tech hatchery population to (5.741 ± 0.673) for the Kocha River population sampled in 2022. The average observed heterozygosity across loci ranged from 0.183 ± 0.095 (Fish-Tech hatchery) to 0.444± ٠.٠٨٩ (CP hatchery). On the other hand, the average He was greater than the observed heterozygosity (Ho) in all the populations, ranging from 0.681 ± 0.052 (Fish-Tech hatchery) to 0.807 ± 0.021 (Kocha River-2022). A significant departure from the HWE was observed in 35 of the 36 tests (p < 0.05) (Table 2). Most of the PIC values were greater than 0.5, indicating their high effectiveness in genetic population analysis. The PIC values at Mbr-7 (CP hatchery) population and Mbr-10 (Fish-Tech hatchery) were 0.335 and 0.386, respectively, indicating moderate effectiveness. The results from Micro-Checker indicated no scoring errors or allele dropouts; however, null alleles were observed at 8 of 9 loci across all four populations (Table 3). Among the four experimental populations of the M. rosenbergii, the average null allele frequency of the CP hatchery population was lowest (0.1577) compared with the other three populations. However, all the experimental populations showed a higher average value of null allele frequency (Table 3) than the recommended threshold value of 0.02 (Dakin & Avise 2004).
AMOVA revealed that the most significant proportion of total variation, 61%, was due to variation between individuals, and 29% was attributed to within-individual variation within a population. In contrast, only 10% of the total variation was attributed to differences among the populations (Table 4).
The genetic differentiation (FST) values (both uncorrected and ENA corrected) are shown in Table 5. The uncorrected and ENA corrected FST values ranged from 0.027 to 0.105 and 0.010 to 0.108, respectively, indicating very low to moderate differentiation among the populations. The highest value of FST with ENA correction was 0.108 between the Kocha River 2023 population and the CP hatchery population, and the lowest FST value (0.010) was observed between the Kocha River 2022 population and the Kocha River 2023 population. All pairwise FST (both uncorrected and ENA corrected) comparisons were significant (p < 0.05), except for the Kocha River populations collected in 2022 and 2023 (FST = 0.027, p = 0.315). The highest DA (0.925) was detected between the CP hatchery population and the Kocha River-2023 population, whereas the lowest distance (0.589) was detected between the Kocha River-2022 and the Fish-Tech hatchery (Table 5).
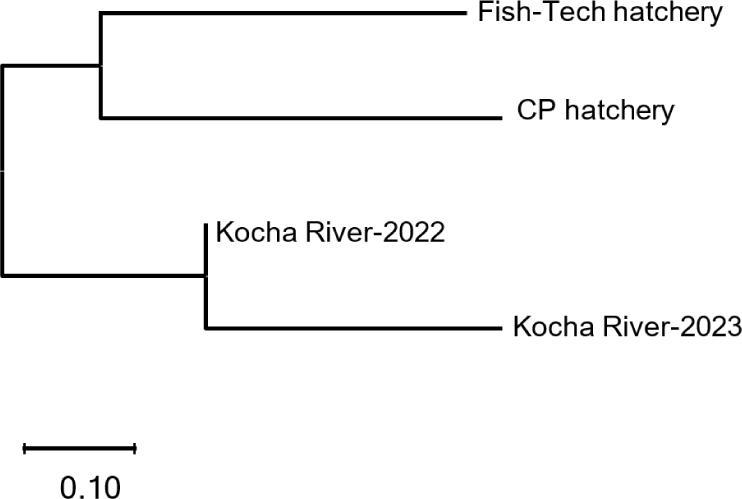
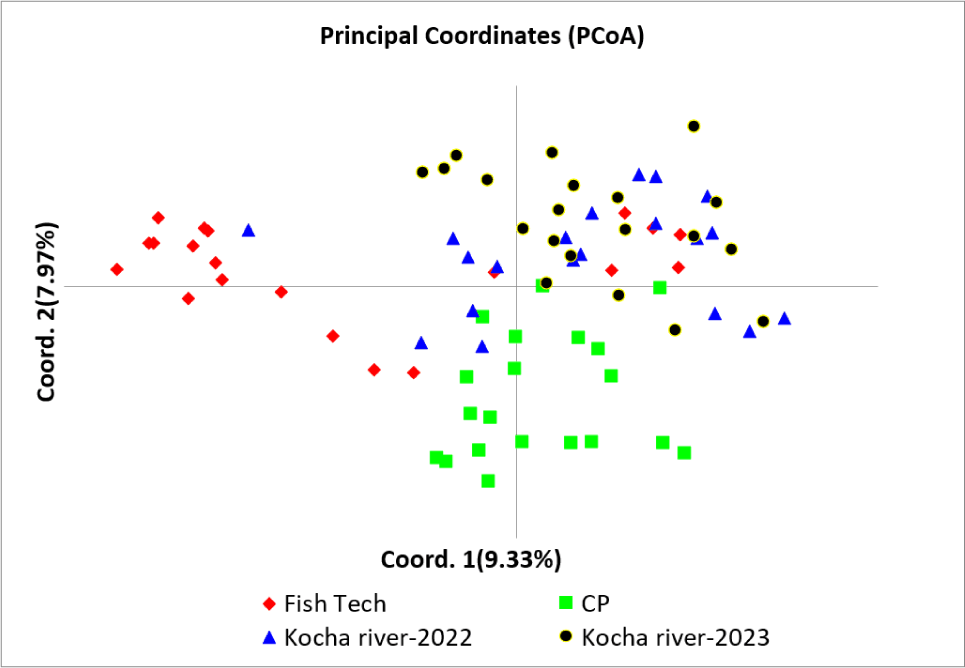
The Neighbour-joining dendrogram based on Nei’s DA data grouped the two hatchery populations (Fish-Tech and CP hatchery) in the same cluster, and the two wild populations (Kocha River-2022 and Kocha River-2023) in another cluster (Fig. 2). Principal coordinate analysis (PCoA) of the four populations revealed relationships among them. The first and second coordinates represent 9.33% and 7.97% of the variation, respectively (Fig. 3).
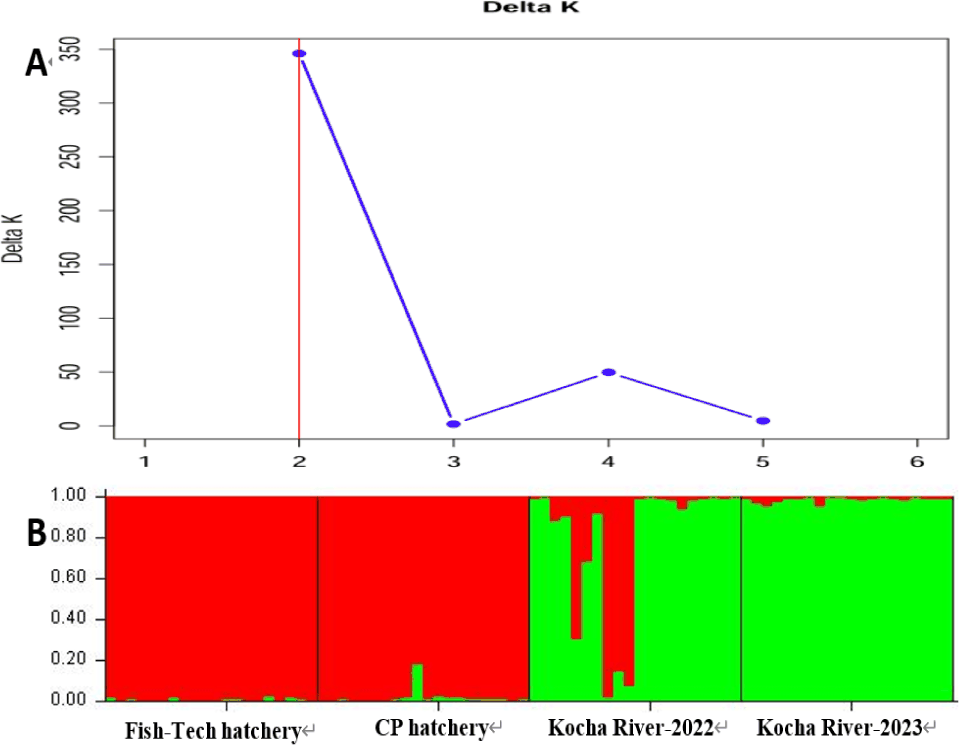
STRUCTURE software was used to elucidate population structure under an admixture model. The optimal number of clusters (K) was determined by the peak ΔK in the STRUCTURE analysis. The highest ΔK value was observed at K = 2, dividing the four populations into two groups (Fig. 4). One group includes two cultured populations, while the other consists of two wild populations.
Discussion
Genetic diversity is fundamental for evolutionary potential and population fitness (Ibrahim et al., 2025). Higher genetic diversity increases the capability for adaptation and breeding potential. In contrast, reduced genetic diversity jeopardizes survival and increases the risk of extinction, and it is also crucial for the sustainable aquaculture of M. rosenbergii. We employed nine microsatellite markers to assess the genetic diversity of four M. rosenbergii populations from four distinct locations in Bangladesh. The Na, Ho, He, and PIC are typically considered standard metrics to quantify population genetic diversity (Shete et al., 2000). In the present study, we detected 88 alleles at nine loci, ranging from 3 to 11, which is very similar to the number reported by Khan et al. (2014) for three river populations of M. rosenbergii in Bangladesh.
Different authors have reported variations in the Na in M. rosenbergii, such as 12–18 (Chand et al., 2005); 3–5 (Bhat et al., 2009); 4–20 (Chareontawee et al., 2007); 3–16 (Divu et al., 2008); 3–25 (Schneider et al., 2013); and 3–12 (Bhassu et al., 2008). The Na in a population generally increases with the population size, meaning larger populations tend to have more genetic diversity. This relationship occurs because larger populations are more likely to retain and accumulate rare alleles through mutation and genetic drift. The Ne represents the theoretical number of equally frequent alleles that would be required to produce the same level of He as observed in a real population with its diverse allele frequencies. Usually, Ne is always less than or equal to the actual Na. In the present study, we found a lower number of effective alleles than the actual number across the loci in all experimental populations, which is consistent with the findings of Khan et al. (2014), Nguyen Thanh et al. (2015), and Luan et al. (2006). We also found lower Ho than the He, indicating heterozygote deficiency across the loci in all studied populations. Similar observations have also been reported by Nguyen Thanh et al. (2015), Sánchez-Velásquez et al. (2022), and Ma et al. (2012). Several factors, e.g. founder effects, random genetic drift (Lacy, 1987), reduced effective breeding number, selection pressure at a particular locus, and variation in mating success, may contribute to low heterozygosity in the hatchery population (Wahidah et al., 2023). However, the reason behind the lower heterozygosity in natural populations is difficult to explain because various factors, such as sample bottlenecks (Allendorf, 1986), continuous environmental changes resulting from both anthropogenic and ecological activities (Mimura et al., 2017; Schaberg et al., 2008), may cause the loss of alleles and reduced genetic diversity. Additionally, scoring errors, allele dropout, and the presence of null alleles (Nguyen Thanh et al., 2015; Van Oosterhout et al., 2004) may also contribute to heterozygote deficiency. Heterozygote deficiency in the hatchery and wild populations found in the present study could be due to a small effective population and the presence of null alleles (Table 3). In any population, null alleles may arise from primer length (Wattier et al., 1998), poor primer annealing (Di Nunzio et al., 2022; Jahnke et al., 2022; Kwok et al., 1990), or insufficient amount of template DNA in the sample (Gagneux et al., 1997; Jahnke et al., 2022). To evaluate the potential impact of null alleles on downstream analyses, we applied the commonly used 20% threshold recommended by Dakin & Avise (2004). Their simulations demonstrate that null alleles with frequencies below p = 0.20 introduce only minor downward bias in exclusion probabilities and generally do not compromise population genetic inference. In contrast, null alleles exceeding this threshold can inflate allele frequency estimates and substantially increase false parentage exclusions. In our dataset, several loci (e.g., Mbr-1, Mbr-3, Mbr-7, Mbr-8, Mbr-11) exceeded the 0.30 level in one or more populations, indicating moderate to high null allele presence. However, these loci were retained because downstream analyses (ENA corrected FST, STRUCTURE clustering) are robust to null alleles, ensuring that the observed genetic patterns were not artefacts of amplification failure.
The PIC value is used to measure the informativeness of the markers and is typically categorized as high (PIC > 0.5), moderate (0.5 > PIC > 0.25), or low (PIC < 0.25) (Botstein et al., 1980). It also measures genetic variability within and between populations; higher PIC values indicate greater genetic richness and environmental adaptability (Avval, 2017). In this study, most loci exhibited high effectiveness (PIC > 0.5), except for Mbr-7 (CP) and Mbr-10 (Fish-Tech), which showed moderate effectiveness (0.25 < PIC < 0.5) (Table 2).
In this study, we found evidence of departures from the HWE in all the populations. Among the four populations, all loci of the river and the Fish-Tech hatchery populations were significantly deviated from the HWE (35 out of the 36 tests), indicating heterozygote deficiency (FIS > 0) relative to Hardy–Weinberg expectation, which may be attributed to inbreeding, nonrandom mating, variations in mating success, small sample sizes (Chareontawee et al., 2007), and reduced effective breeding numbers (Innes & Elliott, 2006; Schneider et al., 2013) in case of the hatchery population and Wahlund effects in case of the wild population. Although sampling in the Kocha River was conducted at two locations in two consecutive years, there was no physical barrier to prevent gene flow between the two subpopulations. So, mixing of individuals between these two sub-populations may cause a reduction in heterozygosity due to the Wahlund effect, and thus contribute to the deviation from HWE (Chareontawee et al. (2007). The presence of null alleles in the observed loci may also have contributed to the deviation from HWE (Gopalakrishnan et al., 2009; Nguyen Thanh et al., 2015) in the present study.
Private alleles are genetic variants unique to a specific population or individual and play a vital role in understanding a population’s genetic diversity and history. In the present study, we found the highest number (7) of private alleles in the CP hatchery population, indicating greater genetic divergence from the Bangladesh-origin populations. Khan et al. (2014), Chareontawee et al. (2007), and Schneider et al. (2013) also detected private alleles in different populations of M. rosenbergii.
AMOVA revealed significant variation within populations (90%) and limited differentiation among populations (10%) (Table 4), indicating high genetic diversity within each population and significant gene flow or recent shared ancestry among populations. This suggests that populations are relatively well connected and the differences between them are minor. The population pair-wise FST is a key measure of genetic diversity among populations (Ibrahim et al., 2025). The FST values represent degrees of genetic differentiation and are categorized as follows: moderate, 0.05 < FST < 0.15; high, 0.15 < FST < 0.25; and very high, FST > 0.25 (Wright, 1965). The presence of null alleles can lead to overestimation of both FST and DA (Chapuis & Estoup, 2007), which can make the populations more distinct. In the present study, we calculated ENA corrected FST along with the normal FST to avoid the bias of the null allele. The uncorrected and ENA corrected FST values were found very close to each other, indicating the null allele present in the dataset contributed an insignificant impact on the pairwise FST value. Similar to Ding et al. (2024), we found very low to moderate genetic differentiation between the population pair (Table 5). We observed the highest ENA corrected FST (FST = 0.108) between the Kocha River 2023 and the CP hatchery population. This might have occurred due to differences in their origin as the CP hatchery collected berried from Thailand for PL production. Conversely, a very low FST (0.010) between two wild populations collected from two different locations of the Kocha River (Fig. 1) in 2022 and 2023 indicates a close relationship, as they belong to the same river. The neighbour-joining dendrogram (Fig. 2) also supports a close relationship between the two Kocha River populations, as they are grouped in the same cluster, with the lowest DA of 0.239. The other cluster comprises two cultured populations. The STRUCTURE analysis grouped four M. rosenbergii populations into two clusters (K = 2) (Fig. 4), one comprising the Fish-Tech and CP hatchery populations, and the other consisting of two wild populations from the Kocha River. A very low FST value (0.010) and a low DA (0.239) between the two Kocha River populations support their association within the same group. Furthermore, similar results were obtained using the PCoA (Fig. 3).
Genetic variability is vital for survival and is a crucial factor for growth and interaction with the environment. The genetic structure of a population can be altered through interventions, potentially leading to a loss of genetic potential and hindering its ability to adapt to environmental changes, ultimately resulting in a decline in genetic diversity. Along with various factors, e.g. garbage dumping, agricultural pesticide and industrial waste runoff, the overexploitation of commercially important species is a principal cause of population decline (Schneider et al., 2013). Therefore, understanding the genetic structure of natural populations is crucial for the sustainable management of population diversity. Similar to Nguyen Thanh et al. (2015), the present study revealed relatively low levels of genetic diversity in the cultured and wild population of M. rosenbergii.
Conclusion
The findings of the present study revealed that among the four studied M. rosenbergii populations, the Thai-originated CP hatchery population exhibited genetic superiority (in terms of the mean Ho and the highest number of private alleles) relative to those of the other three populations. However, similar to many baseline microsatellite studies, the present study employed a limited sample size of 80 individuals (20 per population) and a modest number of loci (nine microsatellite loci). Consequently, the present study had limited statistical power to detect subtle structural or temporal changes. So, the findings of the study can serve as a baseline and be useful in future studies on the genetic diversity of different populations of M. rosenbergii, using additional loci (e.g., single nucleotide polymorphisms [SNPs] or additional simple sequence repeats [SSRs]) and larger sample sizes from multiple hatchery and wild sources. Besides, we recommend regular sourcing of berried from the wild population and periodic exchange of berried among local hatcheries and a marker-assisted selection (MAS) to select broodstock with the lowest kinship and high heterozygosity for maintaining the long-term sustainability and productivity of the hatchery stocks. Simultaneously, strict local government policies should be imposed for the sustainable exploitation of the river population of M. rosenbergii in Bangladesh.