Research Article
Stock identification of minor carp, Cirrhinus reba, Hamilton 1822 through landmark-based morphometric and meristic variations
Rokhsana Ethin1, Md Shakhawate Hossain1,2, Animesh Roy1, Marcellin Rutegwa3,*
1Department of Fisheries Biology and Aquatic EnvironmentBangabandhu Sheikh Mujibur Rahman Agricultural University1706GazipurBangladesh
2University of South Bohemia in České Budejovice, Faculty of Fisheries and Protection of Waters, South Bohemian Research Center of Aquaculture and Biodiversity of HydrocenosesZátiší 728/II, 389 25VodňanyCzech Republic
3Faculty of EducationUniversity of Rwanda-College of EducationP.O. Box 55RwamaganaEastern ProvinceRwanda
© The Author(s) 2019.
Open AccessThis article is distributed under the terms of the Creative Commons Attribution 4.0 International License (http://creativecommons.org/licenses/by/4.0/), which permits unrestricted use, distribution, and reproduction in any medium, provided you give appropriate credit to the original author(s) and the source, provide a link to the Creative Commons license, and indicate if changes were made. The Creative Commons Public Domain Dedication waiver (http://creativecommons.org/publicdomain/zero/1.0/) applies to the data made available in this article, unless otherwise stated.
Received: Mar 25, 2019; Accepted: Jun 13, 2019
Published Online: Jun 21, 2019
Abstract
Background
Wild fish populations stock is continuously diminishing in the Indo-Ganges river basin, and the population status of most fishes is unidentified. The identification of the population status and the conservation of commercially important and endemic wild fish populations in this region are crucial for the management. The aim of this paper was to identify the population status of Cirrhinus reba, a promising aquaculture but vulnerable species in the Indo-Ganges river basin in Bangladesh.
Methods
C. reba samples were collected from four isolated populations of the Brahmaputra (n = 30), the Padma (33), the Karatoya (31), and the Jamuna Rivers (30) in Bangladesh, and the population status was evaluated using morphometric and landmark comparisons. Data were analyzed with the Kruskal-Wallis test, univariate analysis, discriminant function analysis, and the formation of a dendrogram.
Results
Three meristic characters (Pectoral fin rays, caudal fin rays, scale in lateral lines), four morphometric characters (head length, pre-orbital length, post-orbital length, maximum body depth), and truss measurement (4–7) were significantly different among the stocks. The step-wise discriminant function analysis retained 15 variables from morphometric and landmark measurements that significantly differentiated the populations based on the constructed DFI and DFII. Discriminate function analysis also showed that 91.2% of the original groups were classified into their correct samples. The cluster analysis of Euclidean distances placed the Jamuna population in one cluster and the Brahmaputra, the Padma, and the Karatoya populations in the second one.
Conclusion
Morphological differences among the stock were probably due to different ancestral origin. This is the first report about population status of C. reba in their natural habitat of the Indian subcontinent. Further genetic studies and the evaluation of environmental impact on C. reba populations in Bangladesh are suggested to support our findings.
Keywords: Conservation; Cirrhinus reba; Population status; Threatened; Reba carp
Rokhsana Ethin and Md Shakhawate Hossain contributed equally to this work.
Background
The management and conservation strategy for different species, subspecies, stocks, and races depends on the information of biology and population structure of that particular group (Turan et al. 2006). Intraspecific variability in life history attributes in terms of growth, maturation, and development induce morphometric differences between species (Cadrin 2000). Morphometric variance among stocks of a species is considered an important marker for assessing the population dynamics and evaluation of the stocks for their management and sustainable harvest (Khan et al. 2013; Randall and Pyle 2008; Vishalakshi and Singh 2008). Intra- and interspecific biometric variation, especially in geometric terms, has long been investigated for overall patterns of racial, geographic variations (Gunawickrama 2007; Hajjej et al. 2011). Equally, meristic characters have also been found to be valid in stock identification for fishery purposes (Turan 2004). In addition, landmark or truss network systems are recent powerful tools for stock separation based on morphometric and meristic characters (Cadrin 2000), which are low cost compared to molecular techniques. In a small country like Bangladesh, where there are probably very small environmental changes from place to place, the resulting morphological differences in fish may be so small that they might be impossible to discern with gross morphometric characters.
Cirrhinus reba is a commercially important indigenous minor carp species, distributed over the Indian subcontinent (Rahman 2005; Talwar and Jhingran 1991) and locally known as reba carp, bhagna bata, raik, or tatkini. In Bangladesh, the natural distributions of C. reba included most of the rivers, small creeks, natural depressions, and floodplains (Akhteruzzaman et al. 1998; Hussain and Mazid 2001). It is highly popular to consumers due to its oily flesh and taste qualities as well as having a reasonable amount of protein, minerals, and fatty acid (Afroz and Begum 2014; Rahman 2005). The C. reba are omnivores column feeder in nature with a maximum length of 40–50 cm and can attain the sexual maturity at the age of 1+ year (Akhteruzzaman et al. 1998; Ali 1997; Rahman 2005). The spawning season of C. reba begins in April and lasts until August and fecundity is between 200,000 and 250,000 egg kg−1 body weight of females (Hussain and Mazid 2001). Though induced breeding and nursing of fry are mentioned by some authors (Akhteruzzaman et al. 1998; Rahman et al. 2009; Sarkar et al. 2004) the species is not yet subjected to commercial production (Mohanta et al. 2008). During the last two decades, the populations of this species from natural water bodies have declined in the Indian subcontinent due to overfishing (Sarkar et al. 2004) and anthropogenic activities leading to siltation, aquatic pollution, and loss of natural habitat for spawning and growth (Ahmad et al. 2013; Sarkar et al. 2004). Currently, C. reba is considered as a vulnerable species in Bangladesh (IUCN 2000). Therefore, it is necessary to identify the distinct wild stocks of C. reba for the development of good hatchery stocks through effective breeding technology, which is an important measure for mass seed production and sustainable aquaculture as well as conservation (Sarkar et al. 2004). Nevertheless, there is no known information available on the stocks of C. reba populations inhabiting natural waters of Bangladesh due to the scarcity of scientific works on the structural variations and no attempts have been made to assess the stock variability of different populations. The present study was therefore carried out to identify the stock structure of C. reba based on morphometric characters and truss network measurements in four rivers, the Padma, Jamuna, Brahmaputra, and Karatoya of Bangladesh.
Materials and methods
Fish sampling and preservation
In total, 124 individuals of C. reba were collected from the Brahmaputra River (n = 30), the Padma River (n = 33), the Karatoya River (n = 31), and the Jamuna River (n = 30) (Fig. 1, Table 1) with the help of local fishermen. The sampling sites were selected randomly to represent the major river systems of Bangladesh. Captured fish were wrapped into individual plastic bags and preserved and transported in an ice box to the laboratory for morphometric, meristic, and landmark measurements. Morphological identification of C. reba was done based on Talwar and Jhingran (1991).
Table 1. Sampling details of C. reba collected from different sources in Bangladesh
|
Sample sources
|
Location
|
Number of individuals
|
Total length (mean ± SD)
|
Month of capture
|
|
Brahmaputra River
|
Mymensingh
|
30
|
184.01 ± 16.74
|
February 2016
|
|
Karatoya River
|
Rangpur
|
31
|
158.83 ± 26.44
|
April 2016
|
|
Padma River
|
Faridpur
|
33
|
224.11 ± 12.36
|
May 2016
|
|
Jamuna River
|
Sirajgonj
|
30
|
194.08 ± 9.23
|
June 2016
|
Download Excel Table
Meristic and morphometric data and landmark distances
Eight meristic (Additional file 1: Table S1) and nine morphometric (Additional file 2: Figure S1) characters were recorded from the undamaged fish only immediately after arriving at the laboratory. The principle fin rays were counted manually. A magnifying glass was used to ease the counting of the fin rays. Morphometric characters were measured to an accuracy of 0.1 mm with digital calipers following the methods described by Hubbs and Lagler (2004).
For measurement of landmark distances, the truss network system described for fish body morphometric was used to construct a network on the fish body. Ten landmarks were measured (Bookstein 1997) by first placing an individual fish on a water-resistant paper and then by marking the points corresponding to the anatomical landmarks on the paper using needles (Additional file 3: Figure S2). Afterwards, the paper was removed from the fish, and the distances between perforated places on the graph paper were measured using digital calipers. Each landmark point was marked with colored pointers to enabled accurate and consistent measurements.
Data analysis
The Kruskal-Wallis non-parametric test (Hoaglin et al. 2009) was used to test fish from the four localities had significantly different meristic counts. The dorsal fin rays (DFR) and the scales below the lateral line (SBLL) were not analyzed using the Kruskal-Wallis test due to identical values in all samples. A multivariate discriminant analysis was used to identify the combination of morphometric variables that best separates the C. reba populations from the four rivers. Prior to the analysis, the size effects from the dataset were eliminated through the allometric formula of Elliott et al. (1995).
Madj = M(Ls/Lo)b
Where M is the original measurement, Madj the size-adjusted measurement, Lo the standard length of fish, Ls the overall mean of standard length for all fish from all samples in each analysis. The parameter b was estimated for each character from the observed data as the slope of the regression of log M on log Lo using the fish from all groups. The total length was excluded from the final analyses and transformed data were checked by testing the significance of the correlation between the transformed variables and the total length.
A univariate analysis of variance (ANOVA) was carried out to test if there was any significant difference in morphological parameters among individuals of different location (P < 0.05) on the basis of size-adjusted morphological and landmark distance data. In addition, all size-adjusted morphometric and landmark distance data were standardized and submitted to a discriminant function analysis (DFA). A dendrogram of the populations based on the morphometric and landmark distances data were drawn by the squared Euclidean dissimilarity distance method. All statistical analyses were done using SPSS Version.16 (SPSS, Chicago, IL, USA).
Results
Meristic characters
Among the counted meristic parameters, only the pectoral fin rays (PtFR), and the scales in lateral line (SLL) were varied significantly (Kruskal-Wallis, P < 0.05) among the stocks (Additional file 4: Table S2).
Morphometric and landmark distances
The allometric transformation of the morphometric (8) and truss measurements (22) did not show a significant correlation with the standard length. The univariate statistics (ANOVA) showed that among the eight size-adjusted general morphometric measurements, four measurements (head length, HL; pre-orbital length, pre-OL; post-orbital length, post-OL; and maximum body depth, MBD) and only one truss measurement (4–7) were significantly (P < 0.05) different among the stocks (Additional file 5: Table S3).
Pooled within groups correlation between discriminant variables and DFs revealed that among the morphometric measurements, the post-OL and the HL dominantly contributed to the first DF while, the pre-OL and the pre-dorsal length (Pre-DL) contributed to the second DF and the rest contributed to the third DF (Additional file 6: Table S4). Landmark measurements, 4 to 5, and 3 to 9 contributed to the first DF, whereas 5 to 7, 5 to 8, 5 to 6, 2 to 10, 1 to 10, 4 to 8, 3 to 10, 1 to 2, and 6 to 7 contributed to the second DF and the remaining 11 landmark measurements contributed to the third DF (Additional file 7: Table S5).
Discriminant function analysis produced three types of discriminant functions (DF1, DF2, and DF3) for both morphometric and landmark measurements. For morphometric measurements, the first DF accounted for 62.7%, the second DF 34.7%, and the third DF 2.6% of the total variability among groups respectively. In sum, the first DF and second DF explained 97.45% of the total variability among groups. For landmark measurements, the first DF accounted for 78.8%, the second DF 17.9%, and the third DF 3.3% of the total variability among the groups respectively. In sum, the first DF and second DF explained 96.33% of the total variability among groups. In canonical discriminant function, the Jamuna population sample formed a distinct group while the samples from the Padma, Brahmaputra, and Korotuya were clustered around their centroid value while overlapping to a certain degree with each other (Fig. 2). The discriminant function analysis also showed that the overall allotment of individuals into their original populations was high (91.2%). All of the fishes (100%) of Jamuna River were correctly classified into their own group. While 95, 92.9, and 80% of fishes were correctly classified for the Brahmaputra, Padma, and Karatoya River samples, respectively. On the other hand, the overlapping of samples from the Karatoya (20%) and the Padma (7.1%) rivers implied some misclassification (Table 2).
Fig. 2. Sample centroids and scatter plot of canonical discriminant function scores showing different stocks of C. reba based on morphometric and truss measurements
Download Original Figure
Table 2. Percentage of individuals correctly classified into their original populations using discriminate function analysis
|
Population
|
Predicted group membership1
|
Total
|
|
Brahmaputra
|
Karatoya
|
Padma
|
Jamuna
|
|
%
|
Brahmaputra
|
95.0
|
0.0
|
5.0
|
0.0
|
100.0
|
|
Karatoya
|
0.0
|
80.0
|
20.0
|
0.0
|
100.0
|
|
Padma
|
0.0
|
7.1
|
92.9
|
0.0
|
100.0
|
|
Jamuna
|
0.0
|
0.0
|
0.0
|
100.0
|
100.0
|
Download Excel Table
The dendrogram derived from the cluster analysis of Euclidean distances among groups of centroids showed that the four populations of C. reba segregated from each other into two distinct clusters (Fig. 3). The Padma populations formed one cluster with the Brahmaputra and the Karatoya populations. However, the Brahmaputra and the Karatoya populations formed another subcluster. Finally, the Jamuna River population formed a completely separate third group.
Fig. 3. Dendrogram based on size-adjusted morphometric and landmark distances of the Brahmaputra River, the Karatoya River, the Padma River, and the Jamuna River populations
Download Original Figure
Discussion
This study demonstrates that meristic attributes of C. reba including the number of pectoral fin rays (PtFR), caudal fin rays (CFR), and scales in the lateral line (SLL) varied significantly within the studied populations. This indicates that these populations underwent some extent morphological changes over the course of the time due to geographical isolation or might be of from different of ancestors’ origin. They may also be resulting from different environmental and habitat conditions variations. Since, fish shows higher plasticity in morphological traits to environmental changes (Wimberger 1992; Allendorf 1988; Stearns 1983; Swain et al. 1991). The variability of meristic counts of C. reba have also been reported in the findings of Hamilton (1822), Rahman (2005), Talwar and Jhingran (1991) and Galib (2008), while, Shafi and Quddus (2001) found no difference in meristic counts among different populations. The later researchers may have sampled populations that were experiencing similar environmental conditions or had a common ancestor and therefore were not undergo differentiation despite being isolated geographically. Similarly, variable meristic counts have also been observed in other fish species of isolated stocks, such as Labeo calbasu, Mesopotamian spiny eel, (Çakmak and Alp 2010); Heteropneustes fossilis, (Rahman et al. 2014) and Rhinomugil corsula, (Lipták et al. 2019).
In addition to meristic characters, a truss network system is another important criterion to discern species, subspecies, races, and strains and have been employed by different authors (Khan et al. 2013; Mir et al. 2013; Sajina et al. 2011; Siddik et al. 2016; Ujjania and Kohli 2011). These characters can be also modified by environmental fluctuations during early life-history stages of fish (Cheverud 1988; Reyment 1985). In the present study, we did not find any significant difference among the measured landmarked distance except one (4–7). Size-adjusted morphometric and landmark data showed phenotypic divergence among C. reba samples. The discriminant function analysis and dendrogram revealed the existence of two distinct morphologically differentiated stocks. The Jamuna River population itself is a unique stock, highly distinct from the other three stocks, and formed the first group due its geographical location. The Padma, the Brahmaputra, and the Karatoya River populations formed the second group. The stock from the Brahmaputra and Karatoya River sites had similarity in all examined parameters in addition to overlapping between the two populations. This confirmed their phenotypic similarity. Both the rivers are the distributary and tributary of the Jamuna River and point of origin not geographically isolated (Fig. 1). Fish could migrate from Jamuna River to these two rivers. This similarity indicates that the C. reba populations in these two rivers might be are of the same ancestral origin. On the other hand, the Jamuna stock highly deviated from the Brahmaputra and the Karatoya as well as from the Padma River samples. The sampling sites of Jamuna and Padma River are geographically far from the sampling sites of Karatoya and Brahmaputra River (see Fig. 1). These might make the Jamuna population unique from others. In accordance to geographical distance and sampling site position (downstream from the Jamuna sampling site) the Padma population could be connected with the Jamuna population. But, the Padma population was morphologically close to Karatoya and Brahmaputra population. Sometimes, it is quite difficult to explain the causes of morphological differences between populations (Cadrin 2000), but it is assumed that these differences might be related to genetical factors or be associated with phenotypic plasticity in response to different environmental factors in each area (Murta 2000). Environmental factors may be one of the reasons that explain the morphological differences observed in this study. Indeed, previous studies reported a difference in water quality parameters in these four rivers especially water temperature and the concentrations of dissolved oxygen (Haque et al. 2019; Islam et al. 2015; Islam et al. 2014; Uddin et al. 2014).
Other important morphological differences among these populations were noted in the area of the fish head, the maximum body depth, the pre-orbital length, and the post-orbital length. The relative head length was significantly higher in Jamuna samples, while the maximum body depth was lower in the Brahmaputra stocks than from the remaining stocks. On the other hand, the values of the eye diameter were significantly higher in Karatoya River sample and lower in Jamuna River population. Higher availability of food is one the reasons proposed to explain the development of large head, large eye diameter and long pectoral fins in fish (Rao 2001). This explains that Jamuna River was richer in food source for its fish stock than the others. Similarly, low availability of food was suggested as the reason for the presence of smaller mouth size, body depth, and short pectoral fin of the Channa punctatus in Yamuna River in India (Khan et al. 2013). The lower eye diameter of Jamuna River fish also suggests higher turbidity of its waters according to Moore (1950). This author noticed that reduced eye diameter was characteristic of fishes living in turbid waters. During our sample collections, we also observed higher turbidity in the Jamuna and the Padma Rivers (personal observation). Several authors also described that feeding regimes and water quality parameters are responsible for the morphological variations in the head region of fishes (Keivany et al. 2016; Sun et al. 2009).
Conclusion
C. reba has distinct two stocks in the four selected rivers. The Jamuna samples were unique compared to the Padma, the Brahmaputra, and the Karatoya River samples. The fish stocks in the Brahmaputra and the Karatoya Rivers were similar. The present study provides baseline biological information that is expected to be helpful in facilitating the development of management strategies in relation to the fishery and conservation of C. reba populations in selected rivers. However, further research is necessary to explore the genetic and molecular basis of stock discrimination as well environmental and climatic effect on the C. reba stock structures in the Indo-Ganger basin.
Acknowledgements
Authors would like to thank the funding agencies that supported financially this study and the local fishermen who helped in sample collection.
Consent of publication
Not applicable
Authors’ contributions
MSH designed the experiment, RE and MSH conducted the experiment, RE and AR collected the samples. RE and MSH drafted the manuscript. MR helped in data analysis and final revision. All authors read and approved the final manuscript.
Funding
The Ministry of Education, Youth, financially supported the study and Sports of the Czech Republic-project “CENAKVA” (LM2018099) and by the Grant Agency of the University of South Bohemia (no. 017/2016/Z).
Availability of data and materials
The datasets and/or analyzed during current study available from the corresponding author on reasonable request.
Ethics approval and consent to participate
No specific permissions were required for the locations and activities involved in this study. All experimental manipulations (capture and measurements) were conducted according to the principles of the Ethical Committee of Bangabandhu Sehikh Mujibur Rahman Agricultural University, Bangladesh, and National Research Ethics Committee (NREC) of Bangladesh. This study also follows the rules for the Protection of Animals in Research of the University of South Bohemia, Faculty of Fisheries and Protection of Waters, Research Institute of Fish Culture and Hydrobiology, Vodňany, based on the EU harmonized animal welfare act of Czech Republic. The principles of laboratory animal care and the national laws 246/1992 and regulations on animal welfare were followed (ref. number 22761/2009-17210).
Competing interests
The authors declare that they have no competing interests.
Publisher’s Note
Springer Nature remains neutral with regard to jurisdictional claims in published maps and institutional affiliations.
References
Afroz H, Begum M. Analysis of nutritional value and mineral contents of three different parts of body of
Cirrhinus reba. Int J Sci Eng Res. 2014; 5:2301-2306.

Ahmad S, Muralidharan M, Venkateshwarlu M, Arunachalam M. Distribution pattern, endemism, threat status and conservation measures of fishes in the Tunga and Bhadra rivers of Western Ghats, India. Environ Biol Fish. 2013; 96(10-11):1245-1256

Akhteruzzaman M, Kohinoor AHM, Islam MS, Modak PC. Observations on the induced breeding of indigenous small fishBhagna,(Cirrhinusreba Ham) in Bangladesh. Progress Agric. 1998; 9(1-2):281-284.
Ali MY. Small indigenous fish species culture in Bangladesh. 1997 Dhaka: Paper presented at the Proceedings of national workshop on small indigenous fish culture in Bangladesh, IFADEP-SP2. .
Allendorf FW. Conservation biology of fishes. Conserv Biol. 1988; 2(2):145-148
Bookstein FL. Morphometric tools for landmark data: geometry and biology. 1997 Cambridge: Cambridge University Press. .
Cadrin SX. Advances in morphometric identification of fishery stocks. Rev Fish Biol Fish. 2000; 10(1):91-112
Çakmak, Esen, & Alp, Ahmet. Morphological Differences Among the Mesopotamian Spiny Eel, Mastacembelus mastacembelus (Banks & Solander 1794), Populations. Turkish J Fish Aquatic Sci. 2010; 10:87-92.
Cheverud JM. A comparison of genetic and phenotypic correlations. Evolution. 1988; 42(5):958-968
Elliott NG, Haskard K, Koslow JA. Morphometric analysis of orange roughy (Hoplostethus atlanticus) off the continental slope of southern Australia. J Fish Biol. 1995; 46(2):202-220
Galib SM. A study on fish diversity and fishing gears of Chalan beel with reference to preservation of catches. 2008 Bangladesh: Honors dissertation submitted to the Department of Fisheries, University of Rajshahi. .
Gunawickrama KBS. Morphological heterogeneity and population differentiation in the green chromid Etroplus suratensis (Pisces: Cichlidae) in Sri Lanka. Ruhuna J Sci. 2007; 2:70-81.
Hajjej G, Hattour A, Hajjej A, Allaya H, Jarboui A, Bouain A. Biometry, length-length and length-weight relationships of little tuna Euthynnus alletteratus in the Tunisian waters. J Fish Aquatic Sci. 2011; 6(3):256
Hamilton F. An account of the fishes found in the river Ganges and its branches: Printed for A. Constable and company; 1822.
Haque MA, Jewel MAS, Sultana MP. Assessment of physicochemical and bacteriological parameters in surface water of Padma River, Bangladesh. Appl Water Sci. 2019; 9(1):10
Hoaglin DC, Mosteller F, Tukey JW. Fundamentals of exploratory analysis of variance, vol. 367: Wiley; 2009.
Hubbs CL, Lagler KF. Fishes of the Great Lakes region (revised ed.): The University of Michigan Press; 2004.
Hussain MG, Mazid MA. Genetic improvement and conservation of carp species in Bangladesh: Research Institute and International Center for Living Aquatic Resources Management, Bangladesh; 2001.
Islam MS, Ferdous J, Nasmi S, Kabir MH. Seasonal variations in water quality and its effects on fish production in the Brahmaputra River at Mymensingh of Bangladesh. Bang J Environ Sci. 2015; 29:18-25
Islam MS, Kabir MH, Sifat SA, Meghla NT, Tushar TR. Status of water quality from the Padma river at Bheramara point of Kushtia in Bangladesh. Bang J Environ Sci. 2014; 27:110-115.
IUCN, Bangladesh. Red Book of Threatened Fishes of Bangladesh: IUCN-The world conservation union; 2000. p. 116.
Keivany Y, Mousavi SMA, Dorafshan S, Zamani-Faradonbe M. Morphological variations of Alburnus mossulensis Heckel, 1843 populations in the Tigris tributaries of the Persian Gulf basin in Iran (Teleostei: Cyprinidae). Iran J Ichthyol. 2016; 3(3):190-202.
Khan MA, Miyan K, Khan S. Morphometric variation of snakehead fish, Channa punctatus, populations from three Indian rivers. J Appl Ichthyol. 2013; 29(3):637-642
Lipták B, Veselý L, Ercoli F, Bláha M, Buřič M, Ruokonen TJ, Kouba A. Trophic role of marbled crayfish in a lentic freshwater ecosystem. Aquat Invas. 2019; Accepted.
Mir JI, Sarkar UK, Dwivedi AK, Gusain OP, Jena JK. Stock structure analysis of Labeo rohita (Hamilton, 1822) across the Ganga basin (India) using a truss network system. J Appl Ichthyol. 2013; 29(5):1097-1103
Mohanta KN, Subramanian S, Komarpant N, Saurabh S. Alternate carp species for diversification in freshwater aquaculture in India. Aquaculture Asia. 2008; 13(1):11.
Moore GA. The cutaneous sense organs of barbeled minnows adapted to life in the muddy waters of the Great Plains region. Transac Am Microscop Soc. 1950; 69(1):69-95
Murta AG. Morphological variation of horse mackerel (Trachurus trachurus) in the Iberian and North African Atlantic: implications for stock identification. ICES J Marine Sci. 2000; 57(4):1240-1248
Rahman AKA. Freshwater fishes of Bangladesh (second ed.). 2005 Dakha: Zoological Society of Bangladesh. .
Rahman MA, Zaher M, Azimuddin KM. Development of fingerling production techniques in nursery ponds for the critically endangered reba carp, Cirrhinus ariza (Hamilton, 1807). Turkish J Fish Aquatic Sci. 2009; 9(2):165-172.
Rahman MM, Sharker MR, Sumi KR, Alam MA, Hossen MS. Landmark-based morphometric and meristic variations of stinging catfish, Heteropneustes fossilis (Bloch) among three isolated stocks, the Old Brahmaputra river and the Tanguar haor and a hatchery. Int J Fish Aquatic Stud. 2014; 1(3):163-170.
Randall JE, Pyle RL. Synodus orientalis, a new lizardfish (Aulopiformes: Synodontidae) from Taiwan and Japan, with correction of the Asian record of S. lobeli. Zool Stud. 2008; 47(5):657-662.
Rao RJ. Biological resources of the Ganga river, India. Hydrobiologia. 2001; 458(1):159-168
Reyment RA. Multivariate morphometrics and analysis of shape. J Int Assoc Math Geol. 1985; 17(6):591-609
Sajina AM, Chakraborty SK, Jaiswar AK, Pazhayamadam DG, Sudheesan D. Stock structure analysis of Megalaspis cordyla (Linnaeus, 1758) along the Indian coast based on truss network analysis. Fish Res. 2011; 108(1):100-105
Sarkar UK, Negi RS, Deepak PK, Singh SP, Srivastava SM, Roy D. Captive breeding of vulnerable Indian carp Cirrhinus reba with Ovaprim for conservation of wild populations. Aquaculture Asia. 2004; 9:5-7.
Shafi M, Quddus MMA. Bangladesher Matsho Shampad (Fisheries of Bangladesh)(in Bengali), Kabir publication. Dhaka; 2001. p. 153–4.
Siddik M, Chaklader M, Hanif M, Islam M, Sharker M, Rahman M. Stock identification of critically endangered olive barb, Puntius sarana (Hamilton, 1822) with emphasis on management implications. J Aquacult Res Dev. 2016; 7(2):411.
Stearns Stephen C. A Natural Experiment in Life-History Evolution: Field Data on the Introduction of Mosquitofish (Gambusia affinis) to Hawaii. Evolution. 1983; 37(3):601

Sun P, Hawkins W, Overstreet R, Brown-Peterson N. Morphological deformities as biomarkers in fish from contaminated rivers in Taiwan. Int J Environ Res Public Health. 2009; 6(8):2307-2331
Swain DP, Riddell BE, Murray CB. Morphological differences between hatchery and wild populations of coho salmon (Oncorhynchus kisutch): environmental versus genetic origin. Can J Fish Aquatic Sci. 1991; 48(9):1783-1791
Talwar PK, Jhingran AG. Inland fisheries of India and adjacent countries (Vol. 2). 1991 New Delhi: Oxford and IBH Publishing. .
Turan C. Stock identification of Mediterranean horse mackerel (Trachurus mediterraneus) using morphometric and meristic characters. ICES J Marine Sci. 2004; 61(5):774-781
Turan C, Oral M, Öztürk B, Düzgüneş E. Morphometric and meristic variation between stocks of Bluefish (Pomatomus saltatrix) in the Black, Marmara, Aegean and northeastern Mediterranean Seas. Fish Res. 2006; 79(1):139-147
Uddin MN, Alam MS, Mobin MN, Miah MA. An Assessment of the River water quality parameters: A case of Jamuna River. J Environ Sci Nat Res. 2014; 7(1):249-256.
Ujjania NC, Kohli MPS. Landmark-based morphometric analysis for selected species of Indian major carp (Catla catla, Ham. 1822). Int J Food Agric Vet Sci. 2011; 1:64-74.
Vishalakshi C, Singh BN. Differences in Morphological Traits between Two Sibling Species, Drosophila ananassae and D. pallidosa. Zool Stud. 2008; 47(3):352-359.
Wimberger PH. Plasticity of fish body shape. The effects of diet, development, family and age in two species of Geophagus (Pisces: Cichlidae). Biol J Linnean Soc. 1992; 45(3):197-218
Appendices
Additional files
Table S1. List of eight meristic characters used for the analysis of C. reba stock variations. (DOCX 15 kb)
fas-22-0-12-suppl1.docx
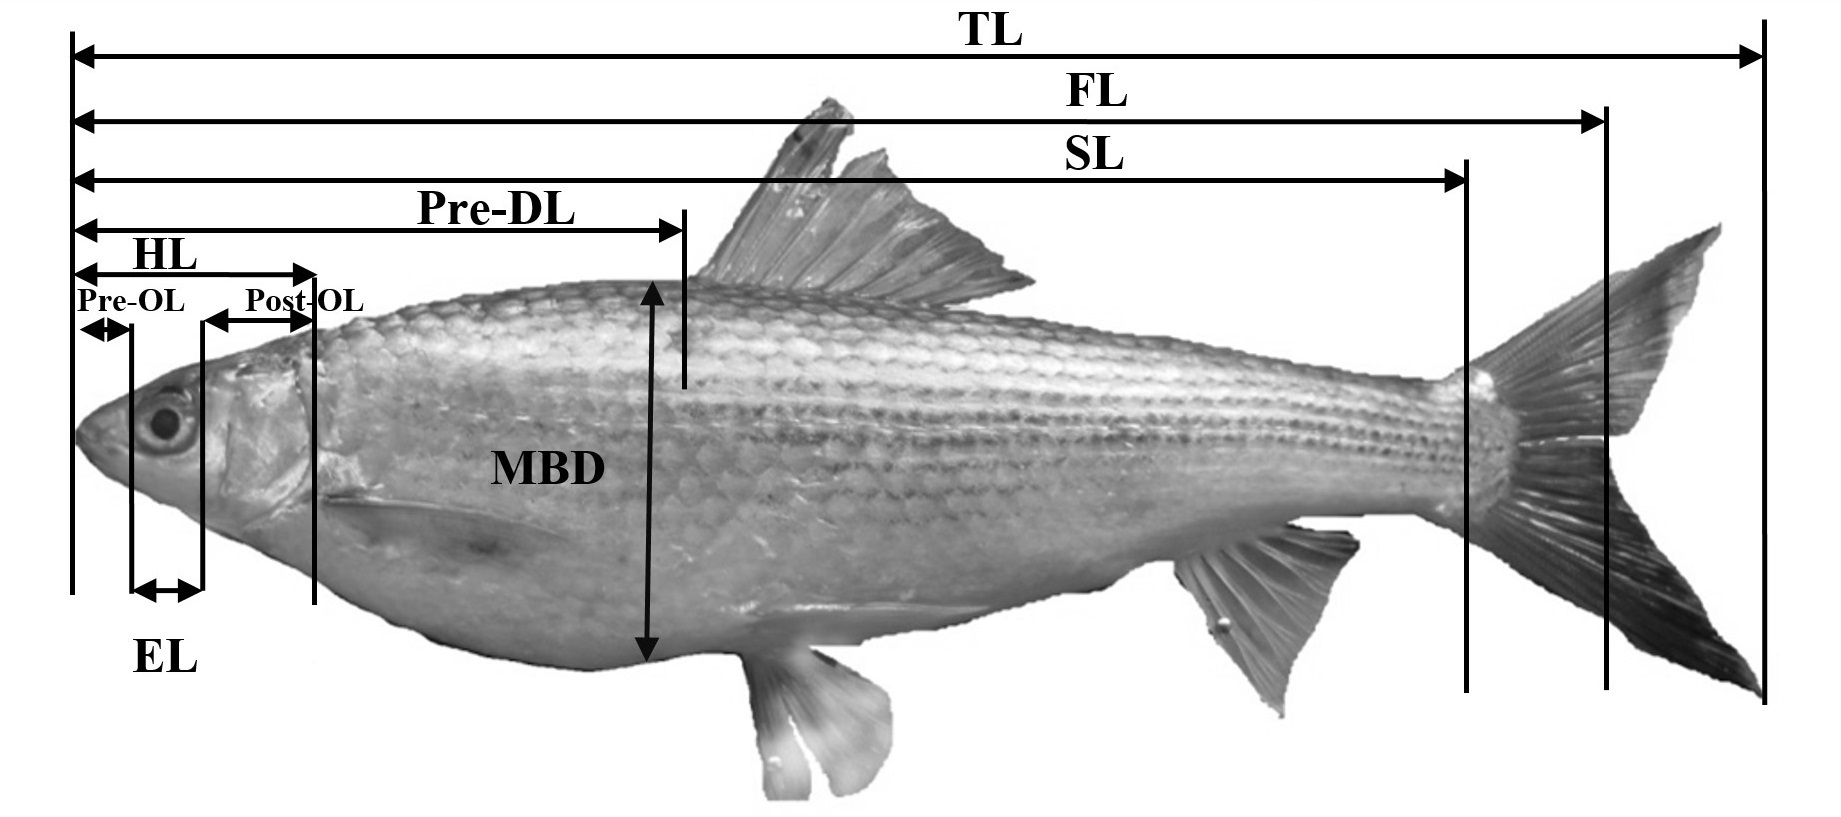
Figure S1. Indication of the general morphometric characters of the fish body. Morphometric characters refer to total length (TL), fork length (FL), standard length (SL), head length (HL), eye length (EL), pre-orbital length (Pre-OL), post-orbital length (post-OL), pre-dorsal length (pre-DL), and maximum body depth (MBD). (JPG 198 kb)
fas-22-0-12-suppl2.png
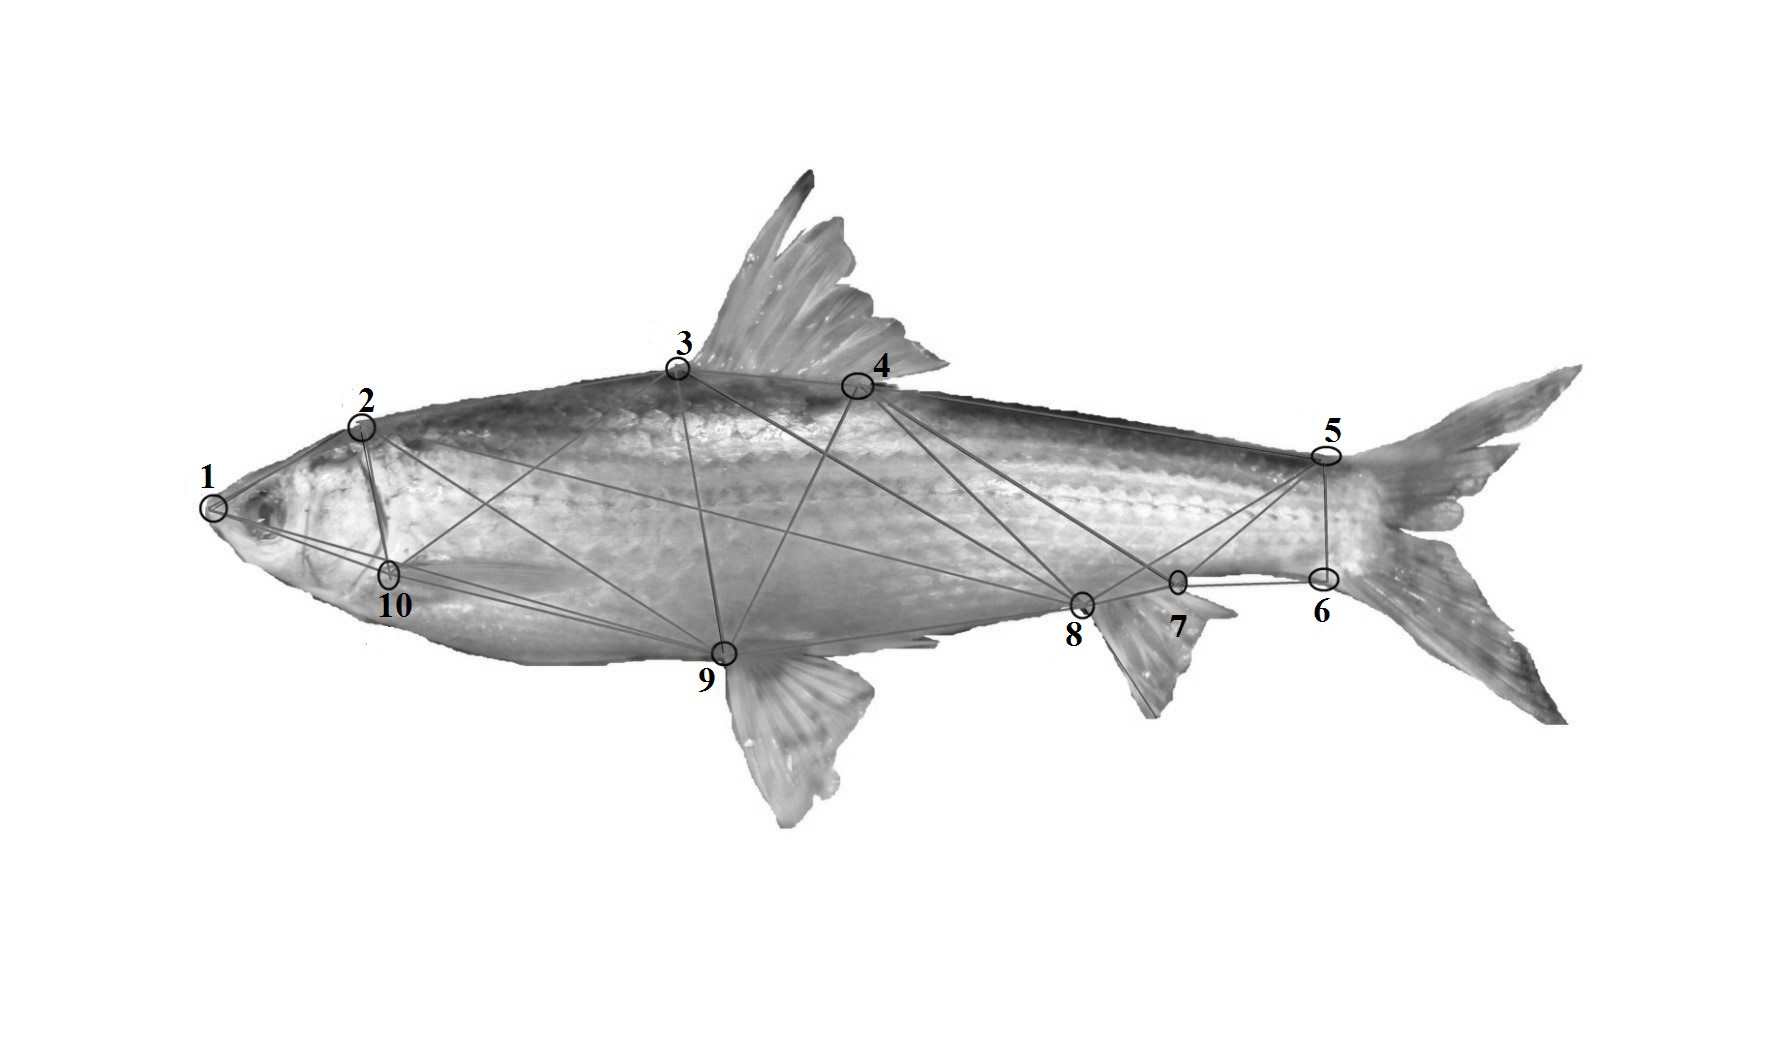
Figure S2. Location of the 10 landmarks for constructing the truss network on fish body illustrated as small circle and morphometric distance measures between the circles as lines. Landmarks refer to (1) anterior tip of snout at upper jaw, (2) most posterior aspect of neurocranium (beginning of scaled nape), (3) origin of dorsal fin, (4) insertion of dorsal fin, (5) anterior attachment of dorsal membrane from caudal fin, (6) anterior attachment of ventral membrane from caudal fin, (7) insertion of anal fin, (8) origin of anal fin, (9) insertion of pelvic fin, and (10) insertion of pectoral fin. (JPG 146 kb)
fas-22-0-12-suppl3.png
Table S2. Meristic counts (median) of C. reba collected from four populations (minimum and maximum counts are in parenthesis) and significance value of Kruskal-Wallis test. (DOCX 15 kb)
fas-22-0-12-suppl4.docx
Table S3. Univariate statistics (ANOVA) testing differences among samples from eight morphometric measurements and 22 truss measurements. Definition of all measurements are available in Fig S1 and S2 captions. (DOCX 17 kb)
fas-22-0-12-suppl5.docx
Table S4. Pooled within-groups correlations between discriminating variables and standardized canonical discriminant functions based on morphometric measurement (variables ordered by absolute size of correlation within function, *denotes the largest absolute correlation between each variable and any discriminant functions). (DOCX 15 kb)
fas-22-0-12-suppl6.docx
Table S5. Pooled within-groups correlations between discriminating variables and standardized canonical discriminant functions based on truss measurement (variables ordered by absolute size of correlation within function, *denotes the largest absolute correlation between each variable and any discriminant functions). (DOCX 16 kb)
fas-22-0-12-suppl7.docx