Introduction
The olive flounder (Paralichthys olivaceus) is a high-value species widely farmed in East Asia, particularly in Korea, China, and Japan. It shows rapid growth and high adaptability to farming conditions, enabling large-scale production. However, substantial variation in growth and disease susceptibility constrains productivity and profitability (Sano et al., 2009; Seo & Park, 2022; Shin et al., 2018). Therefore, improving key growth traits such as body weight (BW) and body length (BL) is essential to enhance economic efficiency in aquaculture (Dinh et al., 2022; Hasan et al., 2019). Recent genomic approaches, including genome-wide association studies (GWAS) and genomic selection, aim to identify the genetic determinants of growth in this species.
Substantial variation in growth rate and size is commonly observed among fish raised in culture and arises from both genetic and environmental factors, such as stocking density, water quality, and feeding regime. Such variation can reduce the effectiveness of selective breeding, underscoring the need to partition and quantify the genetic contribution to economically important traits (AKVAFORSK et al., 2005). Recent advances in high-throughput genomic technologies, including genome-wide SNP arrays and whole-genome resequencing, have enabled genome-wide, marker-based approaches to dissect the genetic architecture of complex traits in aquaculture species (Liyanage et al., 2022; Omeka et al., 2024; Udayantha et al., 2023). Among these approaches, GWAS are widely used to detect associations between phenotypes and genomic variants and have been applied to characterize the genetic basis of growth and other economically important traits in farmed fish. In olive flounder, GWAS and related genomic approaches have recently been used to investigate growth (Omeka et al., 2024), viral haemorrhagic septicaemia virus resistance (Liyanage et al., 2022), and thermal stress tolerance (Udayantha et al., 2023).
Heritability, defined as the proportion of phenotypic variance attributable to genetic differences, is a key parameter in selective breeding programs (Khalilisamani et al., 2022). Reported heritability estimates for growth traits in cultured species, including Dicentrarchus labrax, Hypophthalmichthys nobilis, Salmo salar, and Oreochromis niloticus support the feasibility of genetic improvement programs. Heritability can vary across developmental stages as environmental and physiological contexts alter gene expression. In many fishes, environmental variance explains a larger share at juvenile stages, whereas genetic influences increase later (Garant et al., 2003; Khang et al., 2018; Omeka et al., 2024; Trọng et al., 2013). In olive flounder, the heritability of BW and BL increases with age (Omeka et al., 2024), and similar trends have been reported in Atlantic salmon (Garant et al., 2003), tilapia, and Asian seabass (Lates calcarifer) (Khang et al., 2018; Trọng et al., 2013).
Despite substantial research at individual time points, quantitative estimates of genetic correlations across developmental stages remain scarce. To our knowledge, few studies have jointly analyzed growth traits across juvenile and adult stages in olive flounder, highlighting a key gap in stage-specific genetic understanding. Such estimates are crucial for designing stage-specific selection schemes and for anticipating correlated responses across life stages. Because heritability alone cannot clarify causal mechanisms, we additionally mapped trait-associated variants using GWAS. By detecting single-nucleotide polymorphisms (SNPs) associated with body weight (BW) and body length (BL), GWAS enables gene-level functional interpretation and strengthens marker-assisted or genomic selection. We further prioritized robust loci that consistently showed significant associations across different models, ensuring reliable interpretation of the GWAS results.
These considerations emphasize the need for integrative analysis across life stages. We hypothesized that (i) heritability estimates for body weight and body length would be higher at the adult stage than at the juvenile stage and (ii) genetic correlations between juvenile and adult measurements would be positive and moderate to strong, because environmental variance was expected to decrease with age under farming conditions, allowing the genetic component of growth variation to be more clearly expressed. Therefore, this study aimed to estimate the heritability of BW and BL at juvenile and adult stages, quantify genetic correlations across stages, and identify significant SNPs associated with growth traits through stage-specific GWAS, thereby providing insights into the genetic architecture of growth and informing selection strategies in olive flounder.
Materials and Methods
We developed a custom SNP array specifically for the olive flounder (P. olivaceus). For this purpose, we performed whole-genome resequencing on 100 randomly selected individuals. DNA libraries were sequenced on an Illumina NovaSeq 6000 platform (Illumina, San Diego, CA, USA) to an average depth of approximately 17.89 per individual.
The bioinformatic pipeline began with pre-processing the raw sequencing reads using SOAPnuke v2.1.0 to remove low-quality data. We aligned the cleaned reads to the olive flounder reference genome (genome reference consortium feature [GCF]_024713975.1) using the Burrows-Wheeler Aligner v0.7.17. Variants were discovered per sample with genome analysis toolkit (GATK) HaplotypeCaller in genomic variant call format (GVCF) mode and jointly genotyped with CombineGVCFs and GenotypeGVCFs in GATK v4.1. High-quality SNPs were selected based on three criteria. Variants were required to have a minor allele frequency of 0.05 or greater, a call rate of 95% or higher, and a Hardy-Weinberg equilibrium p-value not less than 1 × 10⁻⁶. SNPs that met these criteria were submitted for probe design, leading to the manufacture of a custom array with 60,445 SNPs on the Affymetrix® Axiom® myDesign™ Genotyping Array platform (Thermo Fisher Scientific, Waltham, MA, USA).
We analyzed the genetic basis of growth traits using 200 juveniles and 200 adults, each sampled as distinct individuals from matched full-sib families. Experimental fish were obtained from a hatchery in Taean, Republic of Korea. Juveniles had an average weight of 2.50 ± 1.10 g and an average length of 6.29 ± 0.96 cm. Adults averaged 853.35 ± 100.96 g in weight and 41.18 ± 1.46 cm in length.
The juvenile cohort included 200 fish sampled at 72 days post hatching (dph) from 10 full-sib families, with 20 randomly selected fish per family. The adult cohort comprised 200 distinct fish from the same families as the juveniles, sampled at 428 dph. During the juvenile phase, fish were reared in 3 m-diameter circular tanks under a flow-through seawater system. During the adult phase, fish were held in 7 × 7 m square tanks supplied with flow-through seawater, with an exchange rate of approximately 25 tank volumes per day. In both phases, tanks contained aerated seawater maintained at approximately 18–24°C, water quality was monitored regularly, and dissolved oxygen was kept above 5.5 mg/L.
Caudal fin tissues were collected from all individuals for genomic DNA extraction. Genomic DNA was isolated using the DNeasy® 96 Blood and Tissue Kit (QIAGEN, Valencia, CA, USA) following the manufacturer’s standard protocols. The DNA quality was verified by electrophoresis on a 1.0 % agarose gel and quantified using a NanoDrop spectrophotometer.
Genotyping was conducted using the 60K SNP Affymetrix® Axiom® myDesign™ Genotyping Array (Thermo Fisher Scientific). Genotype calling was performed using Axiom Analysis Suite version 5.2 (Thermo Fisher Scientific) following the Best Practices Workflow. Thresholds were set at data quality control (DQC) ≥ 0.82, quality control (QC) call rate ≥ 97%, and an average call rate for passing samples ≥ 98.5%. Quality control of raw data was conducted using PLINK v1.90, removing variants with minimum allele frequency (MAF) < 0.05, missing call frequencies > 10%, and Hardy-Weinberg equilibrium p-values < 1 × 10⁻⁶. After filtering, 43,686 SNPs were retained for GWAS, heritability, and genetic correlation analyses.
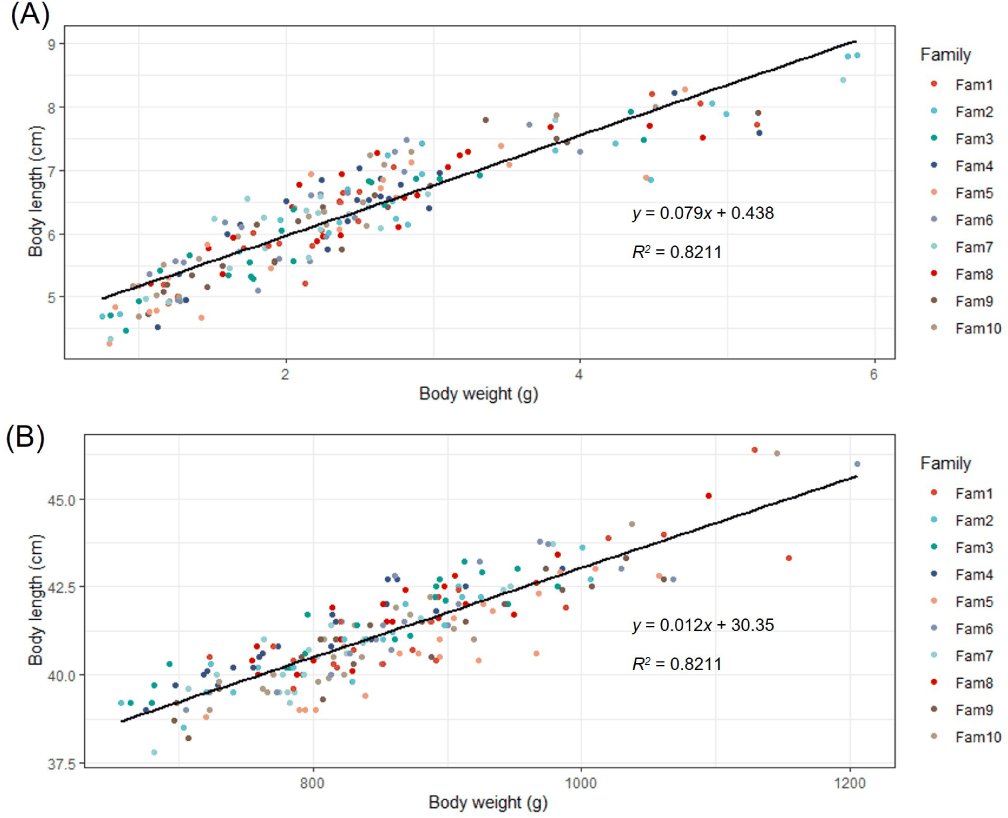
We analyzed the relationship between BW and BL to compare juvenile and adult growth, focusing on family-specific differences. BW was measured to 0.01 g using an electronic balance and BL to 0.1 cm using a fish measurement board. Individuals were assigned to families based on SNP genotypes using the Sequoia R package version 2.11.2 (Huisman, 2017). Family-specific distributions of BW and BL were visualized with boxplots to assess growth patterns. Linear regression was used to estimate slopes and R2 values, comparing the rate of BL increase relative to BW across families. The dataset included ten families, designated Fam1 through Fam10. Family-specific distributions are presented in Figs. 1 and 2.

To estimate heritability and genetic correlations for growth traits in the juvenile and adult stages, two analytical methods were employed. Heritability was estimated using a single-trait model based on the ridge regression best linear unbiased prediction (rrBLUP) package (v4.6.1) in R. This approach utilizes a genomic relationship matrix that reflects the genetic relationships among individuals and is based on an MLM framework that accounts for population structure and relatedness. Ridge regression was used to address multicollinearity, enabling effective estimation of polygenic effects from multiple SNPs. The rrBLUP model is expressed as follows (Meuwissen et al., 2001):
where y is the vector of phenotypic values, X is the design matrix for fixed effects, β is the vector of fixed-effects coefficients, Z is the design matrix for random effects, g is the vector of additive genetic effects, and e is the residual vector.
Genetic correlations were estimated with a Bayesian bivariate mixed model in Markov chain Monte Carlo generalized linear mixed model (MCMCglmm) using family means rather than a genomic relationship matrix (Hadfield, 2010). Juvenile and adult observations were from different individuals. We therefore used family means for the two traits in each fit. For trait pairs that included length we divided juvenile length by ten to reduce scale disparity. The model included trait specific intercepts, a random family effect with an unstructured covariance across traits, and an unstructured residual covariance. The model was where the family level correlation is derived from Σf.
Priors were inverse Wishart with V equal to the two by two identity matrix and ν equal to 0.002. Each model used 100,000 iterations with burn in 20,000 and thinning 100. Convergence was assessed using effective sample size and inspection of trace plots with 95 percent credible intervals. Estimates represent family level correlations and may include shared environmental effects when family and tank overlap. Genetic correlations were considered statistically significant when the 95 percent credible interval excluded zero.
To identify the genomic variants associated with growth traits in olive flounder, GWAS was conducted using MLM and BLINK models. All analyses were performed using the Genome Association and Prediction Integrated Tool (GAPIT) R package v3 (Wang & Zhang, 2021). Default parameters were used for both models, and Bonferroni correction was applied to adjust for multiple testing. The significance threshold for SNP associations was set at a p-value < 0.05. GWAS was performed separately for the juvenile and adult groups to identify stage-specific genetic variants related to BW and BL.
To account for population structure and relatedness, we employed MLM, which simultaneously incorporates fixed and random effects (Bhatnagar et al., 2020). This model enables more accurate detection of true associations by controlling for confounding factors. The MLM used in this study was defined as follows:
where y is the vector of phenotypic values, X is the design matrix for fixed effects, β is the vector of fixed effect coefficients, Z is the design matrix for random effects, u is the vector of polygenic effects, and e is the residual error vector. The random effects followed a multivariate normal distribution u ~ N(0, Gσ2g), where G is the genomic relationship matrix (GRM) computed from SNP markers and σ2g is the additive genetic variance. Residuals followed e ~ N(0, Iσ2g). MLM is effective at reducing false positives and is widely applied in GWAS of aquaculture and agricultural species (Lipka et al., 2012).
The BLINK model was also used to evaluate the SNP-trait associations. This model selects significant markers through an iterative fixed-effect regression approach and optimizes variable selection based on the Bayesian Information Criterion and linkage disequilibrium. This model is defined as follows:
where y is the phenotype vector, X is the design matrix for fixed effects, β is the corresponding coefficient vector, quantitative trait nucleotides (QTNs) represent the SNPs significantly associated with the trait, and e is the residual error vector (Wang et al., 2014).
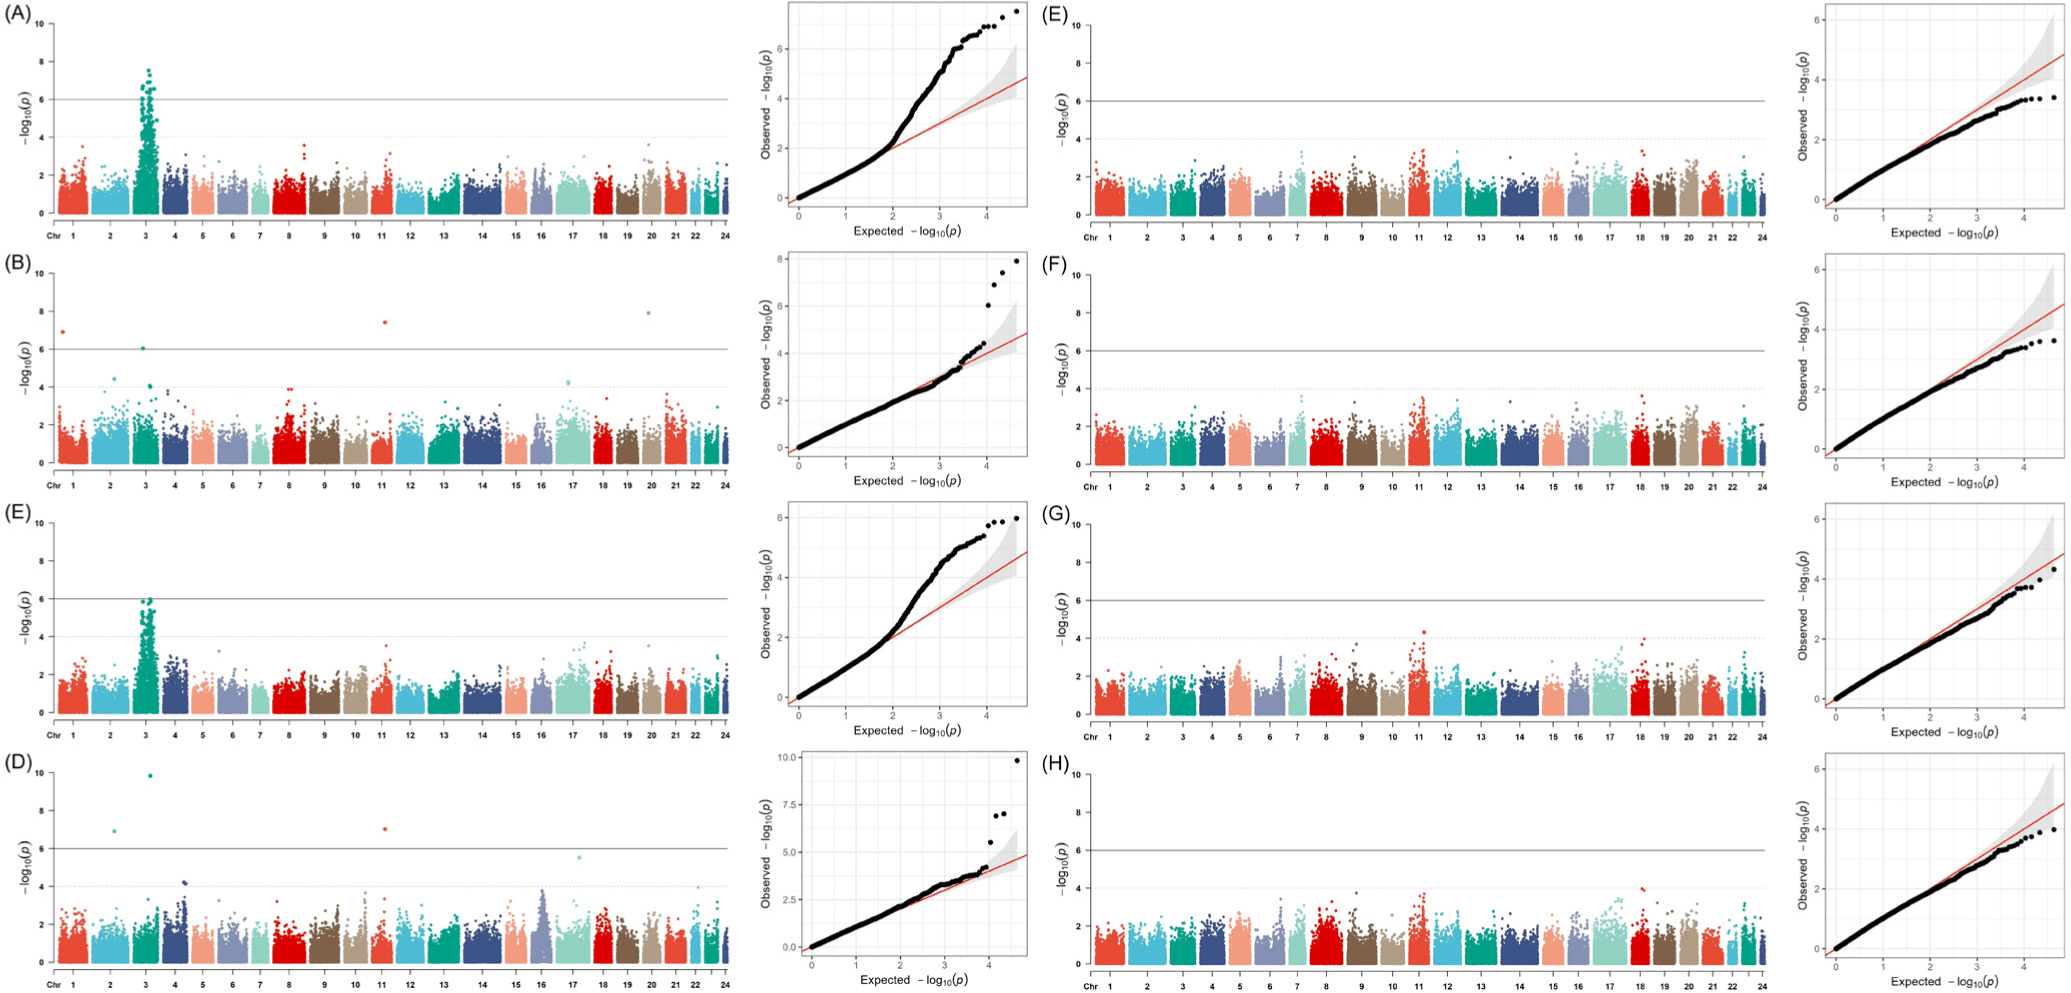
To evaluate the reliability of the statistical models and assess potential biases due to population structure, quantile-quantile (Q-Q) plots were generated for both the MLM and BLINK results. Deviations from the expected line indicate either true signals or inflation and provide a visual check of model fit and robustness.
Significant SNPs from GWAS were annotated by genomic context that included coding exons, introns, untranslated regions (UTRs), splice sites, and intergenic regions. Gene level annotations were generated with SnpEff v5.0 using the olive flounder National Center for Biotechnology Information (NCBI reference) sequence assembly GCF_024713975.2 (ASM2471397v2) and its generic feature format version 3 (GFF3) annotation (Huang et al., 2019). SNPs were mapped to gene features by overlap with GFF3 annotations and otherwise assigned to the nearest transcript within a predefined upstream or downstream window. For functional interpretation we queried NCBI Gene and UniProt Knowledgebase (UniProtKB) and extracted curated summaries of biological roles. We then prioritized variants in regulatory features that included 5’ UTRs and 3’ UTRs or located near genes with established roles in development for follow up validation and potential use in molecular breeding.
Results
Families differed markedly in juvenile BW and BL (Fig. 1A and 1C), whereas between-family differences were smaller in adults (Fig. 1B and 1D). In juveniles, Fam2 and Fam8 were heavier and longer on average, while Fam1, Fam3, and Fam4 were smaller, and several families showed wide within-family variation. In adults, averages were highest in Fam6, Fam8, and Fam9 and lowest in Fam7, with overall variation across families reduced relative to juveniles. Mean juvenile size was 2.41 g and 6.29 cm, and mean adult size was 853.35 g and 41.18 cm, corresponding to about a 350-fold increase in weight and a 6.5-fold increase in length. Linear regression showed a strong positive weight-length relationship in both stages with R2 of 0.8211 in juveniles and 0.7680 in adults (Fig. 2).
Heritability estimates derived from rrBLUP analysis indicated that adult traits were significantly more heritable than juvenile traits (Table 1). Adult weight (h2 = 0.485) and adult length (h2 = 0.427) exhibited high heritability, while juvenile weight (h2 = 0.023) and juvenile length (h2 = 0.009) showed near-zero heritability. To investigate the genetic relationships between traits, we estimated genetic correlations using MCMCglmm. Prior-specific estimates are provided in Supplementary Table S1, and the final correlations based on the ν = 20 prior are summarized in Table 2. A strong and robust positive genetic correlation was consistently observed between adult weight and adult length across three priors (rg = 0.952−0.970 for ν = 4, 10, and 20), supported by narrow 95% credible intervals (CrIs) that excluded zero and high effective sample sizes (ESS > 300). In contrast, the genetic correlation between juvenile weight and juvenile length was highly dependent on the prior. A near-perfect correlation was found under the weakest prior (rg = 0.989, 95% CrI: 0.959−0.999 at ν = 4), but this estimate collapsed toward zero for all stronger priors, suggesting this finding was not robust. All other trait pairs showed weak or non-significant genetic correlations, with 95% CrIs that consistently included zero.
| Category | Vu | Ve | h2 |
|---|---|---|---|
| Adult weight | 3742.939 | 3976.471 | 0.485 |
| Adult length | 0.7290 | 0.9798 | 0.427 |
| Juvenile weight | 0.0267 | 1.1448 | 0.023 |
| Juvenile length | 0.8532 | 90.8004 | 0.009 |
We performed GWAS with MLM and BLINK to map loci for BW and BL and visualized results with Manhattan and Q-Q plots (Fig. 3). In adults, genome-wide significant signals were prominent on chromosome 3 and BLINK produced stronger peaks with –log10(p) exceeding 8 for BL. Q-Q plots showed calibrated or mildly inflated test statistics depending on trait and model with genomic inflation factor (λGC) equal to 1.06 for juvenile weight in MLM, 1.07 for juvenile weight in BLINK, 1.048 for juvenile length in MLM, 1.088 for juvenile length in BLINK, 0.951 for adult weight in MLM, 1.114 for adult weight in BLINK, 0.921 for adult length in MLM, and 1.003 for adult length in BLINK, while tail deviations supported true associations. Juveniles generally showed weaker association patterns and most traits did not exceed the genome-wide threshold, although weak BLINK signals were noted on chromosomes 7 and 8 for juvenile BW. The number of genome-wide significant SNPs detected by each model is summarized in Table 3. After Bonferroni adjustment at p < 0.05, 25 SNPs were significant and several recurred across traits or across models (Table 4). In MLM, top associations localized to chromosome 3 whereas BLINK additionally detected signals on chromosomes 1, 2, 3, 11, and 20. Most significant SNPs were intronic or intergenic and some lay near 5’UTR or 3’UTR regions. Candidate genes included pomgnt1, camsap2a, ddr2a, dot1l, atp5f1d, slc35a3a, megf6, and lmo4b, which relate to cellular structure, gene regulation, energy metabolism, and tissue development. Among significant variants, AX-671628791 associated with both BL and BW, and AX-671409302 was detected by both MLM and BLINK, which supports consistency across analytical frameworks.
| Category | Number of significant SNPs |
|---|---|
| MLM model | 20 |
| BLINK model | 5 |
| Detected by both models | 2 |
| Total | 23 |
Discussion
Our heritability analysis for growth traits revealed a clear contrast between developmental stages (Table 1). In adult olive flounder, BW (h2 = 0.485) and BL (h2 = 0.427) showed moderate to high heritability, comparable to previous estimates for adult BW in this species (Park et al., 2021). In contrast, juvenile BW (h2 = 0.023) and BL (h2 = 0.009) showed near-zero heritability, which is markedly lower than the low-to-moderate juvenile heritabilities. These results indicate that additive genetic variance for growth is minimal at the juvenile stage but becomes substantial in adults. This pattern is more extreme than the gradual increase in heritability with age previously described for olive flounder and other aquaculture species and thus provides new evidence that the genetic architecture of growth can be strongly age-dependent in farmed fish.
Genetic correlation analyses using MCMCglmm further clarified these stage-specific genetic architectures (Table 2). Within the adult stage, BW and BL were strongly and positively correlated (rg ≈ 0.95–0.97), with 95% credible intervals that excluded zero and ESS exceeding 300. This strong correlation implies that selection for one adult trait will elicit a favorable indirect response in the other. By contrast, the genetic correlation between juvenile traits was not robust. An apparently high correlation emerged only under the weakest prior and was accompanied by low ESS, whereas under more informative priors the estimate collapsed toward zero. Together, these results provide only weak evidence for a stable shared genetic architecture in juveniles.
For inference, we primarily relied on the estimates obtained under the ν = 20 prior. This prior was weakly to moderately informative: it yielded high effective sample sizes and stable posterior correlations, avoided the extreme and likely overfitted juvenile correlations that appeared only under the very weak ν = 4 prior (which also showed low ESS), and at the same time did not impose the excessive shrinkage toward zero seen with the very strong ν = 50 prior, whose near-zero adult BW-BL correlations were inconsistent with the observed phenotypic relationships. We therefore regarded the ν = 20 results as providing the most credible compromise between allowing the data to inform the correlation structure and preventing over-interpretation in a setting with a limited number of families.
Crucially, we found no significant genetic correlation between juvenile and adult performance for either weight or length. These cross-stage correlations were approximately zero across all tested priors, suggesting limited genetic continuity from juvenile to adult growth expression. This finding explains why juvenile phenotypes served as poor predictors of adult performance in this cohort. These results have critical implications for selective breeding programs. Early selection based on juvenile measurements is unlikely to yield reliable genetic gain for adult growth (Fragkoulis et al., 2021). Instead, effective genetic improvement hinges on selection programs that target adult traits, capitalizing on their higher heritability and the strong, positive genetic correlation between them (Park et al., 2021; Vehviläinen et al., 2012).
As far as we are aware, reports of near-zero genetic correlations between juvenile and adult growth traits in olive flounder are scarce, and such weak cross-stage relationships appear to be unusual in fish breeding studies, where early growth is typically used as a pragmatic indicator of later harvest traits, integrating both early environmental conditions and underlying genetic differences. In this context and given that our juvenile measurements were taken at a relatively early developmental stage, our results suggest that, at least in this breeding population, juvenile and adult growth may be influenced by partly distinct sets of genes and environments, rather than by a single, stable “growth potential” that is expressed uniformly across life stages.
This clear shift in the genetic architecture of growth from juvenile to adult stages illustrates a gene-by-age interaction, where the effects of specific genes on a trait change with development (Ouellet-Fagg et al., 2025). Our findings suggest that distinct sets of quantitative trait loci (QTL) likely govern growth during different ontogenetic phases, explaining why early-life performance is a poor predictor of adult genetic merit.
In this study, GWAS revealed significant stage-specific differences in the genetic architecture of growth traits in olive flounder. Significant genetic associations for growth traits were consistently detected in the adults, whereas in juveniles, no SNPs surpassed the stringent genome-wide significance threshold set by Bonferroni correction. This finding is plausibly attributable to the inherently low heritability of juvenile traits and a moderate sample size, which collectively diminish the statistical power of GWAS to detect true associations (Oikonomou et al., 2022). Therefore, the substantial phenotypic variation driven by significant environmental noise during the juvenile phase likely masks the underlying genetic contributions, making them difficult to identify statistically.
To enhance the reliability of our findings and obtain a more comprehensive view of the genetic control of growth, we employed two complementary analytical frameworks, MLM and BLINK. This strategy allowed us to categorize significant associations based on their robustness and potential biological function. First, the convergence across methods increased our confidence in key loci. For example, SNP AX-671409302 was detected by both models, reinforcing its credibility as a genuine locus for growth. Second, the analysis highlighted potential pleiotropy, with SNPs AX-671376467 and AX-671628791 being significantly associated with both BW and BL. This pattern is suggestive of their involvement in shared regulatory pathways, although it requires further functional validation.
In addition, most genome-wide significant SNPs for adult growth traits were clustered on chromosome 3, whereas other chromosomes showed at most suggestive signals. Linkage disequilibrium analysis in this region revealed blocks of moderate-to-high LD over approximately 3.8 Mb, suggesting that many of these significant SNPs are likely tagging the same underlying QTL, or a small number of closely linked QTL, rather than representing multiple independent association signals (Supplementary Fig. S1).
Our analysis also distinguished a subset of model-specific associations from the overlapping signals. These unique findings are likely not false positives, but rather outcomes attributable to the distinct statistical methodologies and underlying assumptions of each model. MLM accounts for population structure and kinship as random effects, which can down-weight the significance of markers in the presence of strong relatedness (Zhang et al., 2010). In contrast, BLINK uses a stepwise fixed-effect approach that prioritizes SNPs with strong individual associations (Broer et al., 2013; Enyew et al., 2022; Wang et al., 2022; Yoon et al., 2023; Yu et al., 2006). Therefore, interpreting both the consistently identified and model-specific SNPs requires caution but provides deeper insights, collectively pointing toward an integrative genetic architecture for adult growth (Sandoval-Castillo et al., 2022; Sinclair-Waters et al., 2022). Understanding this network topology provides a predictive framework for how selection pressures on growth could cascade to affect other physiologically correlated traits.
Our GWAS identified several high-confidence SNP markers for growth, distinguished by high statistical reliability or pleiotropic effects on both BW and BL. SNP AX-671409302 was identified in both MLM and BLINK models, indicating a robust association unlikely to be a statistical artifact. Furthermore, SNPs AX-671376467 and AX-671628791 were associated with both length and weight, suggesting they reside in genes with a central role in overall growth regulation, a point of high biological relevance given the close correlation of these traits.
Annotation of these significant loci revealed candidate genes involved in two critical aspects of growth: (i) cellular proliferation and energy metabolism, and (ii) tissue development and skeletal formation. In the first group, dot1l and mrps22represent core components of epigenetic regulation and mitochondrial protein synthesis, respectively (Amsterdam et al., 2004; Wong et al., 2015). dot1l encodes a histone H3K79 methyltransferase, and knockdown of dot1lin zebrafish leads to impaired growth, defective angiogenesis and cardiac dilatation, indicating that disruption of this pathway compromises normal somatic development (Morello et al., 2012; Nil et al., 2023). Likewise, zebrafish mutants for mitochondrial ribosomal proteins, including mrps22, show severe growth retardation and developmental defects due to impaired oxidative phosphorylation, underscoring the importance of mitochondrial translation for body growth (Wong et al., 2015). The association of SNPs near these genes (AX-671630357 and AX-671376467) therefore suggests that variation in core epigenetic and metabolic processes contributes to growth differences in olive flounder.
In the second group, candidates were linked to the structural development of the organism. The gene megf6 (AX-671630439) encodes a multiple epidermal growth factor (EGF)-like domain protein with an established role in skeletal development; combined loss of the zebrafish paralogs megf6a and megf6b causes a marked delay in cartilage and bone formation as well as abnormal caudal fin ossification (Lindsay-Mosher et al., 2020; Teerlink et al., 2021). Similarly, rgmd (AX-671630258) encodes a member of the repulsive guidance molecule family that acts as a coreceptor in the bone morphogenetic protein (BMP) signaling pathway, and zebrafish rgmdis annotated as participating in BMP signaling and is expressed in the musculature system and pharyngeal arches, structures that contribute to craniofacial and axial growth (Camus & Lambert, 2007). These observations support the hypothesis that megf6 and rgmd influence body size through effects on skeletal and muscle development. We also identified a candidate, Tafa-1 (AX-671596714), that may influence growth indirectly through systemic pathways involving stress and immune responses, illustrating the complex interplay between physiology and growth (Sarver et al., 2021).
Collectively, our findings delineate the complex, polygenic architecture of growth in olive flounder, implicating a network of candidate genes crucial for cell growth, skeletal development, energy metabolism, and environmental responsiveness. These loci, including dot1l, rgmd, megf6, and mrps22, represent a critical foundational resource for developing molecular breeding strategies. However, to translate these statistical associations into reliable breeding tools, a crucial next step is rigorous functional validation. Future studies must therefore employ physiological approaches, such as gene expression profiling and functional assays, to confirm the biological roles of these major candidate genes.
Several considerations should be kept in mind when interpreting our results. First, juvenile and adult traits were measured on different individuals that were sampled from the same ten full-sib families, so the cross-stage correlations are best viewed as family-level rather than strictly individual-level genetic correlations. Because all fish were reared in the same flow-through tank system under standardized husbandry, environmental heterogeneity was minimized, but it remains difficult to separate additive genetic effects from shared family and tank environments, which may result in an inflation of the additive genetic variance. Second, the sample size of approximately 200 genotyped fish per stage is relatively small for GWAS and reduces the power to detect loci with small or moderate effects. Even so, the significant SNPs detected for adult traits indicate that variants of relatively larger effect can still be identified in this setting, and the absence of genome-wide significant associations for juvenile traits is consistent with both the very low heritability estimates and the restricted statistical power, rather than providing strong evidence for a complete lack of genetic control. Third, we did not explicitly evaluate genotype-by-environment interactions across different rearing systems or environmental gradients, so the heritability and association estimates reported here primarily characterize this breeding population under a single farm environment. Despite these limitations, the combined patterns of stage-specific heritability, family-level genetic correlations, and GWAS signals provide useful insight into how the genetic architecture of growth can shift between juvenile and adult stages in olive flounder.
Within this framework, the candidate loci identified in our GWAS provide an initial genomic scaffold for improving growth in olive flounder. While these candidates are likely to represent loci with relatively large effects, they constitute only a subset of a more intricate genetic landscape. Given the highly polygenic nature of growth, many additional small-effect variants are likely to remain undetected in the present dataset. Therefore, a comprehensive future strategy should adopt a two-pronged approach: (i) functionally validating the major candidate genes identified here, while (ii) concurrently performing larger-scale GWAS with imputed genotypes to uncover a greater proportion of the remaining heritability. This integrated effort will be essential for building highly accurate genomic prediction models for genomic selection and ultimately accelerating genetic gain in olive flounder aquaculture.
Conclusion
In summary, this study suggests clear stage-specific differences in the genetic architecture of growth traits in olive flounder (Paralichthys olivaceus). Adult BW and BL showed moderate to high heritability and a strong positive genetic correlation, supporting their use as reliable selection targets. Juvenile traits displayed near-zero heritability and no significant cross-stage correlations, indicating limited value for early selection. GWAS identified consistent signals in adults. No significant signals appeared in juveniles, likely due to low heritability, moderate sample size, and early-stage environmental variation. Several robust loci and candidate genes, including dot1l, mrps22, megf6, rgmd, and Tafa-1, were implicated in cell proliferation, energy metabolism, skeletal development, and environmental responsiveness, consistent with a complex polygenic basis of growth. Collectively, these results clarify stage-dependent growth regulation in olive flounder and outline a foundation for molecular breeding. Future research should pair functional validation with larger-scale GWAS to detect small-effect variants, improve genomic prediction, and accelerate genetic improvement.