Introduction
Anguillid eels (Anguilla spp.) are both ecologically and economically important fish with complex catadromous life cycles, involving long-distance migrations between oceanic spawning grounds and freshwater or estuarine habitats (Tesch & Thorpe, 2007). The early juvenile stage, known as the glass eel phase, represents a critical recruitment stage in the life cycle, during which transparent-bodied juveniles transition from the ocean to inland waters. The abundance of glass eels in estuaries and rivers is a key indicator of recruitment success and overall population status (Bornarel et al., 2018).
Globally, anguillid eel populations have declined sharply in recent decades due to a combination of overfishing, habitat degradation, water pollution, migration barriers, and climate change (Dekker, 2019). These threats are particularly relevant to tropical anguillid species such as Anguilla bicolor and Anguilla marmorata, which are prevalent in Indonesian waters. A. bicolor dominates in rivers like Cimandiri and Cikaso (West Java), while Anguilla marmorata and Anguilla celebesensis are more common in the Poso River (Central Sulawesi). These rivers serve as vital recruitment sites, making them critical locations for monitoring and conservation efforts.
Despite their ecological importance, anguillid eels in Indonesia remain under substantial pressure from unregulated and illegal fishing practices. Effective management is hindered by a lack of long-term data and limited enforcement capacity (Shiraishi & Crook, 2015). Monitoring the abundance and biomass of glass eels is fundamental to understanding population dynamics, identifying critical environmental drivers, and guiding conservation and fisheries management. Such data also contribute to broader international initiatives aimed at reversing eel population declines and safeguarding biodiversity (ICES, 2020). In tropical systems like Indonesia’s, however, studies on recruitment patterns remain limited, and there is an urgent need for location-specific, data-driven assessments.
This study aims to assess the abundance, biomass, and environmental factors influencing glass eel recruitment in three key Indonesian rivers (Cimandiri, Cikaso, and Poso) using locally appropriate fishing gears and hydrological conditions. The objective is not to conduct a direct comparison among rivers and fishing gears, but rather to provide site-specific recruitment estimates that can support local management and long-term monitoring. By applying multiple modelling scenarios that incorporate variations in water depth and current, this research seeks to refine population estimates and identify the most influential hydrological parameters. Through systematic monitoring and scenario analysis, the study supports sustainable fisheries management, informs conservation policy, and contributes to the long-term preservation of anguillid eel populations in Indonesia.
Materials and Methods
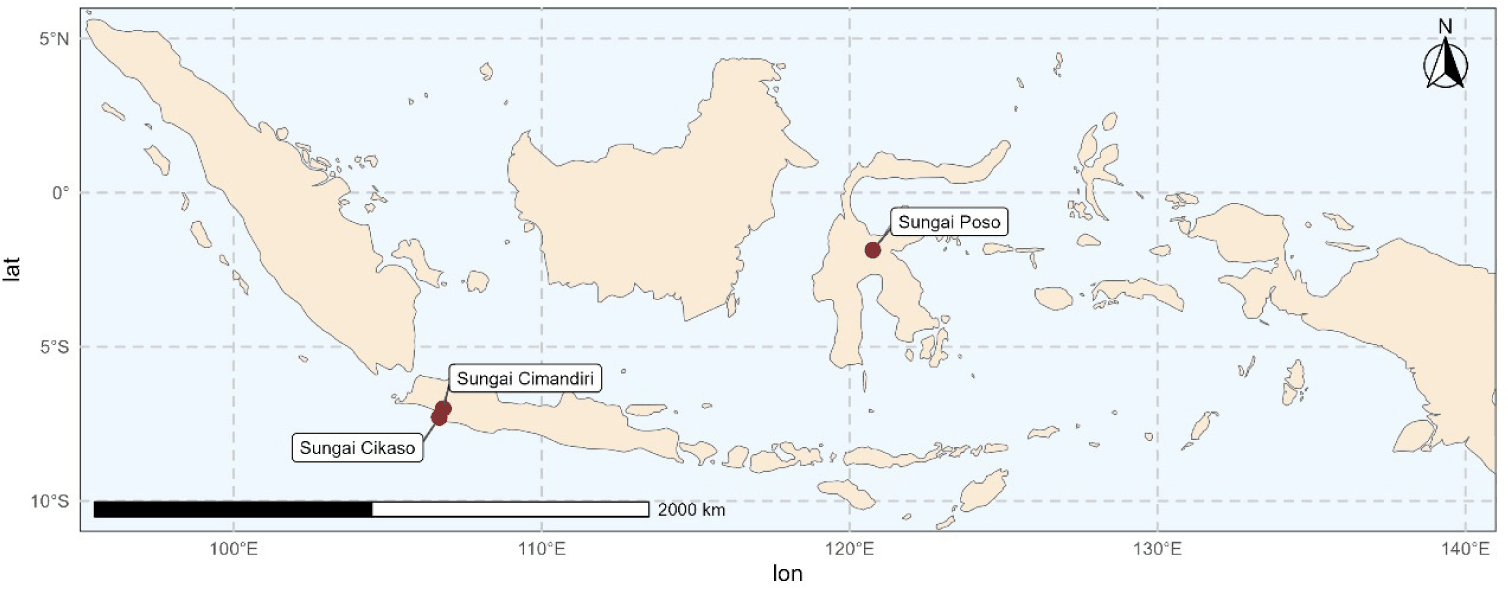
This study were carried out at the three rivers in Indonesia; the Cimandiri, Cikaso, and Poso Rivers. Started in August 2020 until December 2025. The Cimandiri and Cikaso Rivers are located in Sukabumi Regency, West Java. While the Poso River is located in Poso Regency, Central Sulawesi (Fig. 1).
The glass eel catch activities on each location conducted by 3 fishers in 4 days; 2 days before and 2 days after the new moon phase. The fishing gears that used to catch glass eel are different. Different fishing gears were used in each location according to local fishing practices and environmental conditions. These gears were not intended to be standardized across sites, as the study focuses on within-river estimation rather than cross-site comparison. Fig. 2 shows the fishing gear used in the Cimandiri and Cikaso Rivers, called scoop net. The fisher catch glass eel in the river mouth on the both side of the river. The fishers in the Cimandiri River was done for 6 hours to catch glass eel and in the Cikaso River was done for 6 hours to catch glass eel.
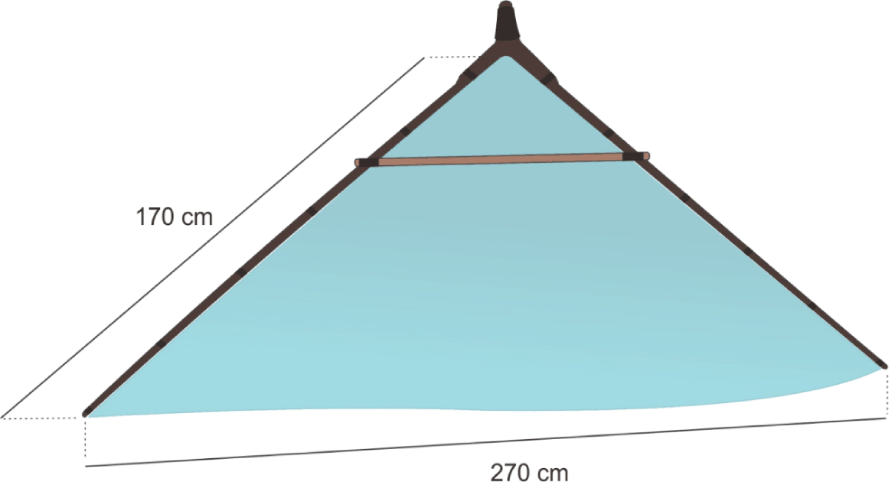
Scoop net is a mobile fishing gear that is always moving, operated by one fisher. The fisher will move to find and catch glass eel with the help of lighting devices. Fishing areas are usually from the edge of the river to a certain depth where they can still operate scoop net, depending on the depth.
There are several things that need to be considered in calculating the estimated abundance and biomass of glass eel with scoop net fishing gear:
-
Efforts made by fishers to fish: It is important to know the amount of fishers’ efforts in fishing in every second. In this study, the average fisherman’s effort in fishing was 4 times in one minute.
-
Effective time of fishing: In catching glass eels, fishers need time to rest. Usually, they will inhale the glass eel for 20 minutes then will rest in 10 minutes.
-
Fishing gear volume and fishing area: The volume of fishing gear is calculated by multiplying the area of fishing gear that enters the water and the distance of the fishing area that is scooped. In calculating the area of fishing gear, the height used is the depth of water because not all fishing gear part goes into the water. The volume of the catch area is calculated by multiplying the area of the fishing area by the depth of the water.
-
The volume of water passing through the fishing gear and the fishing area: The volume of water that passes through the fishing gear is calculated by multiplying the volume of the fishing gear by the time required to do one scoop. The volume of water passing through the fishing area is calculated by dividing the volume of the fishing area by the time it takes for the water to pass through the length of the fishing area. The time required is calculated by dividing the length of the fishing area by the speed of the water current.
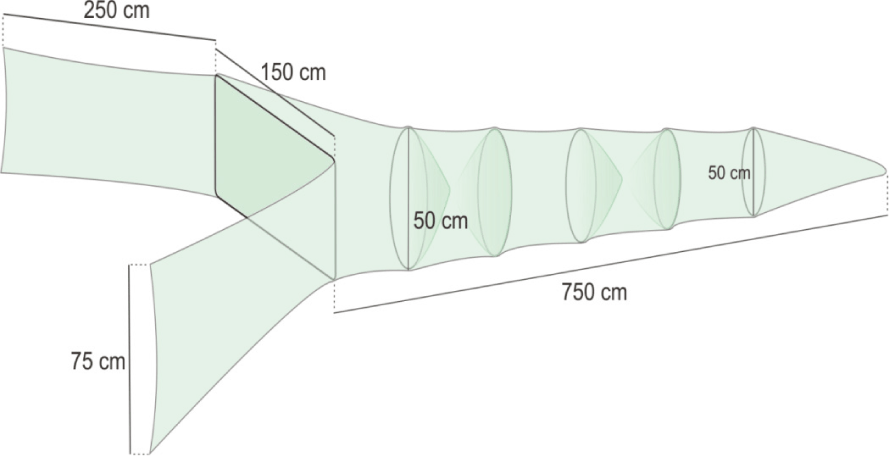
Fig. 3 illustrates the fishing gear used in the Poso River, known as a fyke net. This gear is semi-stationary, and fishers typically reposition it at certain times. Fishing activities in the Poso River typically last for 12 hours to target glass eels. Fishers haul the gear every hour to collect the catch, after which the gear is reinstalled. The fyke net, a semi-stationary fishing gear, is usually operated by at least two fishers. Its placement is adjusted according to tidal conditions; when the water depth increases, the fishers relocate the net. Once installed, the fyke net is left in place and checked after an hour, when it is lifted to retrieve the catch. Several factors must be considered when estimating the abundance and biomass of glass eels using fyke net fishing gear:
-
Fishing gear volume and fishing area: The volume of fishing gear is calculated by multiplying the area of fishing gear that enters the water and the length of fishing gear. In calculating the area of fishing gear, the height used is the depth of water because not all fishing gear part goes into the water. The volume of the catch area is calculated by multiplying the area of the fishing area by the depth of the water.
-
The volume of water passing through the fishing gear and the fishing area: The volume of water passing through the fishing gear is obtained by dividing the gear volume by the length of the gear, then dividing it by the water current. The volume of water passing through the fishing area is obtained by multiplying the width of the fishing area, the water depth, and the water current.
By considering the differences of the fishing gear, the formula to calculate the estimation abundance and biomass of glass eel should be different.
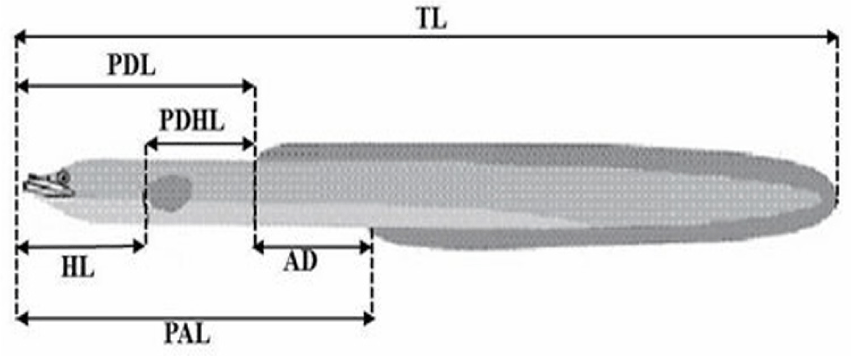
Only 10% of samples was collected every month from each location, however the total catch every month was collected. Samples collected will analyzed to measure weight-length and the morphometric measurement (Fig. 4). Morphometric measurement were carried out to determine the percentage of ano-dorsal length (AD) / total length (TL) that will be used in determining the species of glass eel in each location.
The abundance and biomass estimation of glass eels play a crucial role in understanding their population dynamics, recruitment patterns, and sustainability in different river systems. The methods applied, including the use of scoop nets in Cimandiri and Cikaso (West Java), and fyke nets in Poso (Central Sulawesi), allow for the collection of essential data on glass eel distribution and density. By applying standardized formulas, we can determine how environmental factors, such as depth, and water current, influence the seasonal recruitment of glass eels. These factors are critical for managing glass eel populations, as fluctuations in recruitment rates may indicate changes in habitat quality or broader ecological disturbances (Dekker, 2003). The formula for estimating the abundance and biomass of glass eels is primarily based on modifications from Triyanto et al. (2021).
• Determination of volume of the fishing gear
VFA is the volume of the fishing area (m3), in connection of the fishing gear used are in two kinds of fishing gear:
a. Scoop-net, has a shape like a triangular pyramid. l is the length of the fyke net (m), w is the width of the bottom of the scoop-net (m) and h is the height of the fyke net (m).
b. Fyke-net, has a shape like a rectangular pyramid. l is the length of the fyke net (m), w is the width of the fyke net (m) and h is the height of the fyke net (m).
• Estimation abundance and biomass of glass eels
N is the average amount of glass eel catches in one day divided by the fishers’ catch efforts during the effective hours of catching.
mp is migration period of glass eel in one month which is calculated in seconds.
p is the proportion of the volume of water passing through the fishing gear to the volume of water passing through the fishing area. This compares how many percent of the fishing area is used in one scooping.
Meanwhile, in the Poso River, fisher use fyke nets to catch glass eels. To calculate the abundance of glass eel using the same formula. However, there are differences in some variable calculations because fyke net is a semi-stationary fishing gear.
N is the average amount of glass eel catches in one day divided by the fishers’ catch efforts during the effective hours of catching.
mp is migration periode of glass eel in one month which is calculated in hours.
p is the proportion of the volume of water passing through the fishing gear to the volume of water passing through the fishing area. This compares how many percent of the fishing area is used in one scooping.
The physical and hydrological variables presented in Table 1, particularly monthly water current and water depth, were used as the empirical basis for the four modelling scenarios. In this study, the term change refers to monthly field-measured variations recorded during each sampling period, rater than simulated, projected, or hypothetical flow regimes. These monthly variations represent observed hydrological variability at the river mouth, including seasonal discharge fluctuations, rainfall-driven water-level changes, tidal influence, and local conditions. In contrast, the term constant refers to the use of the average value of each hydrological parameter over the sampling period. Therefore, the scenario analysis was designed to evaluate the sensitivity of abundance and biomass estimates to observed temporal variation in water current and depth.
-
Gen/Geb Base: water current (monthly observed value), depth (monthly observed value). This is the most dynamic scenario, where both water current and depth change over time, using the true values obtained from sampling rather than averages. It represents the realistic environmental conditions, based on original data. By analysing this model, researchers can understand how combined fluctuations in depth and flow affect glass eel recruitment.
-
Gen/Geb S1: water current (average value), depth (monthly observed value). In this scenario, water current remains constant (using the average value), but depth varies over time based on real sampling data. Depth fluctuations may result from seasonal water level changes, rainfall, or tidal influences. This model helps evaluate how variations in depth affect the migration and catchability of glass eels. Average of the water current in three rivers are different, in the Cimandiri River the average is 0.20 m/s, in the Cikaso River is 0.20 m/s and in the Poso River is 0.25 m/s.
-
Gen/Geb S2: water current (monthly observed value), depth (average value). This model assumes depth remains constant (using the average value), while water current changes based on actual sampling data. This scenario aims to determine how fluctuating water current influences glass eel movement and abundance. Average of the depth also different on the three rivers, in the Cimandiri River the average is 0.58 m, in the Cikaso River is 0.58 m, and in the Poso River is 0.33 m.
-
Gen/Geb S3: water current (average value), depth (average value). This scenario assumes that both water current and depth remain constant throughout the study period. “Constant” in this context means that we use the average value of water current and depth, rather than fluctuating measurements. This serves as a control model to understand glass eel abundance under stable environmental conditions. By keeping these two factors unchanged, the analysis can focus on other variables influencing glass eel recruitment.
Result
Results are presented separately for each river to describe temporal patterns of glass eel abundance and biomass within each location. Therefore, the differences among rivers should be interpreted descriptively and not as direct quantitative comparisons.
Fig. 5 presents the results in the Cimandiri and Cikaso Rivers show similarities from the four scenarios. There are several months showing trend differences, where the Base and S2 scenarios have the same results while the S1 scenarios are the same as the S3 scenarios. The similarity between the Base and S2 scenarios, as well as between S1 and S3, indicates that water current is the primary driver influencing abundance estimates. Scenarios combining monthly observed water current (Base and S2) reflect temporal hydrological variability, whereas scenarios using constant current values (S1 and S3) tends to mask these fluctuations, resulting in similar trends.
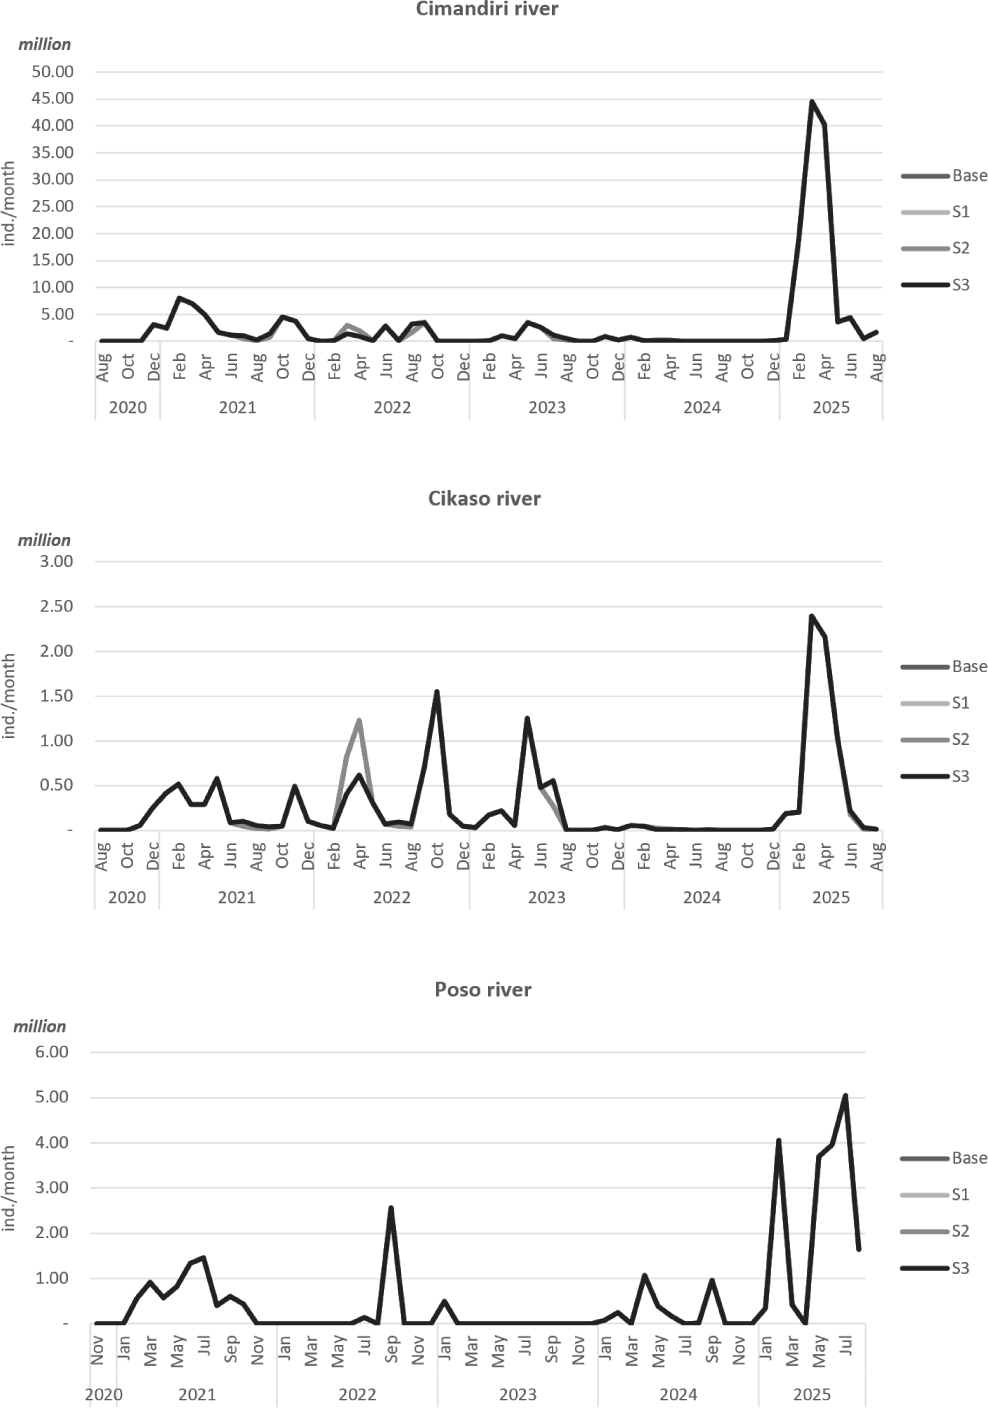
In the Cimandiri River, the highest abundance each year is in February 2021 as many as 7.98 million glass eels, September 2022 as many as 3.51 million glass eels, May 2023 as many as 3.34 million glass eels, January 2024 as many as 0.76 million glass eels, and March 2025 as many as 44.54 million glass eels. From the abundance trend, it shows that the peak season of glass eel fishing can occur at the beginning and end of the year.
The total estimated abundance of glass eel in 2021 is 36.58 million glass eels, in 2022 is 13.02 million glass eels, in 2023 is 10.49 million glass eels, in 2024 is 1.46 million glass eels, and until August 2025 the estimated abundance will reach 114.41 million glass eels. The data shows that from 2021 the abundance of glass eel has decreased and returned well in 2025. Based on information from the fishers, this is a natural phenomenon that usually occurs. There are certain years when the abundance of glass eel will be very high and in other years it may be that glass eel is not found.
Meanwhile in the Cikaso River, the highest abundance each year is in May 2021 as many as 0.58 million glass eels, October 2022 as many as 1.55 million glass eels, May 2023 as many as 1.25 million glass eels, January 2024 as many as 0.05 million glass eels, and March 2025 as many as 2.39 million glass eels. From the abundance trend, it shows that the peak season of glass eel fishing can occur at the beginning and end of the year. The peak season in the Cikaso River show the similarity with the peak season in the Cimandiri River.
The total estimated abundance of glass eel in 2021 is 3.02 million glass eels, in 2022 is 5.08 million glass eels, in 2023 is 2.80 million glass eels, in 2024 is 0.16 million glass eels, and until August of data collection, the estimated abundance in 2025 will reach 6.18 million glass eels. Similar with the Cimandiri River, the data in the Cikaso River shows that from 2021 the abundance of glass eel has decreased and returned well in 2025.
In the Poso River, all four scenarios show very similar abundance estimates. This indicates that, within the observed range of monthly water current and depth during the sampling period, these hydrological variables did not substantially influence the calculated catch-based abundance estimates using fyke nets. This result is probably explained by the relatively small differences between the monthly observed values and their average values for both water current and depth. Since the variability of these parameters was limited, substituting observed values with average values in different scenarios did not give significant changes in the estimated abundance. Therefore, the abundance estimates from all four scenarios were closely comparable.
The estimated total abundance of glass eel in the Poso River in 2021 is 7.11 million glass eels, in 2022 it will be 2.70 million glass eels, in 2023 it will be 0.51 million glass eels, in 2024 it will be 2.95 million glass eels, and until August 2025 it will be 19.18 million glass eels. Meanwhile, the peak season in 2021 occurred in July of 1.46 million glass eels, in September 2022 is 2.56 million glass eels, in January 2023 is 0.50 million glass eels, in April 2024 is 1.07 million glass eels, and in July 2025 is 5.06 million glass eels. In Poso river, the peak season can occur at any time, regardless of the beginning and end of the year.
To calculate the biomass of glass eel, it is to multiply the abundance value of glass eel by the average weight of glass eel. The average weight of glass eel is obtained from samples taken to the laboratory for length-weight and morphometric measurements. The graph of glass eel biomass shows the same pattern as the abundance of glass eel. From the measurement results, the average weight of glass eel in the Cimandiri River is 0.12 grams/ind., in the Cikaso River it is 0.10 grams/ind., and in the Poso River it is 0.11 grams/ind. For example, the total estimated abundance in the Cimandiri River in 2021 was approximately 36.58 million individuals. Using the site-specific average individual weight of 0.12 g, the estimated biomass was calculated as 36.58 million × 0.12 g = 4,389,600 g (approximately 4,389 kg). Similarly, in the Cikaso River in 2025, the estimated abundance was approximately 6.18 million individuals and the average individual weight was 0.10 g, resulting in 6.18 million × 0.10 g = 618,000 g (approximately 618 kg). Fig. 6 below shows the biomass values of glass eel at the three river locations.
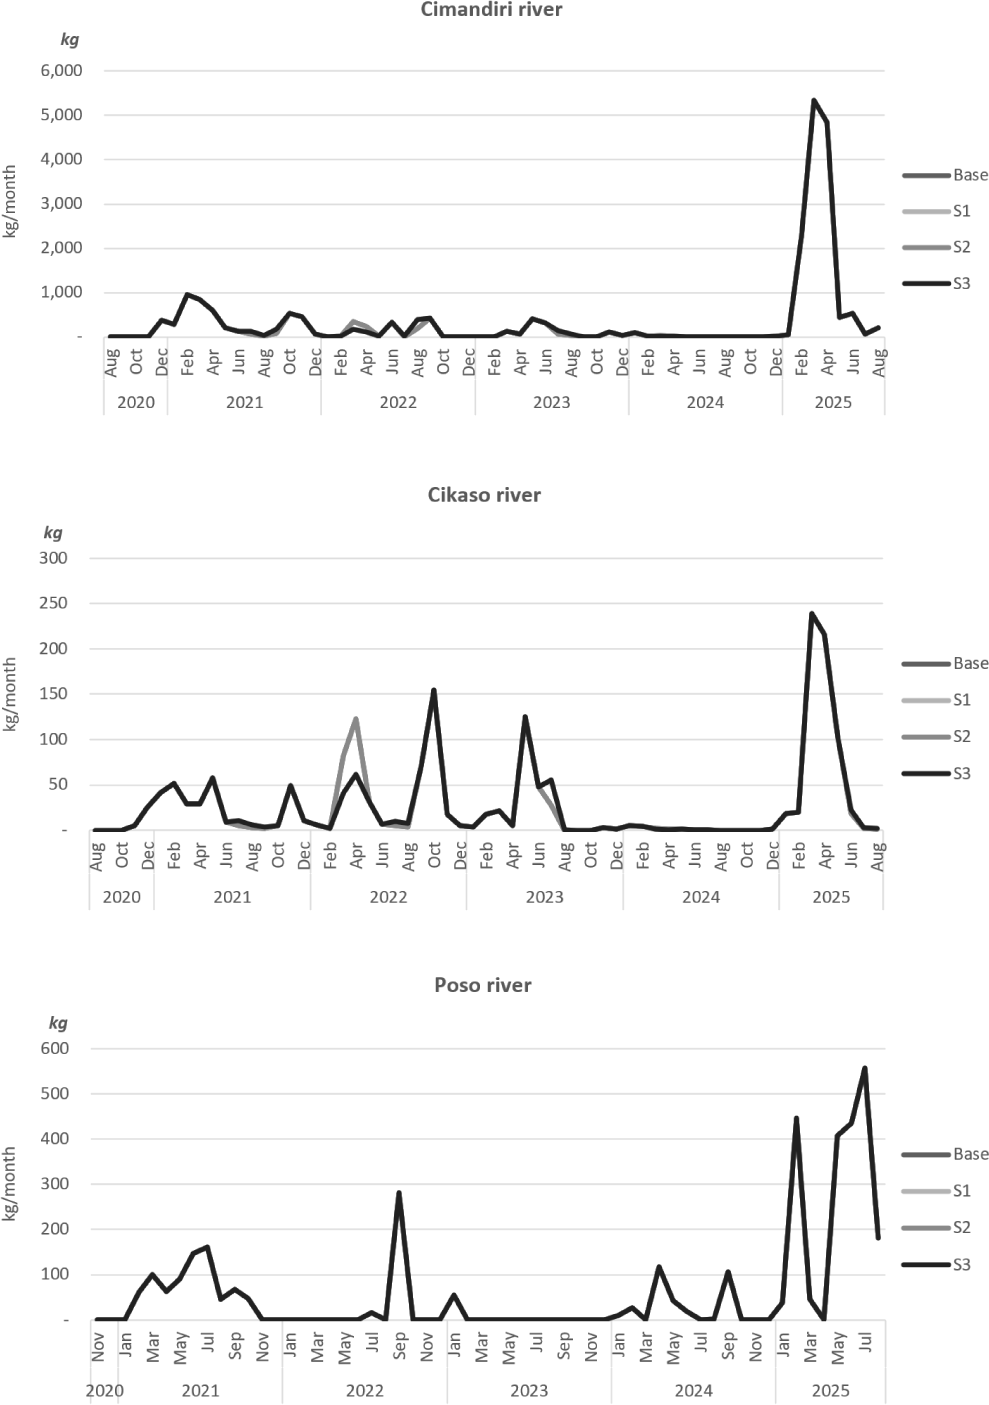
Fig. 6 presents the estimated biomass of glass eel (in kg) from the Cimandiri, Cikaso, and Poso Rivers for the period 2021–2025. In the Cimandiri River, the highest biomass in 2021 was 957 kg in February, in 2022 the highest biomass is 421 kg in September, in 2023 the highest biomass is 411 kg in May, in 2024 the highest biomass is 91 kg in January, and in 2025 the highest biomass is 5,344 kg in March. In the Cikaso River, the highest biomass was shown in May 2021 at 58 kg, in October 2022 at 155 kg, in May 2023 at 125 kg, in January 2024 at 5 kg, and in March 2025 at 239 kg. Meanwhile, in the Poso River, the highest biomass was shown in July 2021 at 161 kg, in September 2022 at 281 kg, in January 2023 at 55 kg, in April 2024 at 117 kg, and in July 2025 at 556 kg.
Table 2 present the total and average biomass on each year in the Cimandiri, Cikaso, and Poso Rivers. Total estimated biomass in the Cimandiri River in 2021 is 4,389 kg, 2022 is 1,562 kg, 2023 is 1,259 kg, 2024 is 176 kg, and 2025 is 13,730 kg. In other words, the total estimated abundance of glass eels in the Cimandiri River in 2021 is 36.5 million glass eels, in 2022 there will be 13 million glass eels, in 2023 there will be 10.5 million glass eels, in 2024 there will be 1.5 million glass eels, and in 2025 there will be 114 million glass eels.
In the Cikaso River, the total estimated biomass and abundance of glass eels in 2021 is 302 kg or 3 million glass eels, in 2022 as much as 508 kg or 5 million glass eels, in 2023 as much as 280 kg or 2.8 million glass eels, in 2024 as much as 15 kg or 0.15 million glass eels, and in 2025 as much as 618 kg or 6.2 million glass eels. The total estimated biomass and abundance of glass eel in the Poso River in 2021 is 782 kg or 7.1 million glass eels, in 2022 as much as 297 kg or 2.7 million glass eels, in 2023 as much as 56 kg or 0.5 million glass eels, in 2024 as much as 324 kg or 2.9 million glass eels, and in 2025 as much as 2,110 kg or 19.2 million glass eels. The trend of abundance and biomass of glass eel from the three locations is almost the same. It showed high yields in 2021, then in the following year it declined and increase in 2025.
Discussion
The estimated abundance and biomass of glass eels in the Cimandiri, Cikaso, and Poso Rivers show pronounced interannual variability, with relatively high recruitment in 2021, a decline during 2022–2024, and a strong rebound in 2025. Such fluctuations are a well-documented characteristic of anguillid eel recruitment worldwide and are generally associated with variability in oceanic conditions, larval transport, and climatic forcing rather than local fishing pressure alone (Dekker, 2003). Fishers’ observations that certain years exhibit extremely high glass eel availability while others show very low or even absent recruitment are consistent with long-term studies on eel recruitment pulses, which often occur irregularly and synchronously across broad geographic scales (Bonhommeau et al., 2008; Knights, 2003). These recruitments “boom-and-bust” patterns have been linked to large-scale climate indices such as El Niño–Southern Oscillation (ENSO) and monsoon variability, which influence larval survival and transport from offshore spawning grounds to coastal and estuarine entry points. In both the Cimandiri and Cikaso Rivers which facing to the Indian Ocean, peak abundance and biomass tended to occur at the beginning and end of the year, suggesting a relatively consistent seasonal recruitment window. This pattern aligns with previous studies in Indonesian and Southeast Asian rivers, where glass eel recruitment often intensifies during periods of increased rainfall and river discharge, which enhance estuarine cues and facilitate upstream migration (Watanabe et al., 2008). In contrast, the Poso River facing to the Tomini Bay exhibited less predictable seasonal peaks, with maximum recruitment occurring in different months across years. Moreover, the unique river-lake connectivity in the Poso system likely contributes to its distinct recruitment dynamics. Previous studies have shown that transitional systems such as estuary–lake complexes can act as ecological buffers, modulating recruitment variability and providing alternative habitats for early life stages (Sugeha, 2010). Furthermore, Sugeha (2010) documented that glass eel recruitment in the Poso estuary occurs throughout the year, with peaks at different times depending on species and seasons, indicating variable recruitment timing in tropical river systems.
Scenario-based modelling results indicate that water current is a key driver of estimated glass eel abundance in the Cimandiri and Cikaso Rivers. The similarity between Base and S2, and between S1 and S3, suggests that the estimated abundance trends in the Cimandiri and Cikaso Rivers were mainly sensitive to monthly observed water current variation. In this study, current variation represents field-measured temporal hydrological changes at the fishing sites, which may be associated with seasonal river discharge, rainfall, tidal forcing, and river-mouth conditions. Thus, the scenario results should be interpreted as sensitivity to observed hydrological variability rather than to simulated flow regimes. This observation is consistent with studies demonstrating that glass eel catchability and upstream migration success are strongly influenced by river discharge, which affects both migration pathways and the efficiency of passive fishing gears such as fyke nets (Tesch & Thorpe, 2007). In the Poso River, all scenarios shown identical results, indicating that variations in water current and depth within the observed range did not significantly affect glass eel catch. This likely follow the relatively small contrast between variable and constant parameter values, as well as the suitability of fyke nets under stable flow conditions. Similar results have been reported in large or regulated river systems where hydrodynamic variability is dampened and gear performance remains relatively constant (ICES, 2020).
Biomass estimates closely followed abundance patterns across all rivers, as expected given the relatively narrow size range of glass eels and the use of site-specific average weights. Average individual weights (0.10 g–0.12 g) are comparable to values reported for tropical anguillid glass eels in Indonesia, the Philippines, and Vietnam, supporting the validity of the biomass calculations. The substantially higher total abundance and biomass observed in the Cimandiri River compared to the Cikaso River likely reflect differences in catchment size, river discharge, and estuarine accessibility, which are known to influence recruitment magnitude (Casselman & Cairns, 2009). Meanwhile, the relatively high biomass in Poso during certain years, despite lower abundance in others, may indicate episodic strong recruitment events linked to appropriate oceanographic conditions rather than consistent annual input. The observed high interannual variability features the importance of long-term, standardized monitoring of glass eel recruitment rather than reliance on short-term trends. Management measures based on single-year data may be misleading and risk either overexploitation during strong recruitment years or unnecessary restrictions during naturally weak recruitment periods (ICES, 2019).
These results support adaptive management approaches, such as effort regulation or seasonal controls that are responsive to recruitment strength, and reinforce the need to integrate environmental drivers into stock assessment frameworks for tropical anguillid eels. The consistency between abundance and biomass trends further indicates that glass eel recruitment indices can serve as a reliable early indicator for future stock availability in inland habitats.
Conclusion
This study provides a multi-year estimation of glass eel abundance and biomass in three Indonesian rivers (Cimandiri, Cikaso, and Poso) demonstrating strong interannual variability and river-specific recruitment patterns. Glass eel recruitment showed relatively high abundance and biomass in 2021, followed by a decline during 2022–2024, and a marked recovery in 2025 across all study sites. These fluctuations reflect the natural recruitment dynamics of tropical anguillid eels and are likely driven by broader environmental and oceanographic processes rather than local fishing pressure alone. Seasonal recruitment patterns were relatively consistent in the Cimandiri and Cikaso Rivers, with peak abundance and biomass occurring mainly at the beginning and end of the year, indicating predictable recruitment windows that are closely associated with changes in river discharge. In contrast, the Poso River exhibited less seasonal regularity, suggesting that local hydrological characteristics and river–lake connectivity may modulate recruitment timing and reduce the influence of short-term flow variability. Scenario-based analyses further indicate that water current is an important factor influencing glass eel abundance estimates in the Cimandiri and Cikaso Rivers, while its effect in the Poso River appears limited within the observed range of hydrological variation. The close correspondence between abundance and biomass trends across all rivers confirms that abundance-based indices provide a reliable proxy for assessing glass eel biomass when supported by site-specific biological measurements. Overall, these results indicate the importance of long-term, standardized monitoring to capture natural variability in glass eel recruitment and to avoid misinterpretation of short-term fluctuations. The results support the use of adaptive, recruitment-informed management approaches for tropical anguillid eels and provide essential baseline information for improving stock assessment and sustainable utilization strategies in Indonesian inland waters.